Release Announcement: Bold BI 13.1.10 has arrived! Explore the latest features here.
-
- Platform

- Platform
-
- Features
- Features
-
- Resources
- Resources


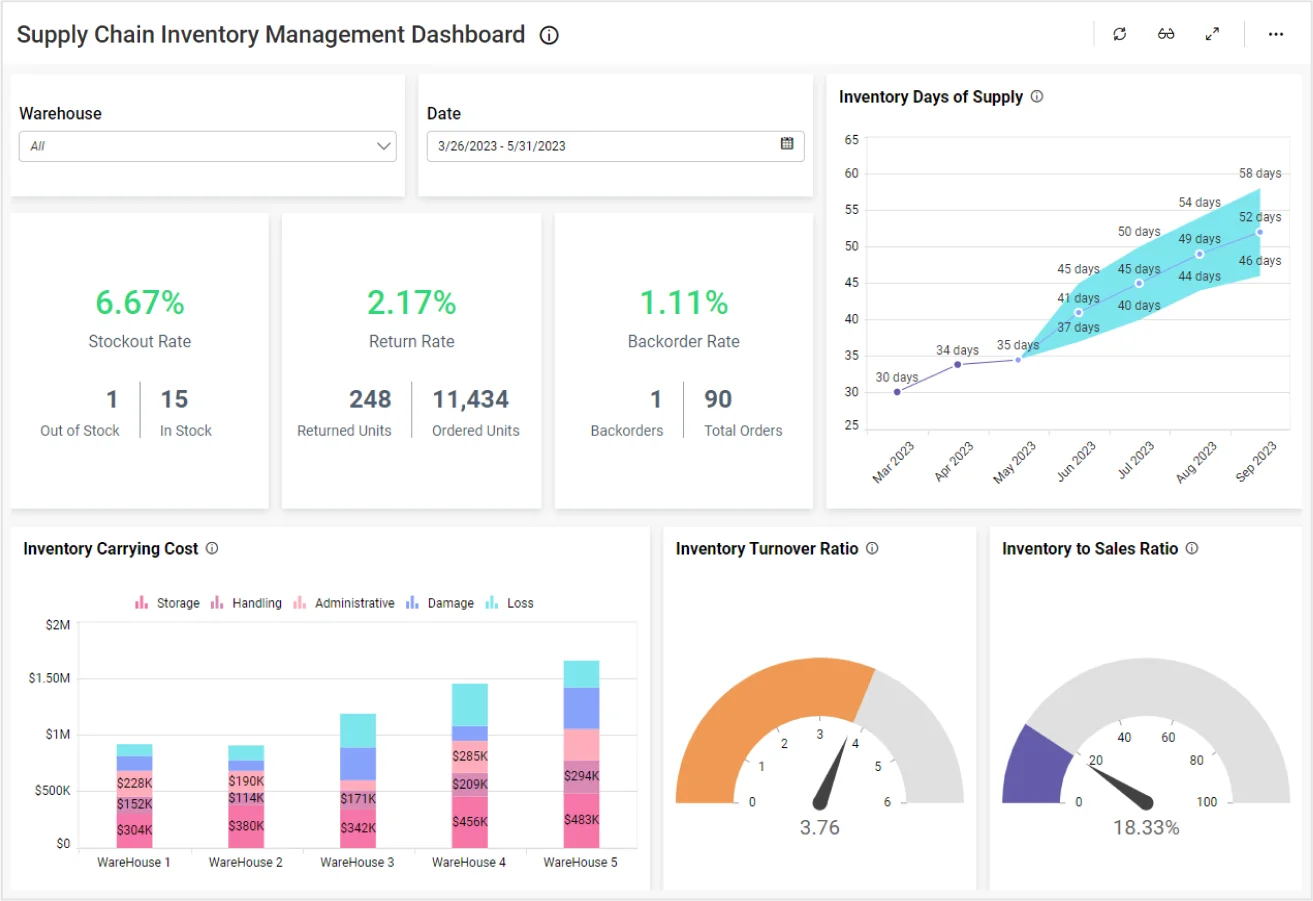
This inventory management dashboard displays key metrics such as inventory days of supply, back order rate, and more. With this dashboard, viewers can answer the following questions:
Are any items out of stock?
How many items have been returned?
How long does it take for us to sell our inventory?
Finally, what are our inventory carrying costs?
These inventory management metrics provide data about the company’s ability to meet customers’ needs. They also offer insight into whether the warehouses are operating efficiently.
Track Product Availability and Financial Metrics
Firstly, widgets such as the Back Order Rate and Percentage of Out of Stock cards outline how well the company is able to meet customer demand. Further, the Product Stock Details chart displays a clear overview of the number of units that are in the warehouse and that have been ordered.
Filter Your Data
It is also worth noting that viewers can filter data by using the “Warehouse” and “Date” drop-down list boxes. With these filters, viewers can choose to view data for any combination of dates and warehouses, from just one warehouse to all of them. For instance, users could view information for Warehouses 2 and 3 for the first week in January. Similarly, they could view metrics for one day in December for Warehouse 4 alone.
Users can reset these filters by clicking the funnel-shaped icons in the upper right corners of the drop-down list boxes. If both filters are reset so that specific warehouses and dates are not selected, we will see the overall numbers for all warehouses.
Analyze Inventory Costs
Other widgets, such as the Return Rate card and Inventory Carrying Cost bar chart, can help the company gain a deeper understanding of their operating costs. This, in turn, can help them devise strategies to function more efficiently.
Finally, the Inventory Turnover, Inventory to Sales Ratio, and Inventory Days of Supply widgets offer insight into how efficiently the company is selling its products. With this data, leaders can make decisions about whether certain products’ inventories should be adjusted.
Supply Chain Dashboard Examples
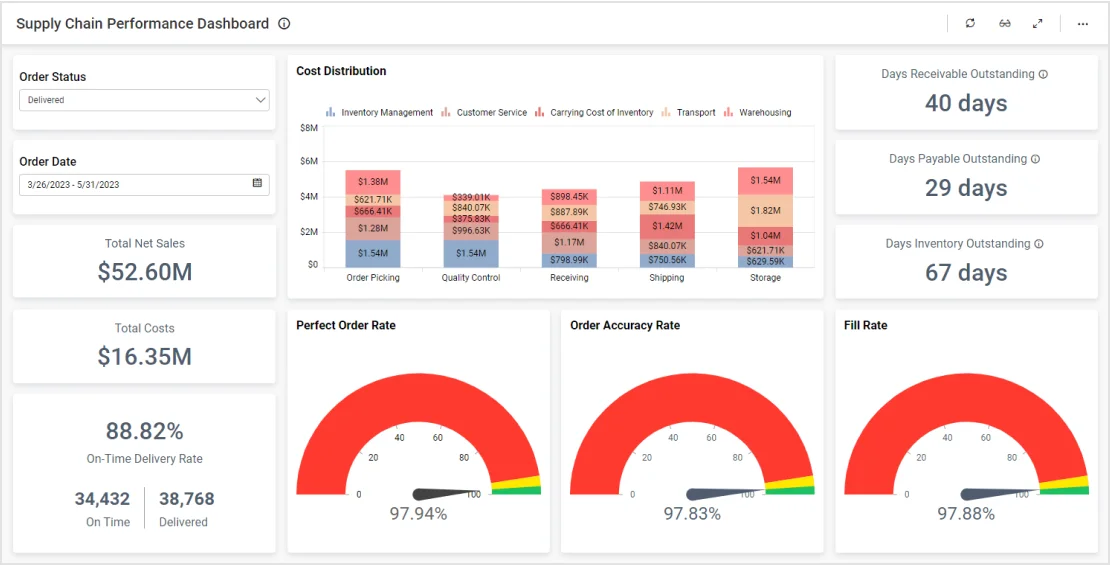
Supply Chain Performance Dashboard
This dashboard provides an overview of a company’s key order metrics. With this dashboard, viewers can answer…..
Learn More View DashboardView Other Solutions
Pharmaceutical
In the field of pharmaceuticals, analyzing production and sales performance…
Learn MoreTelecommunications
Telecom companies depend on data analytics to ensure network performance…
Learn MoreStart Embedding Powerful Analytics
Try out all the features of Bold BI with 30-day free trial and get to know how its fits your embedded analytics needs.
No credit card required.
Embedded Analytics.
Simplified for Any App, Anywhere.

Company
Getting Started
Embedded Analytics.
Simplified for Any App, Anywhere.

Platform
Company
Features
Solutions
Demo
Resources
Solutions
Learning
Solutions