Why Explore Bold BI Dashboard Examples?

Bold BI dashboards aren’t just visuals—they’re powered by features that make data actionable. Here’s why these matters:

Most Popular Category

Start with our most popular dashboard categories across teams and industries.

Why Leading Teams Trust Bold BI to Drive Insights

Bold BI helps teams work faster, save money, and stay in control—use your data smarter and watch success grow.

  • Everything you need, all in one price
  • Empower anyone to build and explore
  • Teams collaborate and share data with ease
  • Grows seamlessly with your business
  • Multi-language support for worldwide localized access

Dashboard Examples

Explore dashboards that help teams quickly turn data into clear, useful insights. 

From finance to marketing, Bold BI helps all departments see the story that lives in their data. Data presented in graphical format allows you to get insights quickly.

Make decisions and act before problems emerge. Avoid risk events and capitalize on more opportunities in your business.

Analytics That Wins Awards and Users

Recognized by G2 and Visual Studio Magazine for delivering standout performance and value.

Users Love usUsers Love us
Visual Studio Magazine GoldVisual Studio Magazine Gold
Visual Studio Magazine BronzeVisual Studio Magazine Bronze
Trust Radius Tech CaresTrust Radius Tech Cares
Leader Fall 2025Leader Fall 2025
High PerformerHigh Performer
Regional Leader Fall 2025Regional Leader Fall 2025
Top 50 G2 ReviewTop 50 G2 Review
Trusted by Users. Recognized by Experts.

Don't take our word for it

Here are a few kind words from some of our happy customers.

Frequently Asked Questions

Absolutely. You can connect your own databases, Excel/SQL, cloud apps, or REST APIs to any dashboard example. Once connected, you can update the visuals, KPIs, and layout to match your exact business needs—no technical setup required.

Every Bold BI dashboard is fully interactive. You can filter data, drill down into trends, compare time periods, and explore details with just a click. It’s designed to help you move from high-level KPIs to deeper insights instantly. 

No technical skills are needed! Bold BI’s drag-and-drop designer makes it simple for anyone—business users, analysts, or developers—to customize dashboards. If you can use a spreadsheet, you can build a dashboard.

Yes. Bold BI supports secure embedding with RLS, SSO, and RBAC, and token authentication. You can safely share dashboards with customers, partners, or internal teams without exposing sensitive data.

Just sign up for a free trial, pick a dashboard example, and connect your data. You can customize it immediately to match your KPIs and business goals. No credit card is required start—exploring within minutes.

More Articles About Dashboard Examples

Check out the articles below for further exploring the benefits you gain from embedded dashboards.

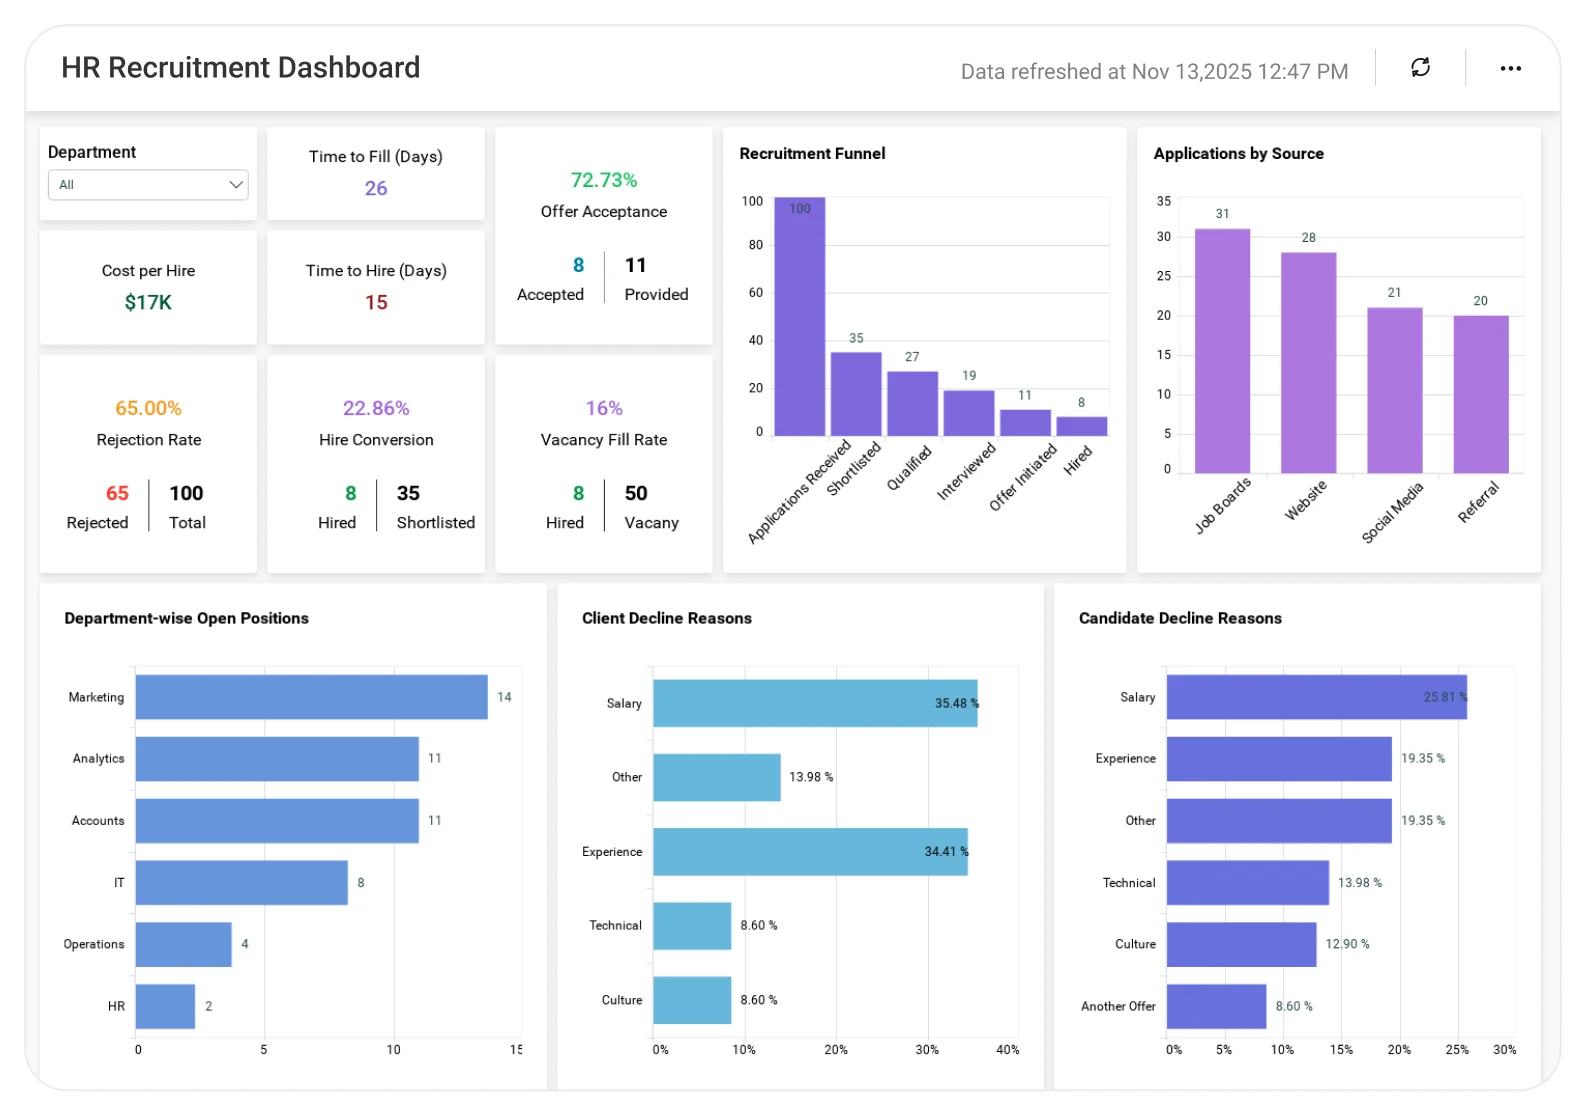
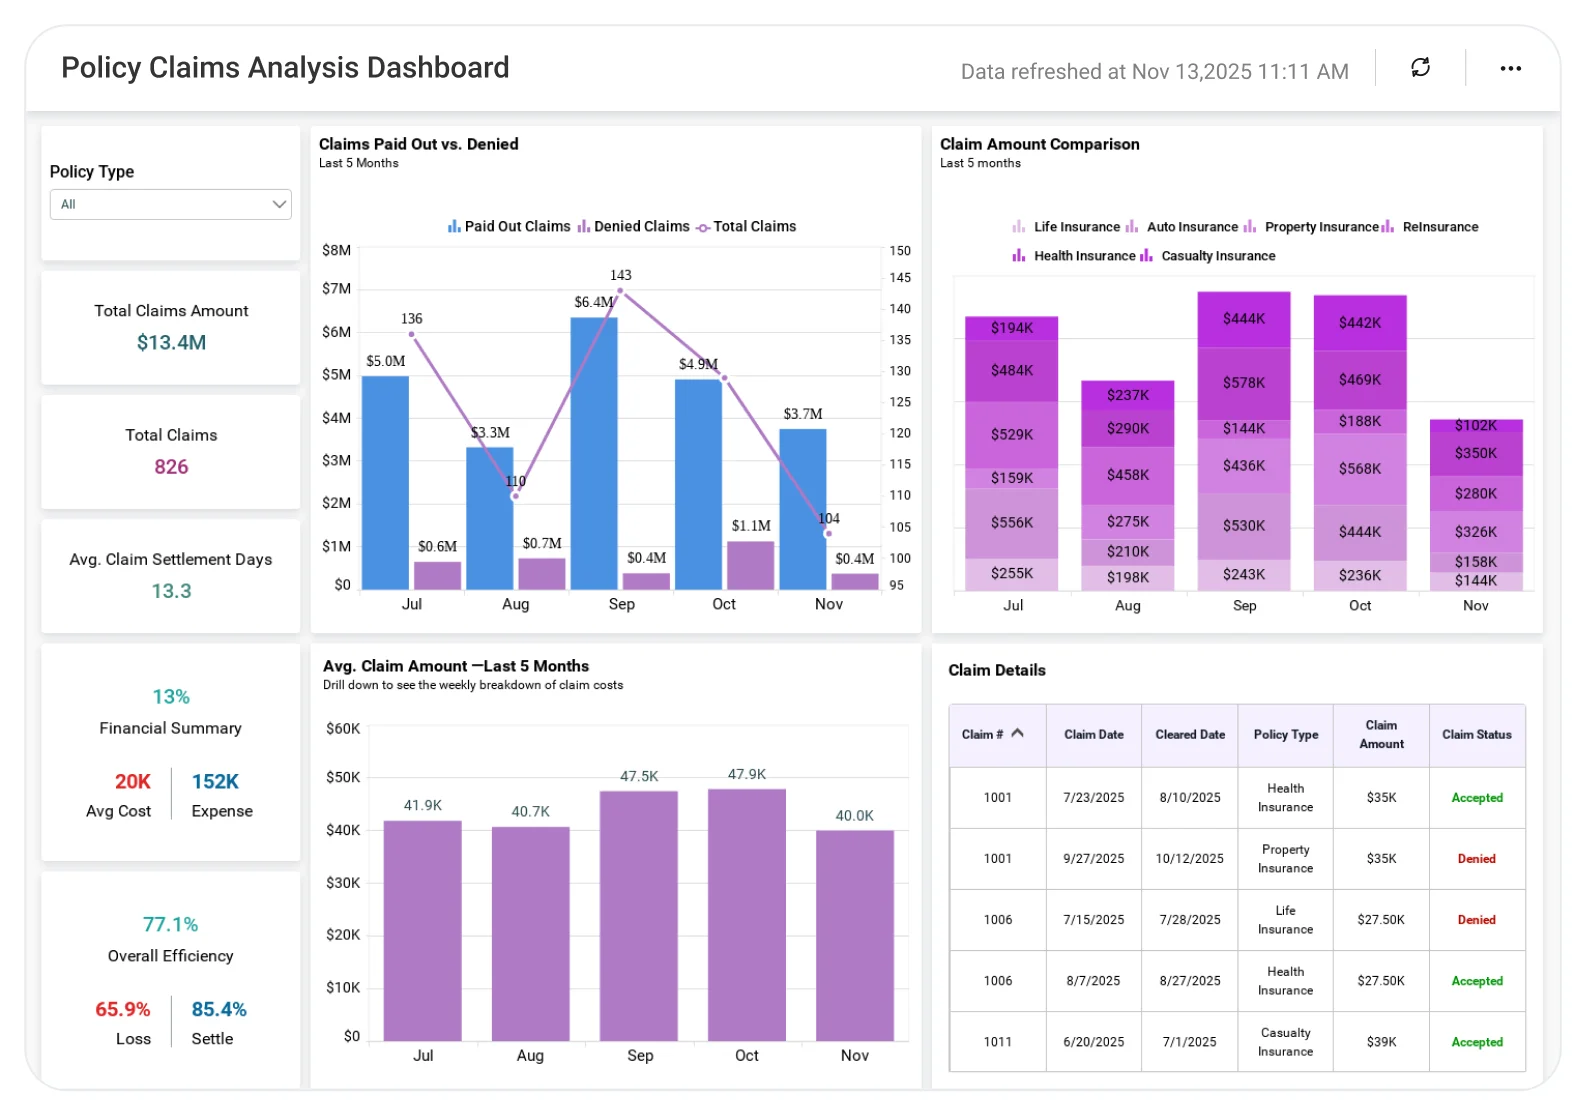
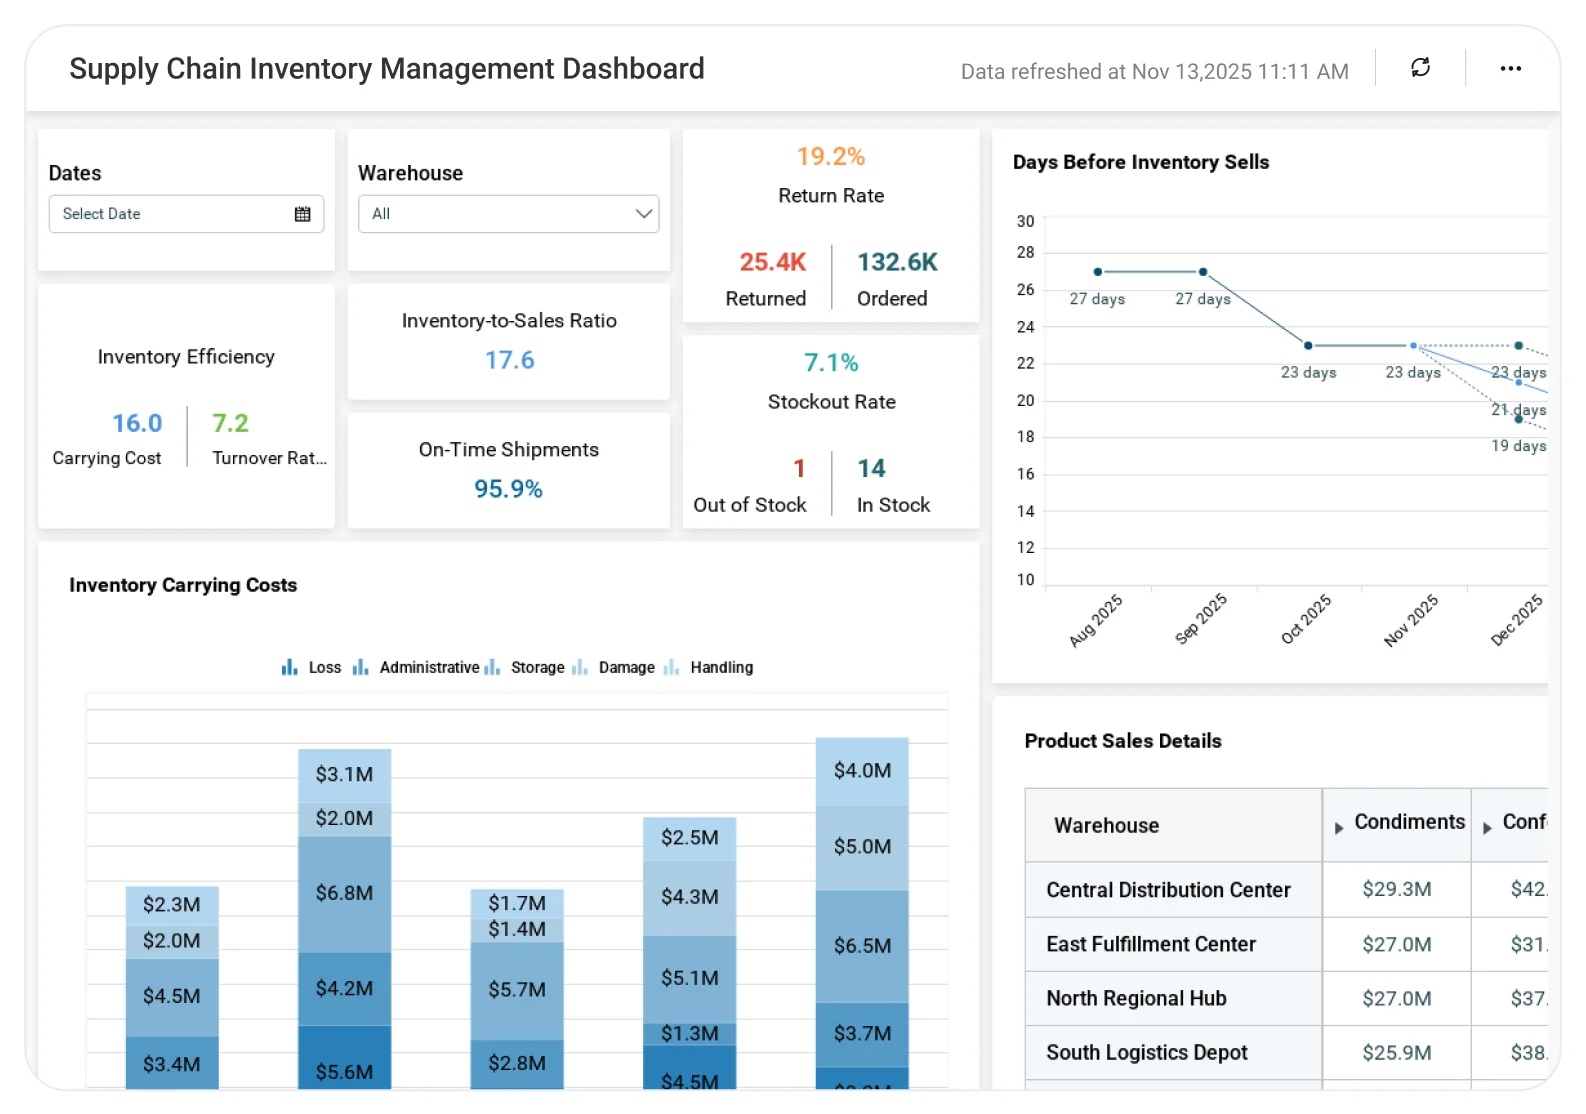
  • 10 Great Business Intelligence Dashboard Examples This blog showcases ten interactive BI dashboards across domains like marketing and finance with live demos, helping users explore versatile templates to build custom solutions quickly.
  • How Data Dashboards Simplify Business Decisions This blog covers the basics of data dashboards, including filters and embedding techniques, with examples that enable seamless interactivity for tracking trends in any business context.
  • BI Unleashed: Data-Driven Solutions for Business Growth Discover how business intelligence (BI) can optimize sales strategies, enhance customer segmentation, track marketing ROI, streamline supply chain operations, improve inventory management, and elevate customer experiences for sustainable business growth.

Start your 30-day free trial instantly

Easy integration, AI-Powered Dashboards and 24x5 real-time support.