
Flat application pricing
See how pricing worksDone with per-user billing?
Application-based pricing means your bill stays flat as your user base grows.

Bold BI by Syncfusion is an embedded analytics and business intelligence platform. It puts white-labeled, multi-tenant dashboards and an AI Copilot inside your application, connects to 140+ data sources, runs in the cloud or on-premises, and is priced per application rather than per user.
Done with per-user billing?
Application-based pricing means your bill stays flat as your user base grows.
Need analytics inside your product?
White-labeled, multi-tenant dashboards via native SDK — not a costly internal build.
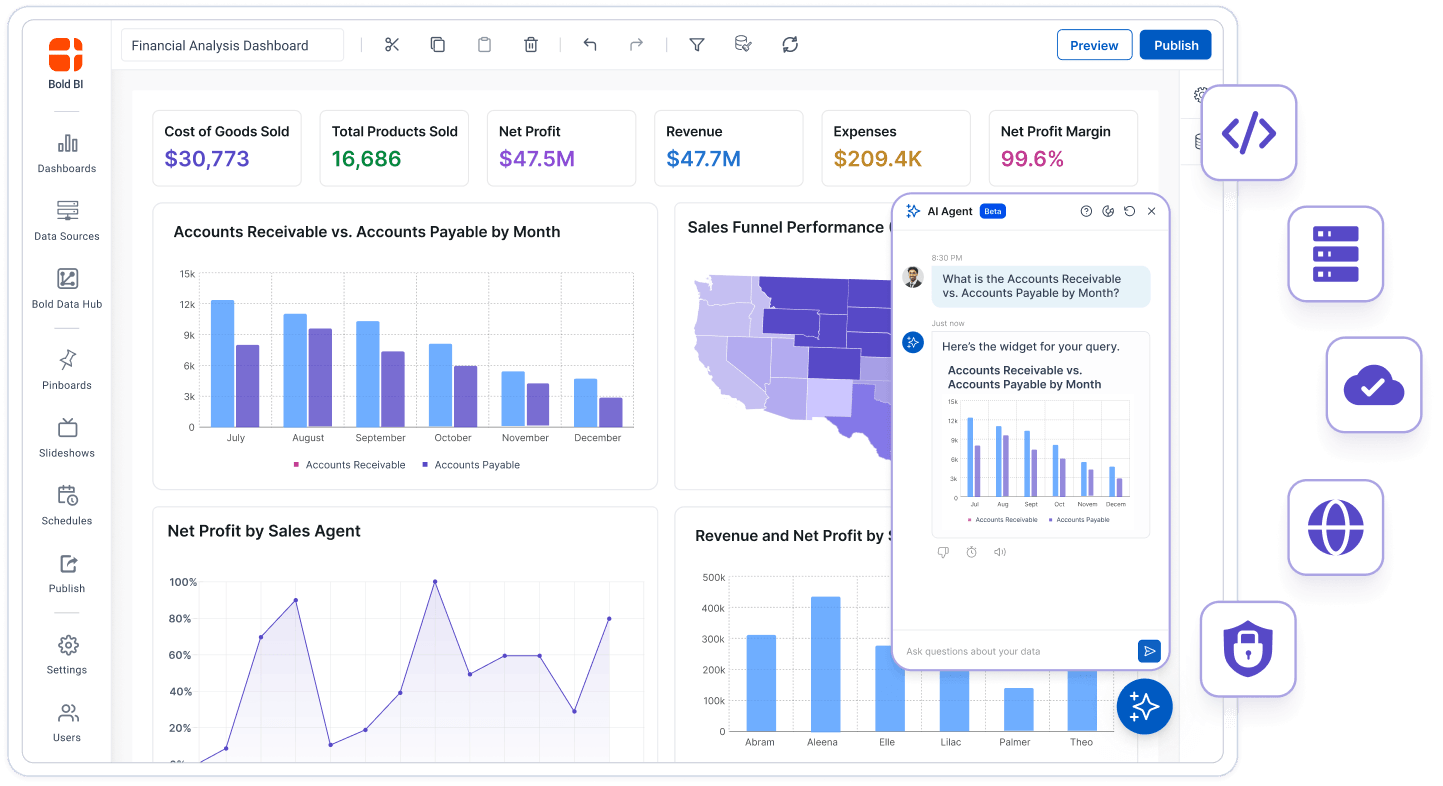
Ask it. Get a dashboard.
Type what you need in plain English — the AI Copilot builds the chart, no SQL required.
Trusted by leading companies
Building a dashboard sends only schema details to the model, and raw row-level records are never sent. On-premises deployments can use their own Azure OpenAI or OpenAI key.
Which regions missed plan last quarter, and by how much?
EMEA missed by 11% and LATAM by 4%. Here's a ranked bar chart with the gap to plan for each region.
Gap to plan by region
No SQL, no chart configuration

Turns prompts into fully designed charts — no coding.

Answers follow-up questions without changing your dashboard.

Explain what your data is saying, in plain language.

It's included in your plan, not billed by the prompt.

Ship White-labeled, multi-tenant dashboards inside your own SaaS product native SDKs, token-based auth, and row-level security, instead of a forever-build you own.

Go from raw data to a live dashboard without SQL, complex formulas, or a ticket to IT. Drag, drop, and let the AI Assistant draft the first version for you.

Full JavaScript SDKs for React, Angular, Vue, .NET, and Blazor. Dashboards render inside your app's DOM, not in a boxed-in frame that breaks on resize or blocks styling.
// renders in your own component tree<BoldBIDashboarddashboardId={id}token={jwt}theme={yourTheme}/>
Serve isolated tenants from a single instance, with row-level security enforcing who sees what — down to the individual dealer, region, or account.

SSO via Okta, Auth0, Azure AD, ADFS, Keycloak, or AWS Cognito. OIDC and OAuth sign-ins map to Bold BI roles, and row-level filters travel in the server-generated embed token.

Your fonts, your colors, your logo — every trace of Bold BI branding removed. Reviewers specifically call this out as making the embedded experience feel truly theirs.

REST and JSON connectors, bearer/JWT-authenticated Web API sources, and dynamic per-tenant connection strings — built for teams whose data sits behind an API, not an open database connection.
GET /api/v1/tenants/{tenant}/metricsAuthorization: Bearer <jwt>X-Row-Filter: region in {claims.regions}Run Bold BI wherever your compliance, security policy, or contracts require including fully air-gapped environments, European data-residency, and public-sector networks.

Fully managed, live in days

Your servers, full control

Isolated managed private cloud
Analyze data with confidence using advanced features that deliver clarity, speed, and actionable insights.

Your data, wherever it lives. SQL databases, REST APIs, cloud warehouses, flat files, and SaaS tools connect without a custom pipeline.

Your brand. Not ours. Full JavaScript SDK for React, Angular, Vue, .NET, and Blazor. Your fonts, your colors, your domain — no Bold BI logo visible to your customers.

Ask it. It builds. Type what you want to see, get a working dashboard back. Follow-ups answered without touching what you already built.

Everyone sees exactly what they should. Row-level filters are passed in the server-generated embed token, so each user only gets their own rows. Works across hierarchies: dealer → region → executive.

One instance. Every customer. Serve isolated tenants from a single deployment — automatic provisioning, per-tenant branding, zero shared data risk.

One login. Full access. OIDC, OAuth, and JWT with Okta, Auth0, Azure AD, ADFS, Keycloak, and AWS Cognito. No separate Bold BI login screen.

Your infrastructure. Your call. Cloud, on-premises, Docker, Kubernetes, or dedicated private cloud.

AI-generated plain-language summaries and automated anomaly alerts — the right person gets notified before they go looking.
From first data connection to a live, White-labeled dashboard inside your product without a dedicated BI team.
Point Bold BI at your source database, REST API, cloud warehouse, or flat file. 140+ connectors, bearer-token and OAuth authentication supported out of the box.
Use the drag-and-drop designer to build from scratch, or type what you want and let the AI Copilot generate the first version. Both paths work. Most teams use both.
Apply row-level security through embed-token filters, map your SSO identity provider, and add your logo, colors, and fonts. What your customers see carries no trace of a third-party tool.
Drop the SDK component into your stack React, Angular, Vue, .NET, or Blazor and it renders natively in your app's DOM. Add tenants, users, and data sources as you grow. The price doesn't move with them.
Recognized by G2, TrustRadius, and Visual Studio Magazine for delivering standout performance and value.
I appreciate Bold BI for making it easier to provide reporting for our customers, allowing both our analysts and customers to easily build and publish reports. The ability to build dashboards and modify queries for specific outcomes is very user-friendly. I value the mobile readiness of the app and its integration capabilities with API structures. The addition of AI features is impressive. The economic pricing model and the effective partnership, which includes consistent and helpful support, make it an invaluable tool for our OEM model.

The support from Bold is unmatched. They do not charge extra for support and it is excellent anyway. All our tickets and questions are quickly answered with authoritative and precise guidance. This is important at the product is complex, powerful and mature. To get the most out of the tool, the level of support they provide is essential.
It was easy to implement data visualizations into our product. The standard widgets allowed us to build professional looking dashboards, and a robust API provided excellent control of the development and runtime process from within our application.
RECOGNITION








Still unsure? Support is free and unlimited ask us anything before you commit.
Bold BI dashboards can be fully white-labeled, so your customers see only your brand. Fonts, colors, logo, domain — everything is yours, and there's no Bold BI branding anywhere your customers can see.
Bold BI never sends raw row-level records to the AI model: building a dashboard sends only schema details, and answers and summaries send aggregated results. On-premises deployments can also use their own OpenAI or Azure OpenAI key, so you're always in control of what's happening under the hood.
Bold BI runs on your own Windows or Linux servers, in Docker or Kubernetes, or in the cloud — your call.
Bold BI's drag-and-drop dashboard designer lets people build dashboards without writing any SQL. And if you get stuck, just type what you want to see — the AI Copilot will build a first draft for you.
Bold BI is priced per application, not per user, so adding users or customers doesn't raise your bill. That's kind of the whole point: add as many users as your business needs, and the price stays the same.
A first Bold BI dashboard takes minutes on Bold BI Cloud, days on Managed Private Cloud, and weeks On-Premises. There's no proprietary language to learn, no complex modeling layer to set up first. And if you hit a snag, support is free and unlimited — not a paid add-on.
Start with the embedded analytics buyer's guide, or see Bold BI side by side with:
Thirty days, no credit card required. Full feature access from day one.