Design Interactive Dashboards Easily
Bold BI makes it easy to build interactive dashboards—no coding required. Explore live metrics, drill into details, apply filters, get answers instantly with AI, connect diverse data sources, and collaborate securely—all in one place.
No credit card required.

Trusted by world-class companies


Effortless Dashboard Design & Customization
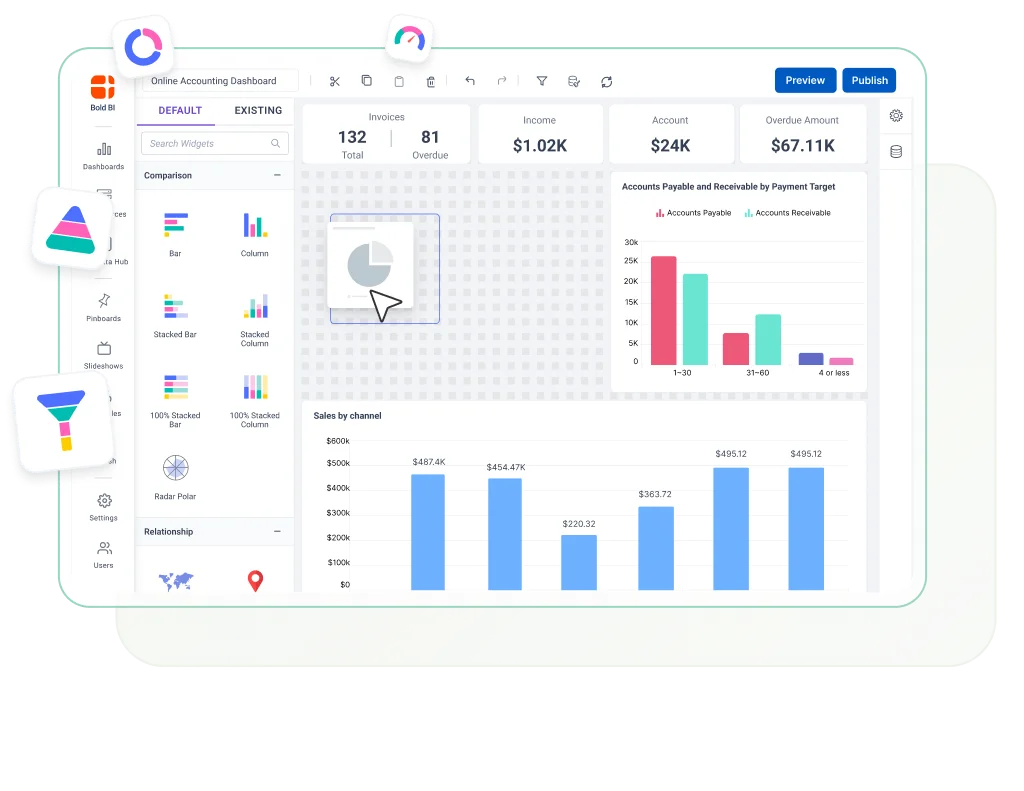
Drag-and-Drop Dashboard Designer
Design dashboards with a simple drag-and-drop interface. Add, resize, and arrange visuals and widgets—no tech skills needed.
Advanced Theming & Custom Styling
Match dashboards to your brand with flexible colors, fonts, and layouts. Keep a consistent look across products and teams.
Extensive Data Visualization Library
Choose from 40+ charts, maps, gauges, and KPIs to turn data into stories—each one can be customized for your needs.
AI-Powered Dashboard Creation
AI-Assisted Dashboard Building
Just describe what you want, and Bold BI AI Copilot suggests and builds dashboards automatically. Refine visuals with drag-and-drop ease.
AI-Powered Q&A Widget
Ask questions in plain language—Bold BI instantly generates relevant charts and answers. It’s the fastest way to explore data and uncover trends.
AI Summarization & Insights
Let AI highlight patterns, outliers, and correlations automatically. Understand key business movements without manually digging through data.
Seamless Data Preparation & Integration
Integrated Data Preparation
Connect to 120+ data sources like SQL, REST APIs, cloud apps, and spreadsheets. Unify data fast—no complex setup needed.
Smart Visual Data Modeling
Easily combine, filter, and clean your data using a visual editor. See changes instantly and get your data ready for insights.
Calculated Fields & Metrics
Create new data points using simple formulas. This helps you uncover deeper insights and trends.
Built-In Data Hub (ETL)
Use Bold Data Hub to clean and prepare your data. It processes the data and provides meaningful data for the dashboards.
Dynamic Data Exploration & Interaction
Dynamic Filters & User Controls
Add dropdowns, sliders, and other controls so users can adjust what they see. This makes dashboards more personal and useful.
Row-Level Security with User Filters
Show different data to different users based on their roles. You can preview dashboards as each user to make sure everything looks right.
Real-Time Data Interaction
Work with live data that updates automatically—no manual refresh needed. Stay on top of the latest information as it changes in real time.
Version Control for Collaboration
Track changes to your dashboards and go back to earlier versions anytime. Collaborate easily and keep everything organized.
Support and Resources
Get the most out of Bold BI with helpful guides and expert support.
Comprehensive Documentation
Find step-by-step instructions and tips to use Bold BI effectively.
Tutorials and Webinars
Learn from experts through videos and live sessions to sharpen your skills.
What Our Customers Say About Us
See what our customers say about us and our embedded analytics and business intelligence product.
What we liked best was the ability to connect to on-prem data sources, easy connectors, embedding visualizations, and a reasonable cost.

We evaluated a bunch of dashboard solutions for one of our top clients. Finally, we zeroed down on Syncfusion. We are super happy with the results.

I like a lot of the dashboard features. The new user management server helps me to handle the users and authentication all in one place.

Now I can basically provide anything the customer needs from their dashboard, and I really don't have limitations. I can customize anything.

Transform Data into Actionable Insights—No Coding Required
Build, customize, and share dashboards with ease using Bold BI’s intuitive dashboard builder.
No credit card required.


