Data Mashup: The Key to Unlocking Business Insights

Businesses are inundated with data from their daily operations. Extracting useful insights from this vast amount of data can be challenging for data analysts. To address this issue, data mashups have emerged as a solution by combining information from various sources to create a comprehensive dataset. This enables organizations to make more informed decisions about their operations overall or at a granular level, such as their social media, CRM systems, and marketing. In this article, we will explore data mashups and how they can be used to boost your business insights.
What is a data mashup?
A data mashup combines data from various sources to create a single dataset for analysis and visualization. By using data mashups, companies can unveil new insights, save time on analytical operations, establish a single location for important data, and more.
Steps to perform data mashups
- Identify the data sources you want to include in the mashup. Consider all your web services, databases, and other data repositories.
- Retrieve the data using APIs or web services to directly access the data or query databases.
- Clean and normalize the data from the collection so that it can be combined and analyzed.
- Combine the data using techniques such as joining, merging, or aggregating.
- Analyze the data to extract insights and patterns that were not apparent when the data was in its original, siloed form.
- Visualize the data to make it easy to understand and communicate what’s in it. This can involve charts, graphs, and other visualizations that highlight the data’s key segments.
Benefits of data mashups
Data mashups are becoming increasingly popular in business as they offer a comprehensive view of a business’s information. The benefits include:
Identify new opportunities

Data mashups provide a comprehensive dataset, and in the process improve data quality and accuracy, facilitate better visualization and reporting, and increase business agility and efficiency. By leveraging them, organizations can identify new opportunities and ultimately drive better company outcomes.
Improved efficiency
Data mashups make it easier for enterprises to access data from multiple sources, reducing the time and effort required to manually collect, extract, and analyze it. This results in cost savings and more efficient business operations.
Better customer experiences

Data mashups help companies better understand their customers by combining data from various sources such as social media, customer feedback, and purchase histories. This allows businesses to tailor their products and services to meet the needs of their customers, resulting in a better customer experience.
Improved marketing
Data mashups help businesses create more effective marketing campaigns by combining data from different fields, such as demographics, purchase histories, and social media interactions. They can leverage this information into targeted marketing efforts and increased marketing ROI.
Better decision-making

Data mashups give firms a more holistic view of their data, including information on customers, products, research, development, marketing, and market trends. They enable stakeholders to make better choices based on data-driven insights, resulting in better outcomes and improved business performance.
Challenges of data mashups
Data inconsistency: Combining data from disparate sources can lead to or reveal inconsistencies in the data. The data may have different formats or units, making it difficult to combine and analyze.
Data quality: The quality of the data used in the mashup significantly impacts the results’ accuracy. If the data is incomplete, outdated, or incorrect, it can lead to erroneous conclusions.
Data privacy and security: Combining data from your sources can raise privacy and security concerns. Ensuring sensitive data is not exposed or shared inappropriately can be difficult.
Technical complexity: A data mashup can be a technically complex process that requires specialized skills and tools. It requires knowledge of data integration, ETL (extract, transform, load) processes, and different data formats.
Cost: Data mashups can be expensive, especially if the data sources are diverse and require extensive integration efforts. The cost of acquiring, cleaning, and integrating data can be high.
Best practices for implementing data mashups
To ensure successful implementation, following best practices and ensuring accuracy, consistency, and security are important. These include:
Clearly define the problem: Before creating a data mashup, it is important to clearly define the problem or objective you are trying to solve to help identify the relevant data sources and the metrics you need to produce.
Identify relevant data sources: Once you have defined the problem, identify the relevant data sources that can help you solve it. These data sources can be internal or external, structured or unstructured.
Understand the data: It is important to understand the data you are working with deeply. This includes understanding the data structure, data quality, and any limitations or restrictions on the data.
Choose the right integration tools: Many tools are available for data mashups. Choose the right tool that fits your needs, budget, and technical capabilities.
Develop the data mashup: Once you have identified the relevant data sources and chosen the right tool, develop the data mashup. This involves combining and transforming the data to make it useful for analysis.
Data security: Use encryption techniques for data storage and transmission, ensuring only authorized users can access the data. Implement robust access control mechanisms, including authentication and authorization, to restrict data access based on predefined user roles and permissions.
Test and validate the data mashup: It is essential to test and validate the data mashup to ensure that it is accurate and reliable. This involves testing the data for completeness, accuracy, and consistency.
Visualize and communicate the results: Once you have developed and validated the data mashup, visualize and share the results. This can include dashboards, reports, and visualizations that help stakeholders understand the insights and make better decisions.
A business intelligence (BI) tool enables organizations to collect, analyze, and visualize large volumes of data from diverse sources. It facilitates data mashups by allowing users to integrate and transform disparate data sets into a unified and coherent format.
Data mashup examples
Let’s see some real-world examples of tools that can be produced from data mashups.
Conversion rate
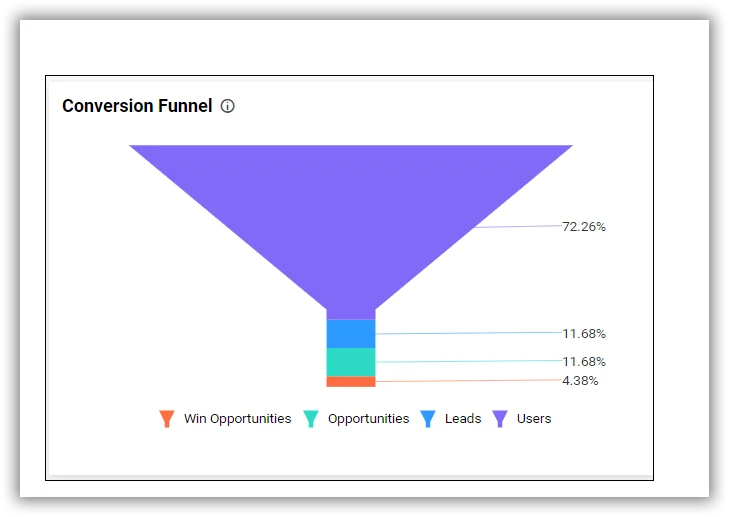
This KPI is important to understand the customer journey and improve your website performance. By integrating data from your website analytics tool (e.g., Google Analytics) with the data from your CRM software (e.g., Salesforce), you gain valuable insight into user behavior, leads, and opportunities, and can turn that insight into changes that result in better user experiences, higher engagement, and ultimately increased conversion rates.
Top landing pages by revenue
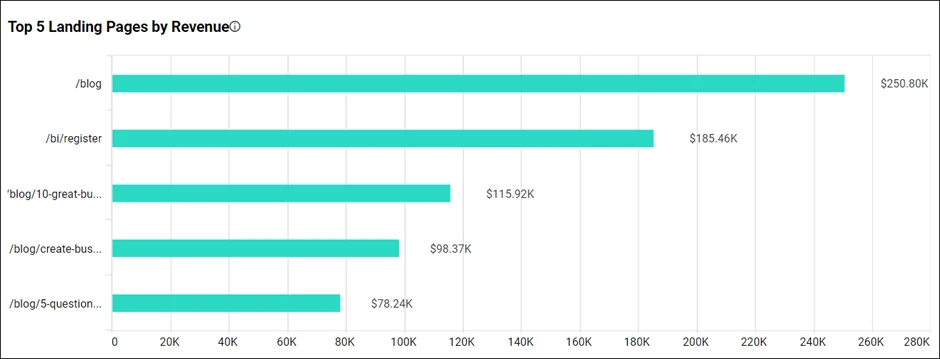
Businesses track this KPI to identify which of their website landing pages that generate the most revenue. By integrating data from your website analytics tool with the data from your payment processing software (e.g., Stripe), you can understand which pages of the website most often lead to a purchase. You can then analyze why those pages are effective, and apply those lessons to other parts of your website.
How Bold BI works with data mashups
Bold BI® is a powerful business intelligence platform that allows organizations to analyze and visualize their data in a meaningful way. With it, users can embrace the potential of data mashups and unlock the true value of their data. Just pull in data from any data source to create data mashups and then visualize them in custom dashboards that provide a comprehensive view of every segment of the business. Read these blogs to learn more about bringing different types of data together into a single, interactive dashboard with Bold BI:
- Track Website Conversions and Revenue Together
- Track Your Website Conversions and Sources in One Place
If you’re ready to dive deeper into analytics that can drive business growth, sign up for a free trial of Bold BI® today.