

03:44
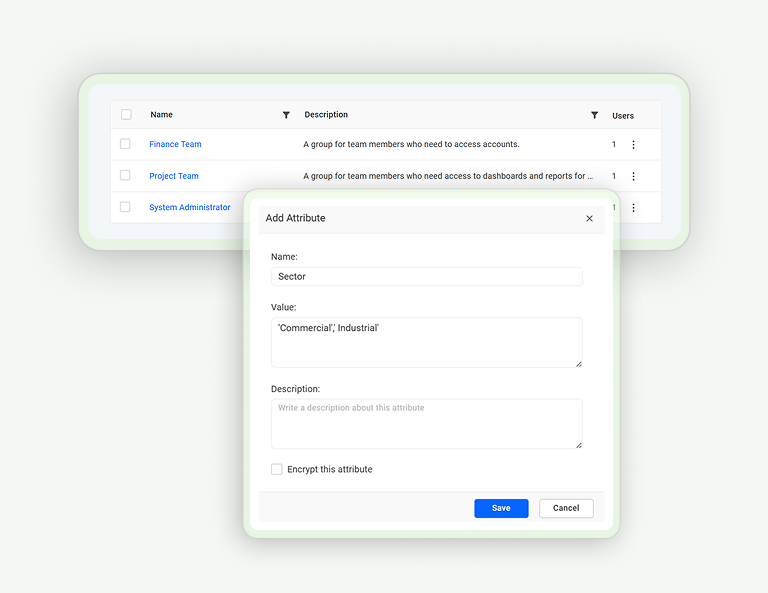
How to Configure Custom Attributes at the Group Level
03:28
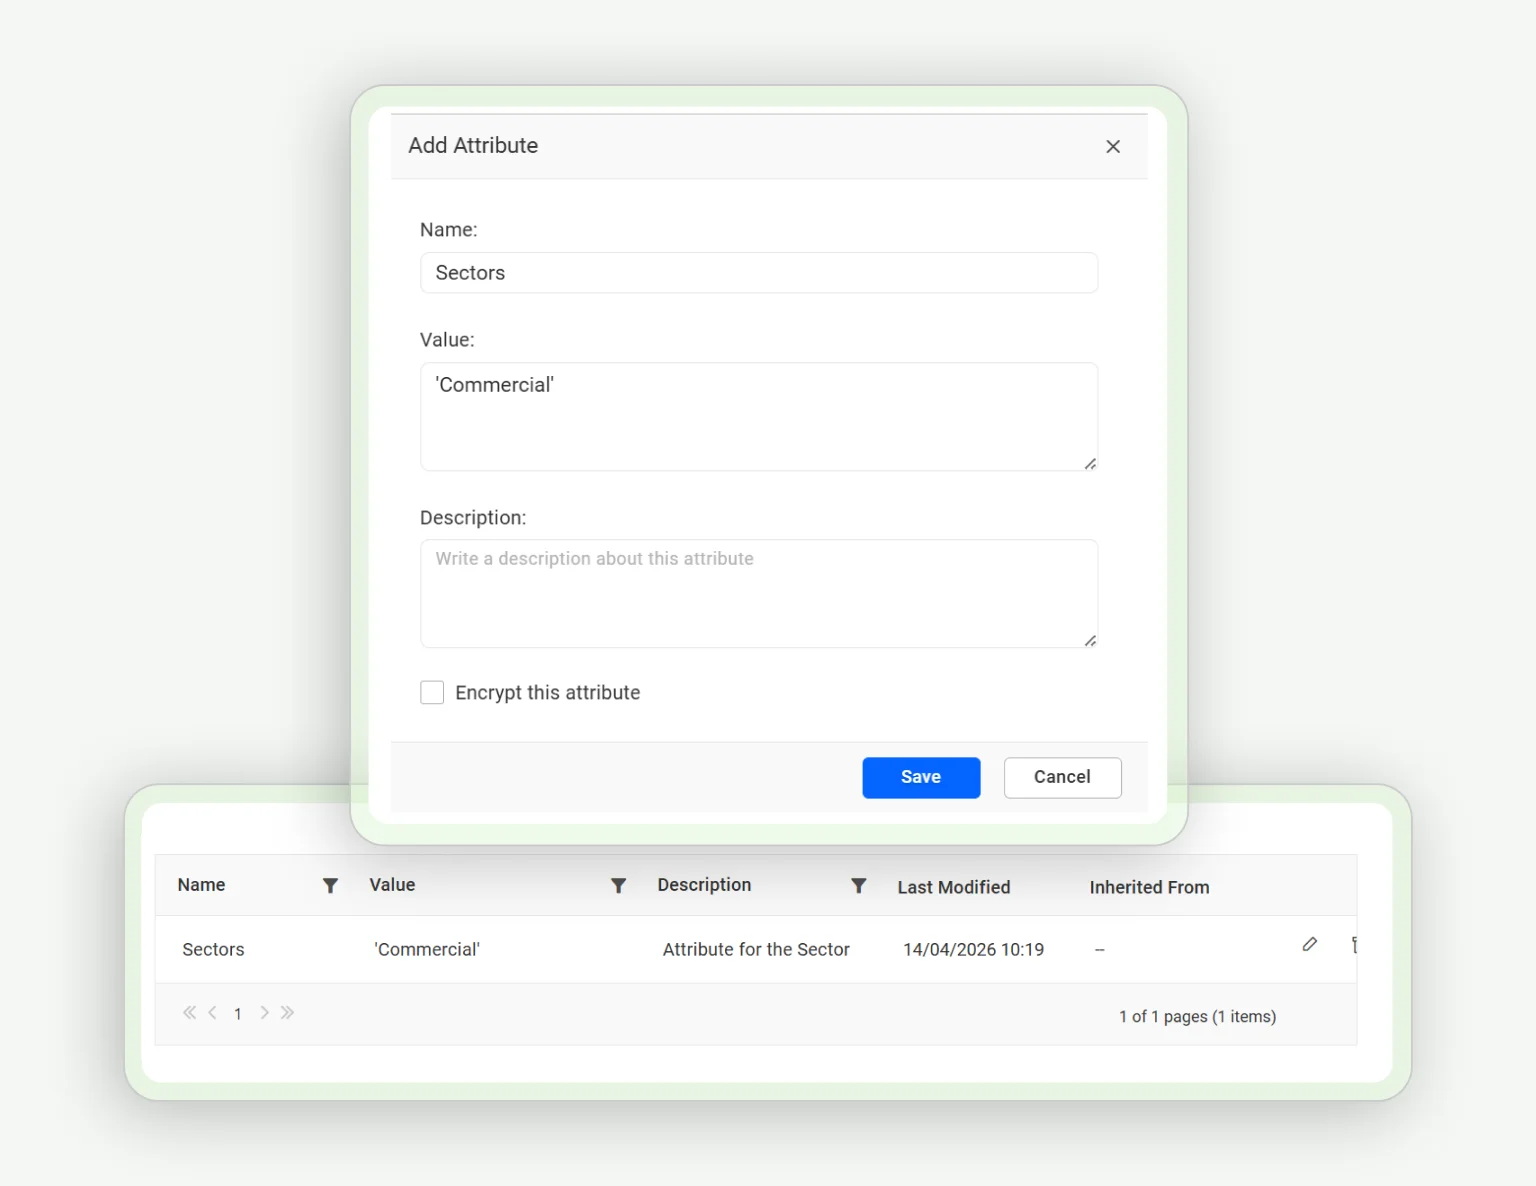
How to Configure Custom Attributes at the User Level
03:06
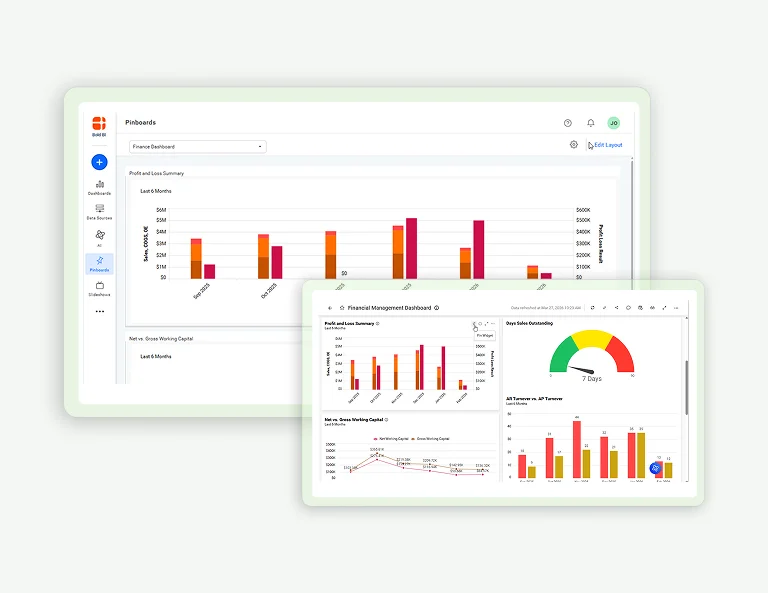
How to Manage Pinboards
03:14
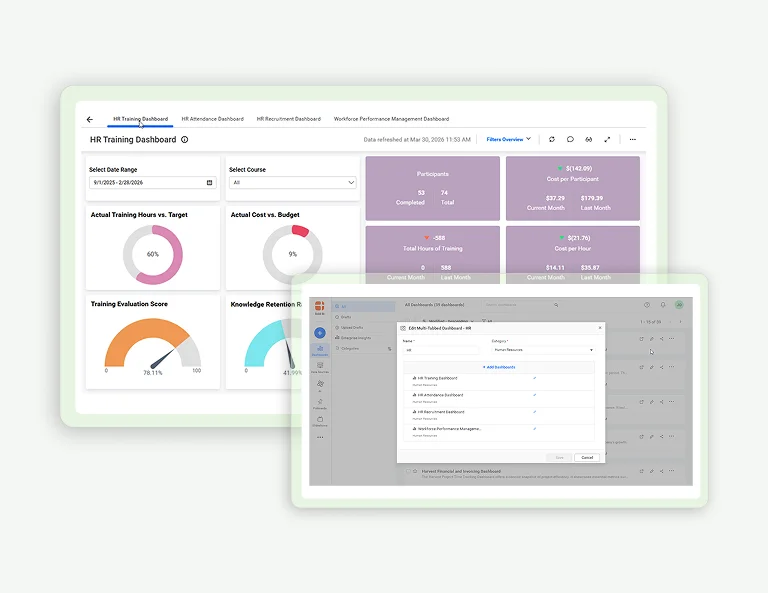
How to Manage a Multi-Tabbed Dashboard
03:05
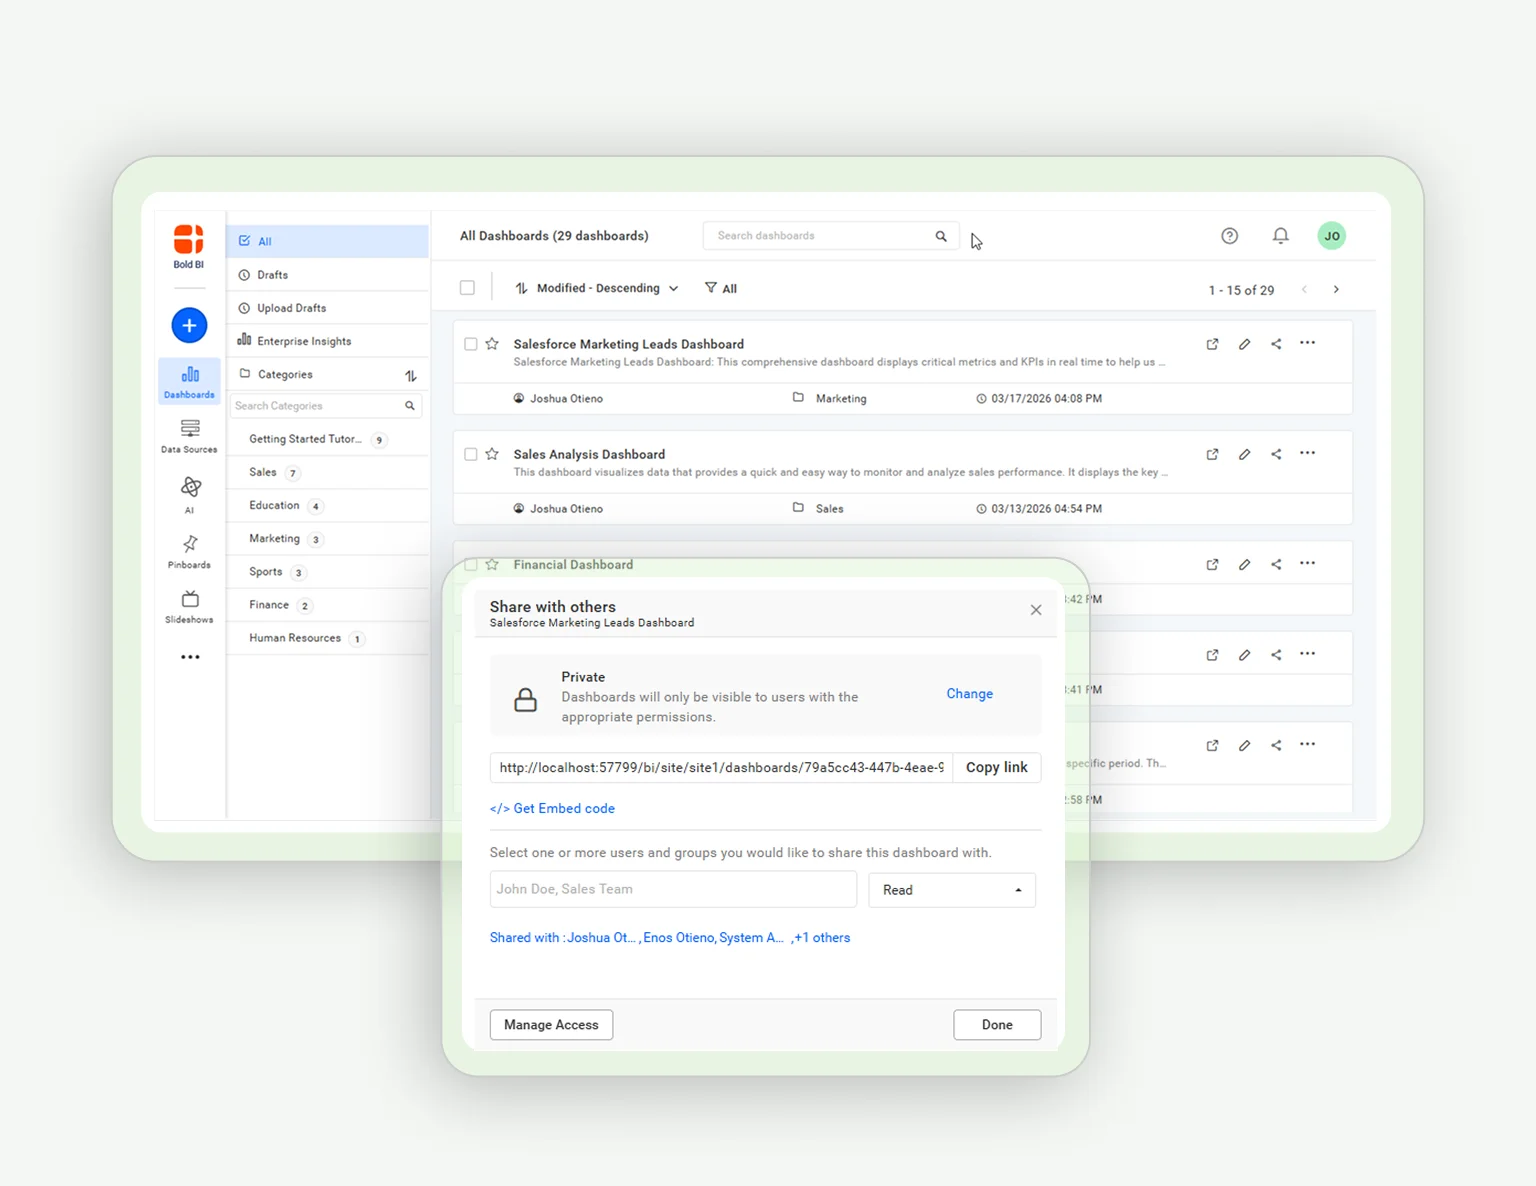
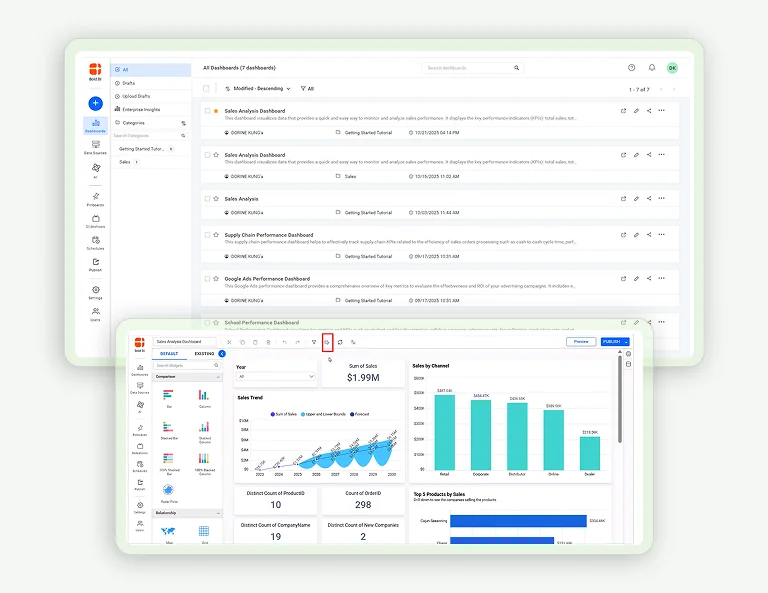
Dashboard Management: Move, Share, & Delete
04:08
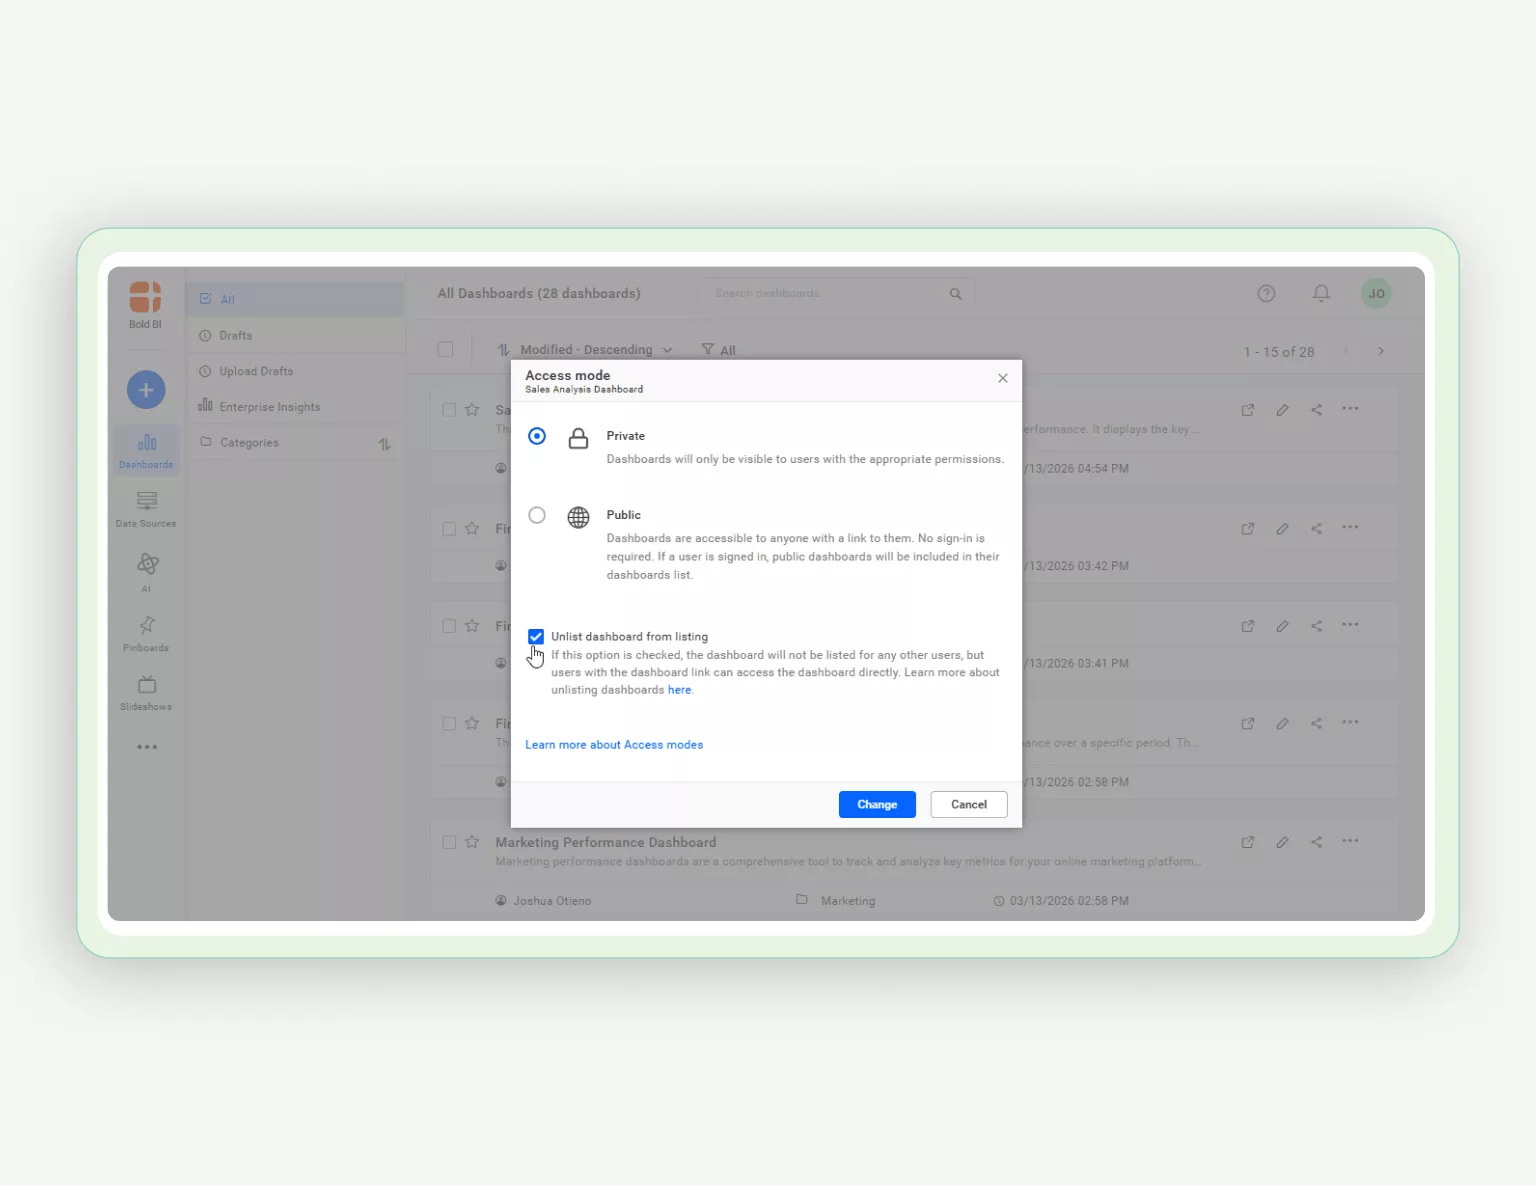
How to Manage Favorites and Unlist Dashboards
02:41
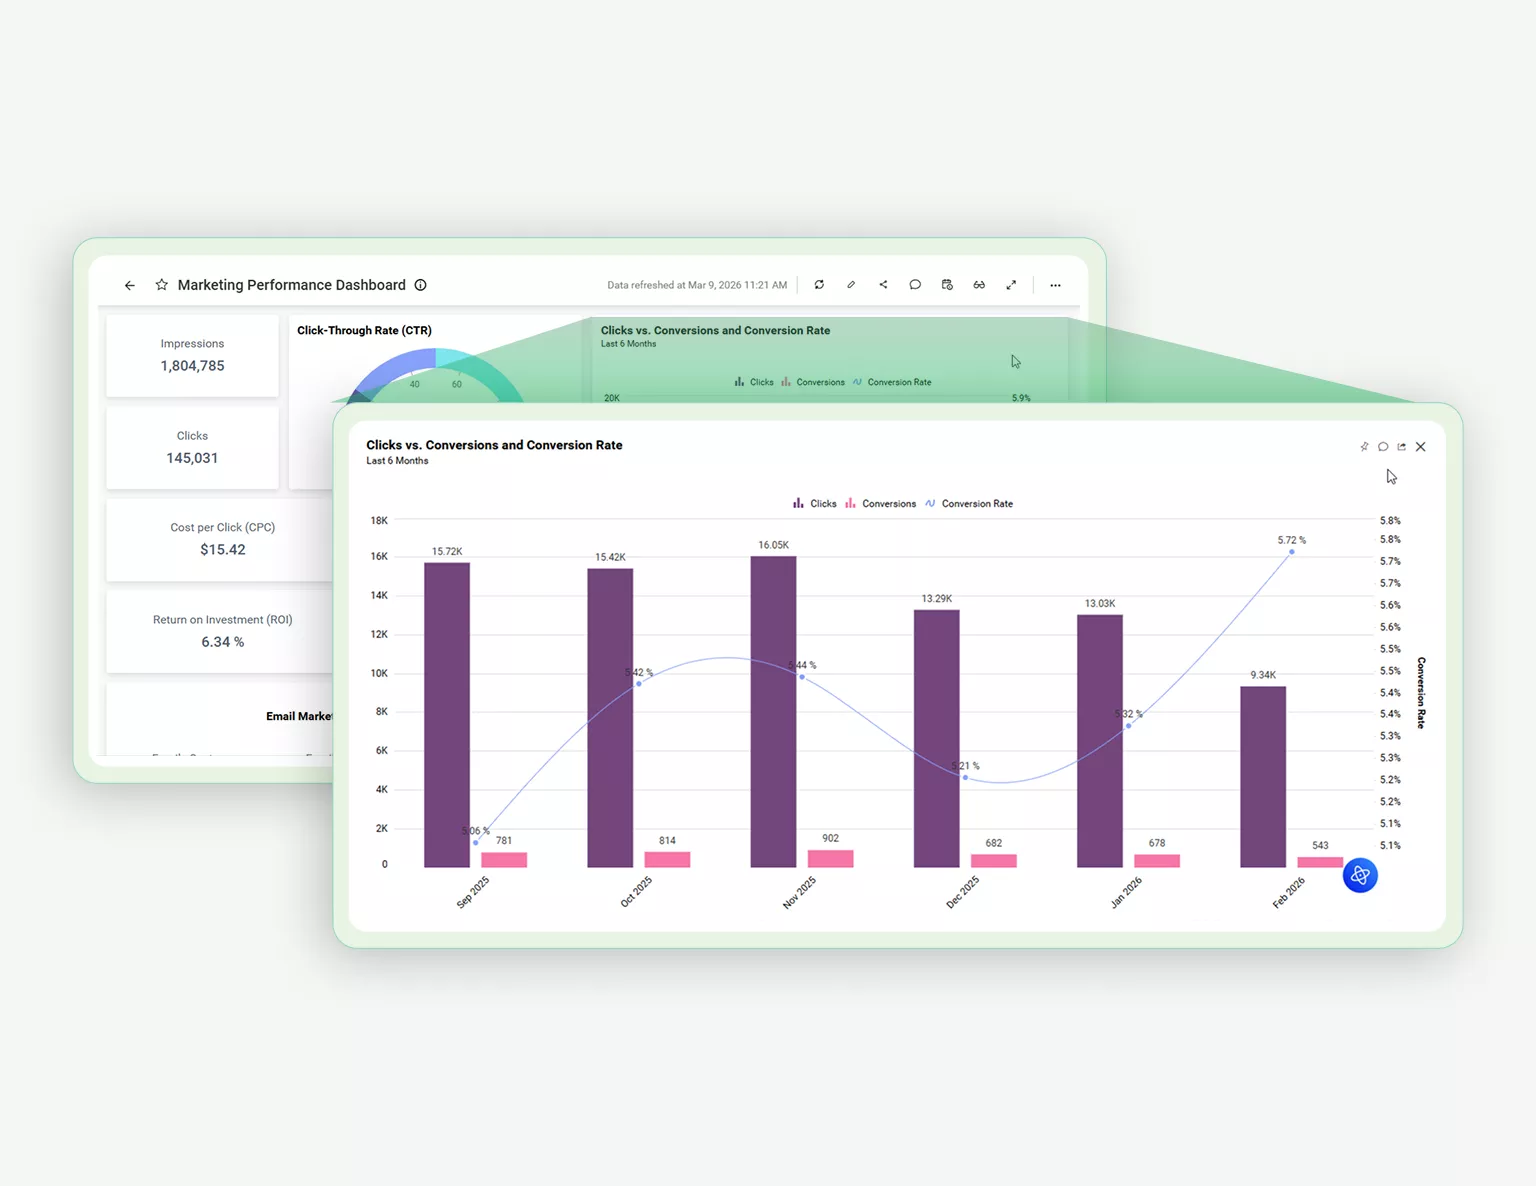
How to Get a Dashboard Link and Maximize Widget View
02:36
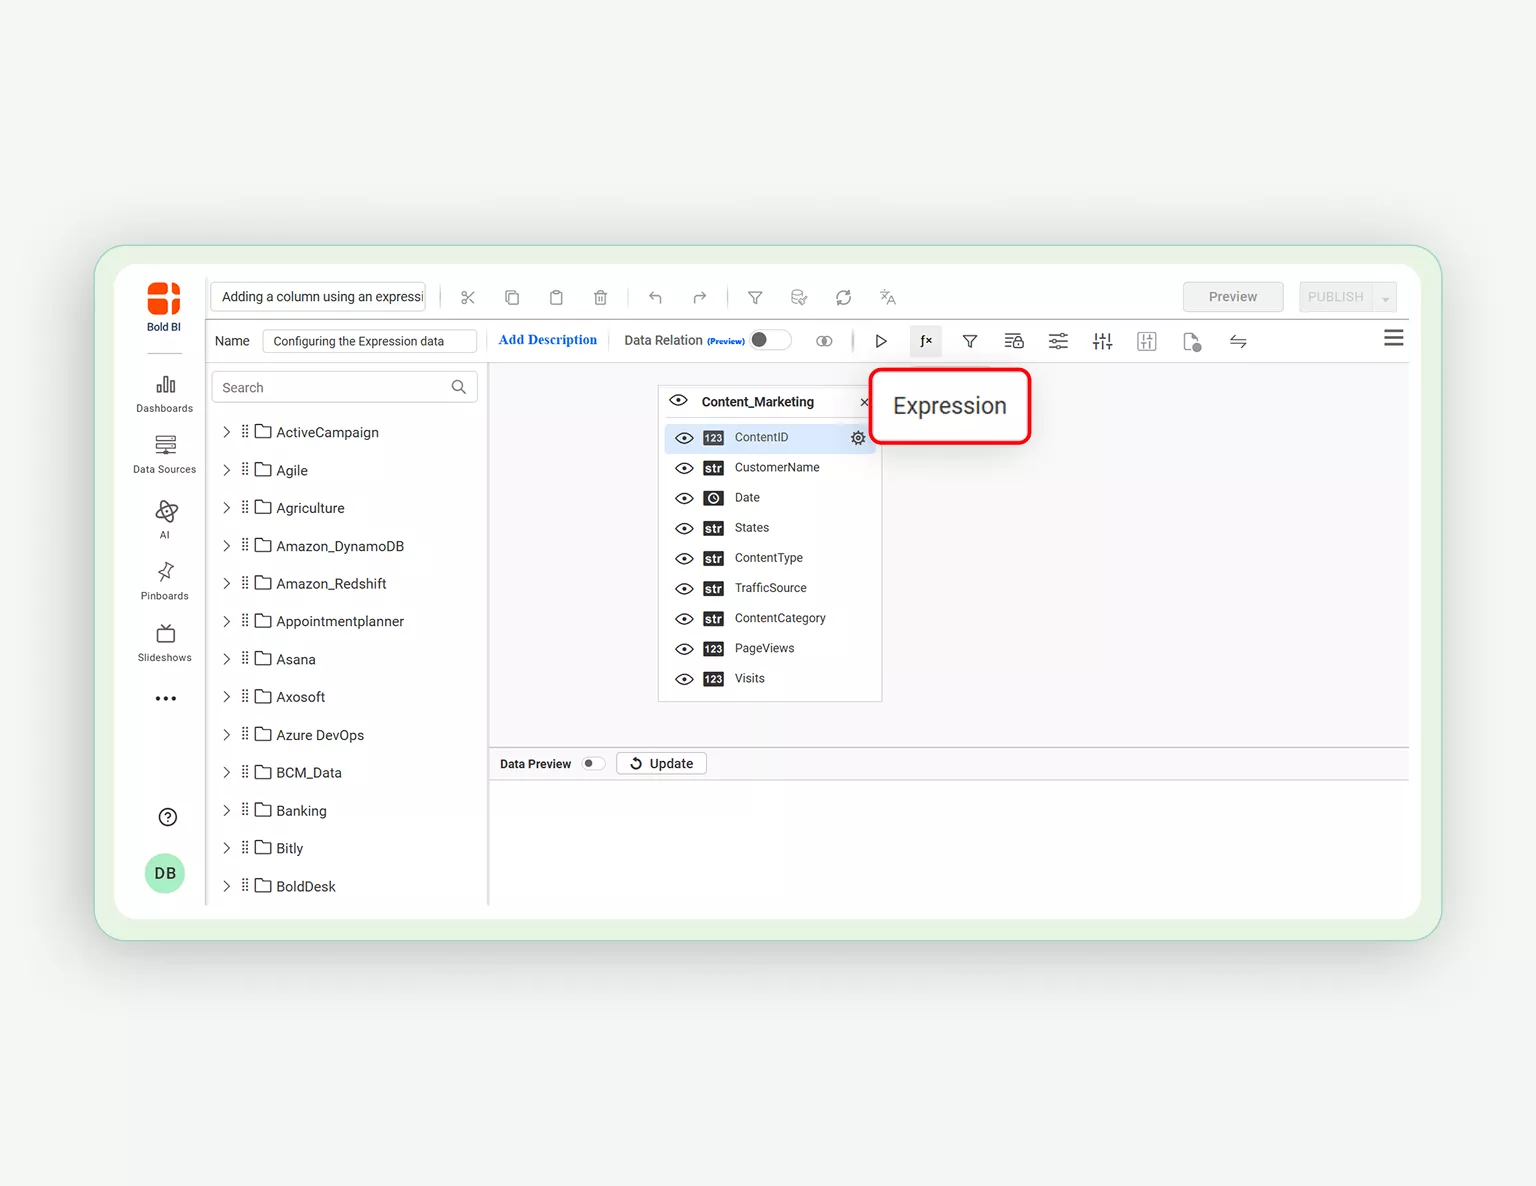
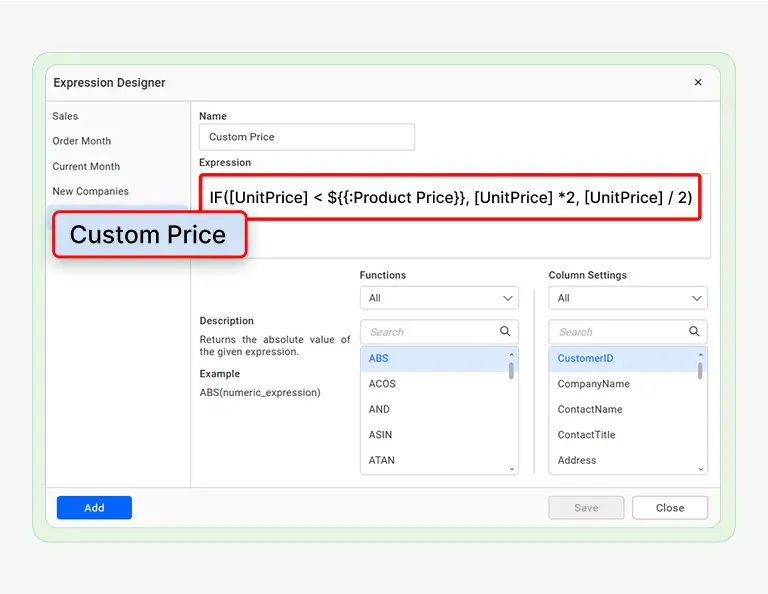
How to Add a Column using an Expression in Query Designer
03:23
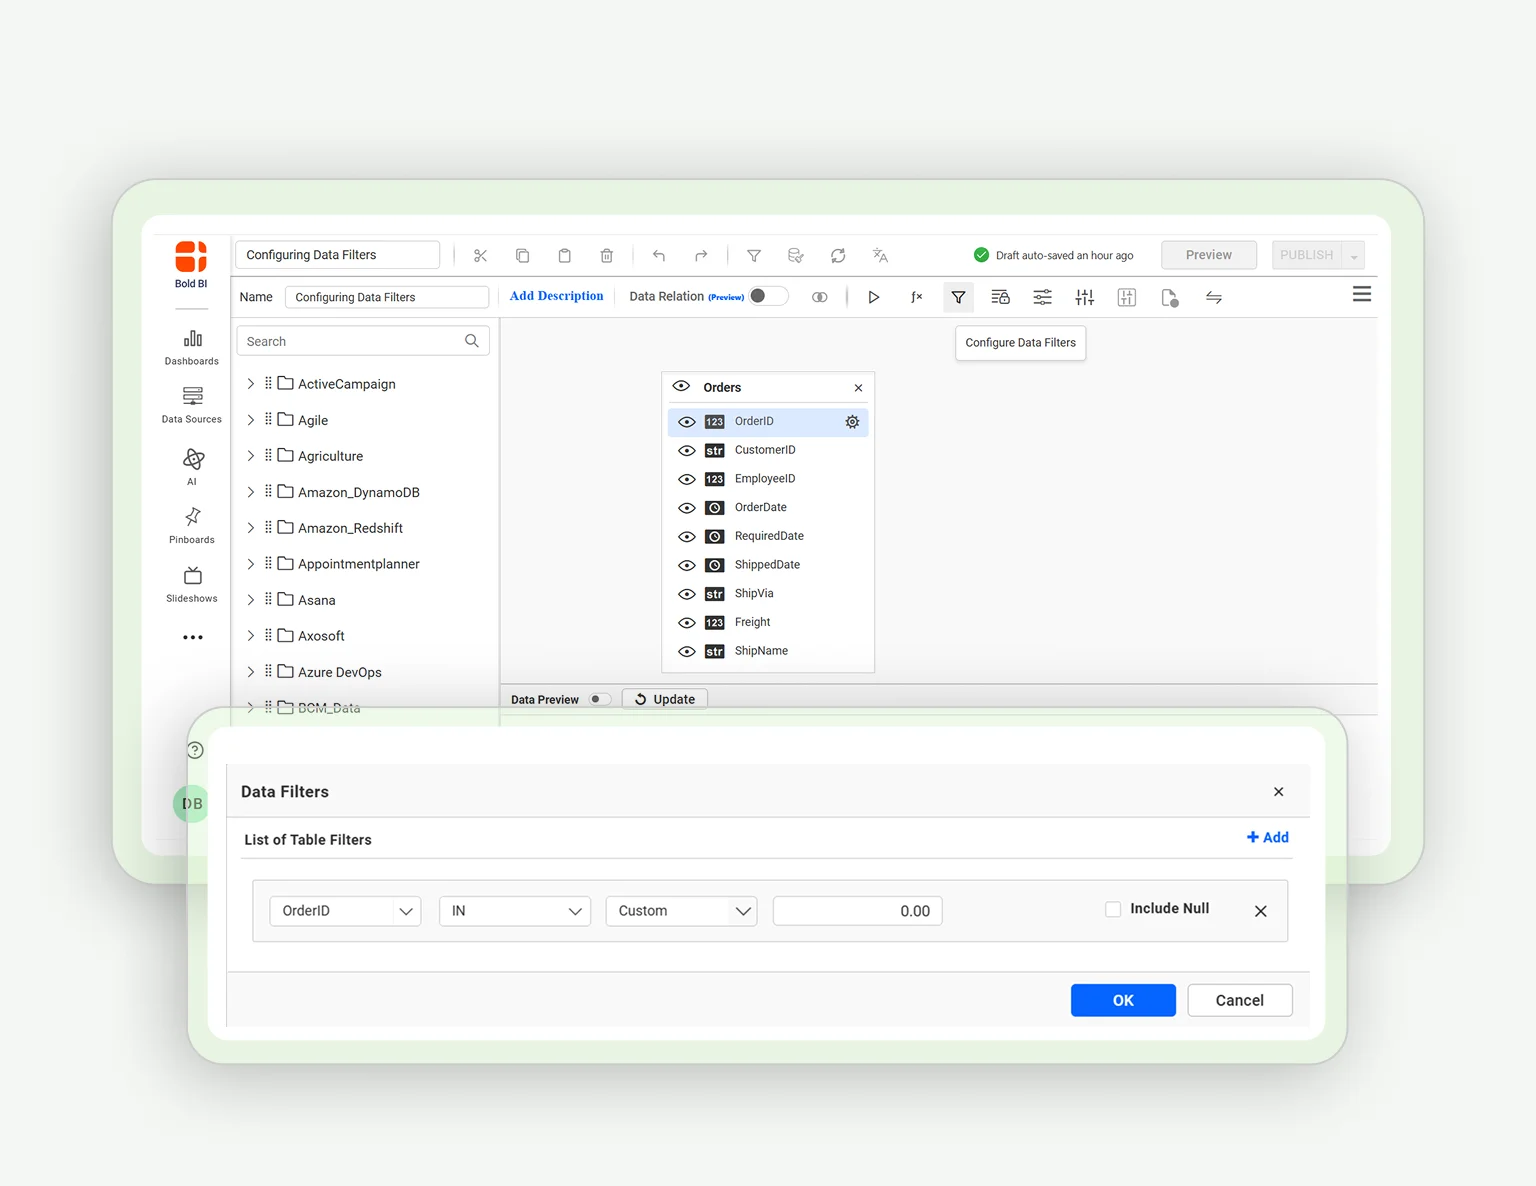
How to Configure Data Filters in Data Sources
02:29
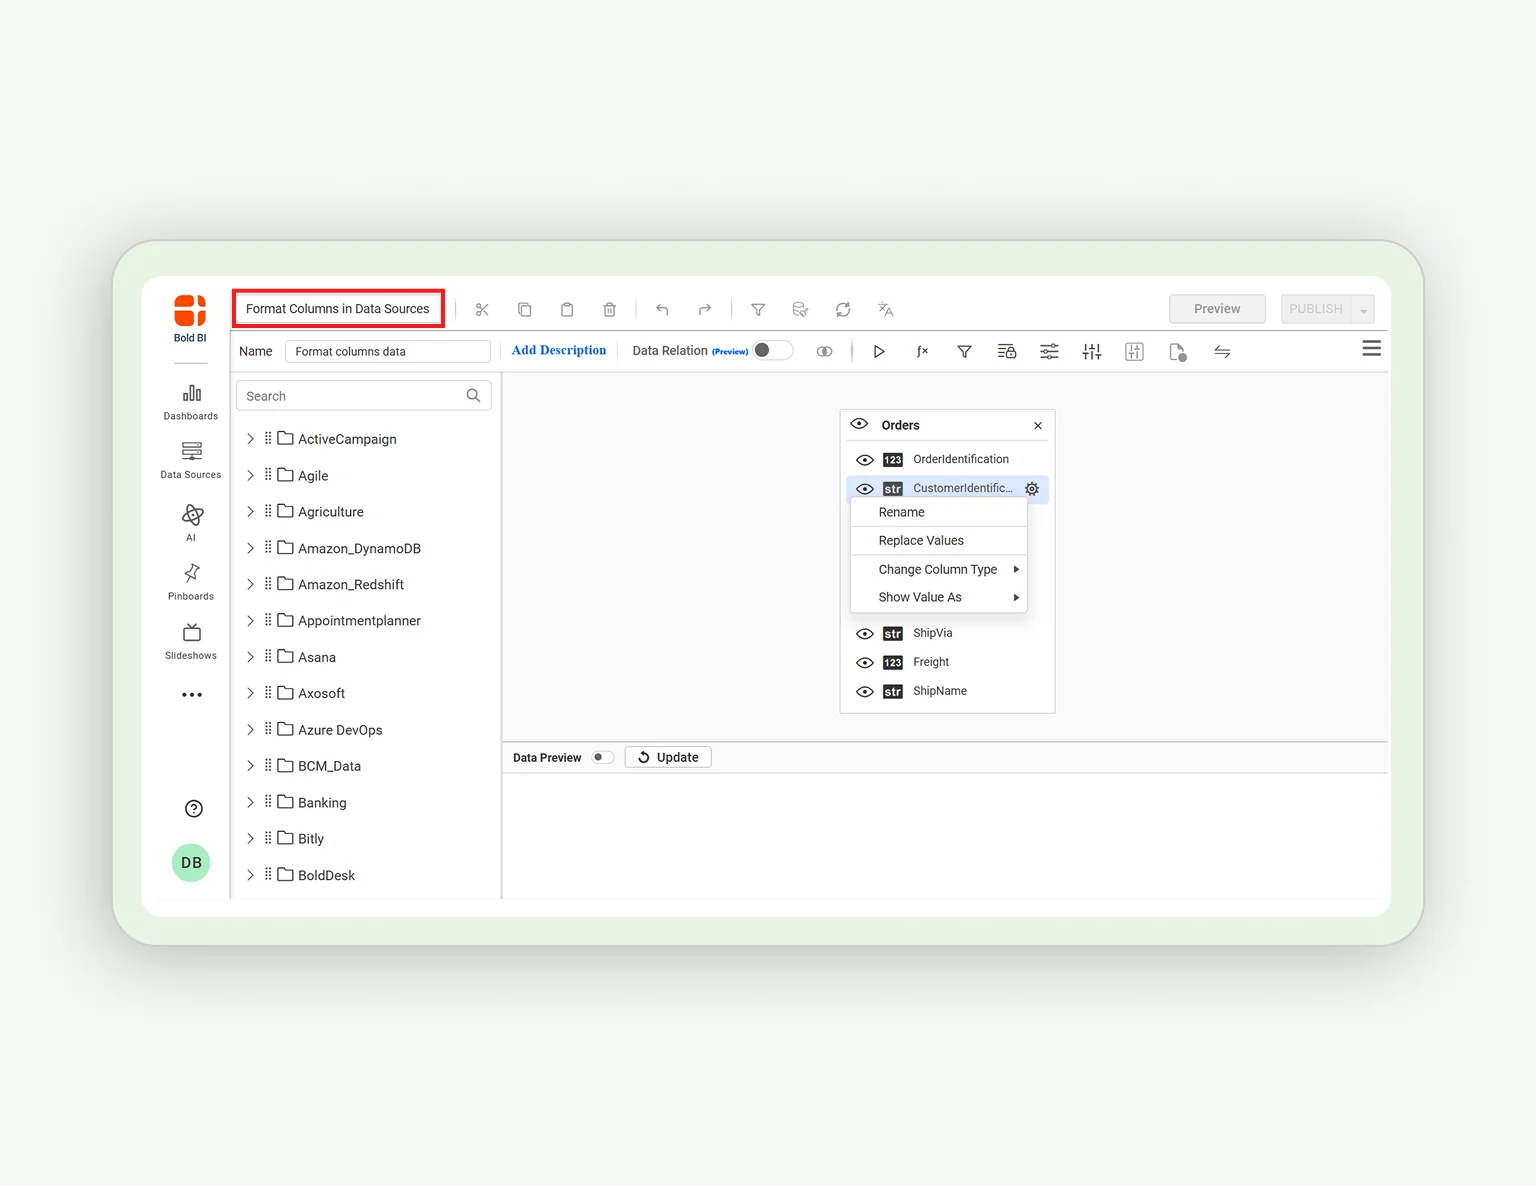
How to Format Columns in Data Sources
03:12
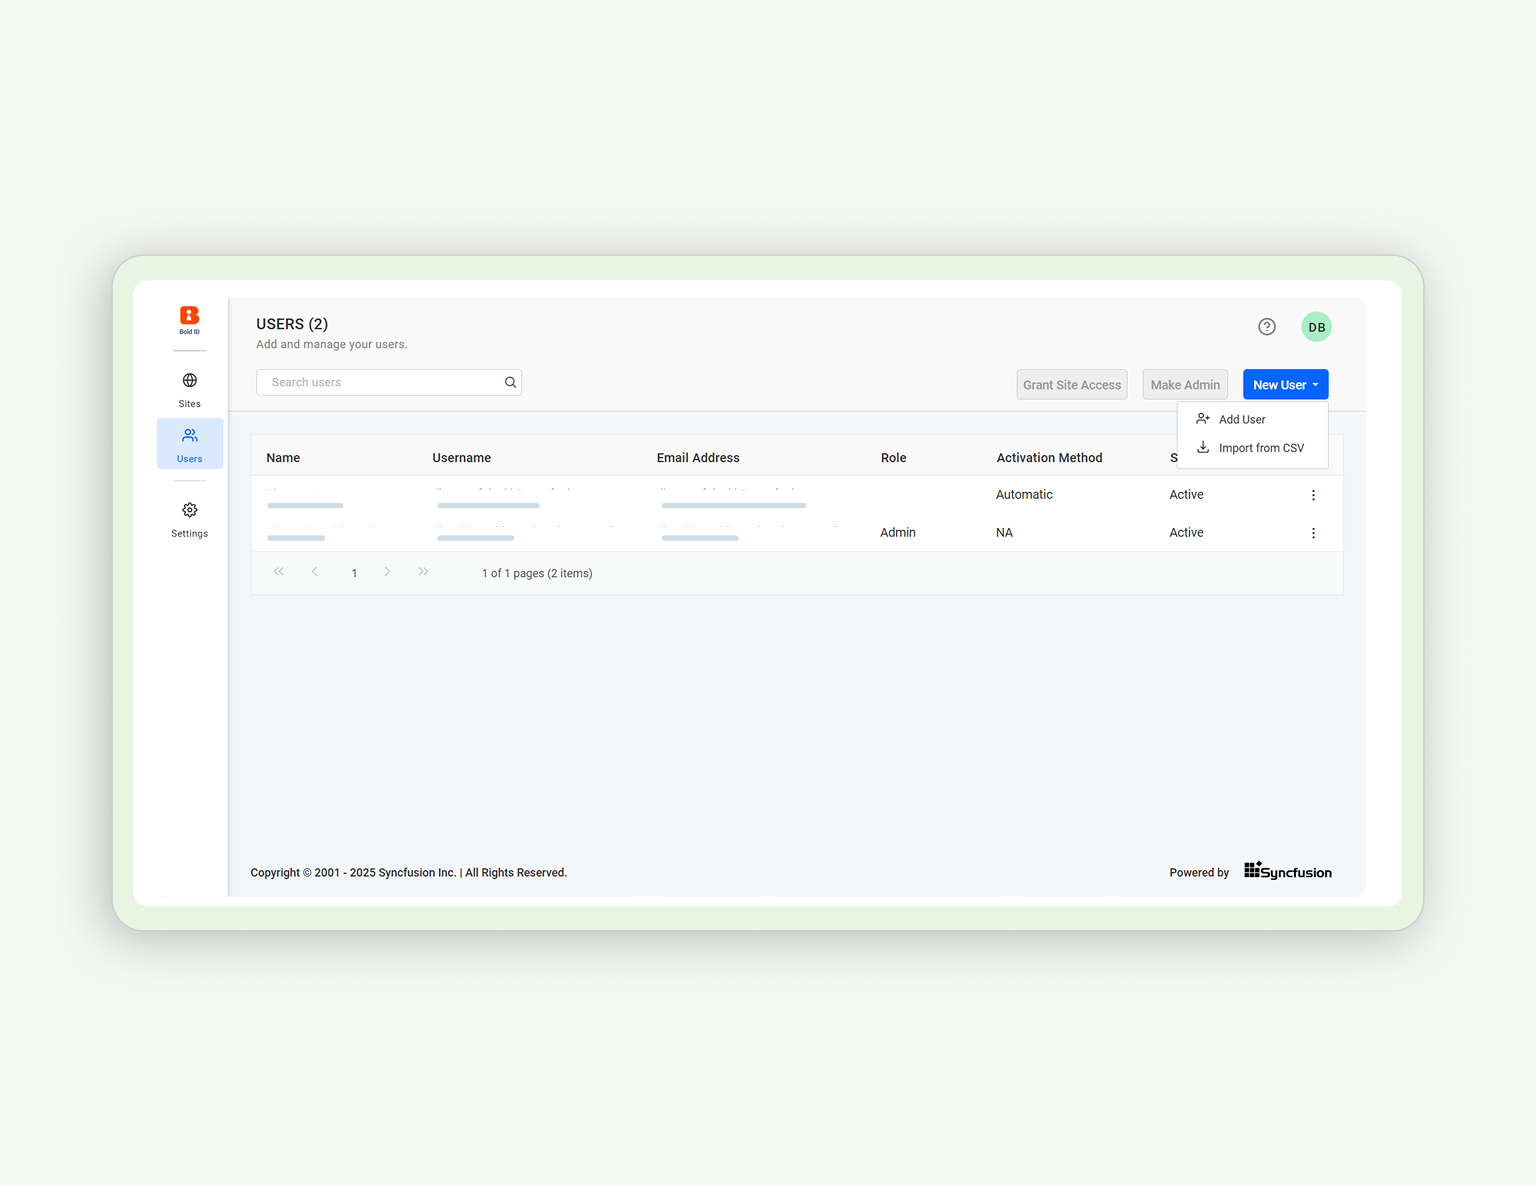
How to Add Users
01:35
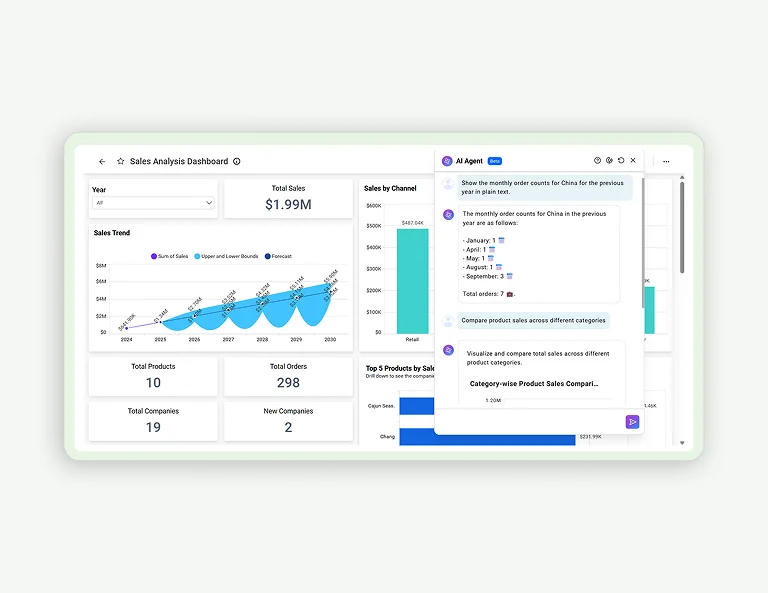
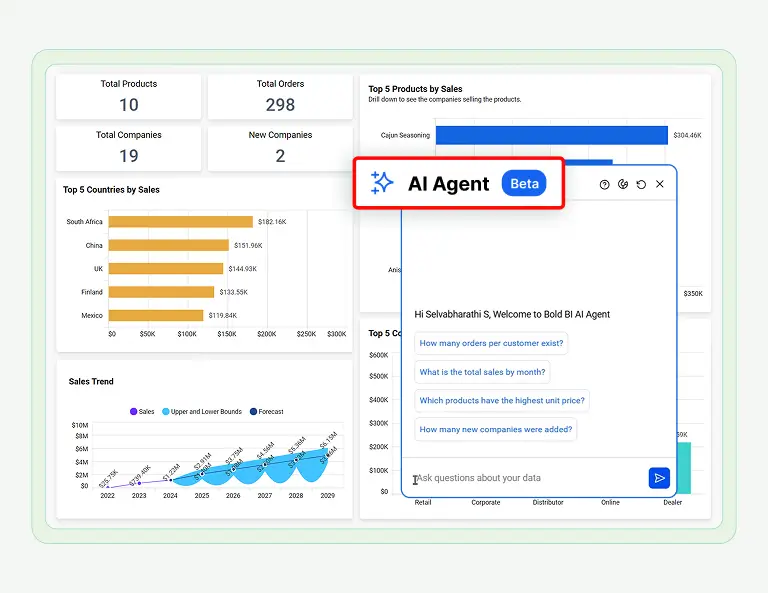
How to Use AI Agent in the Dashboard Viewer
02:46
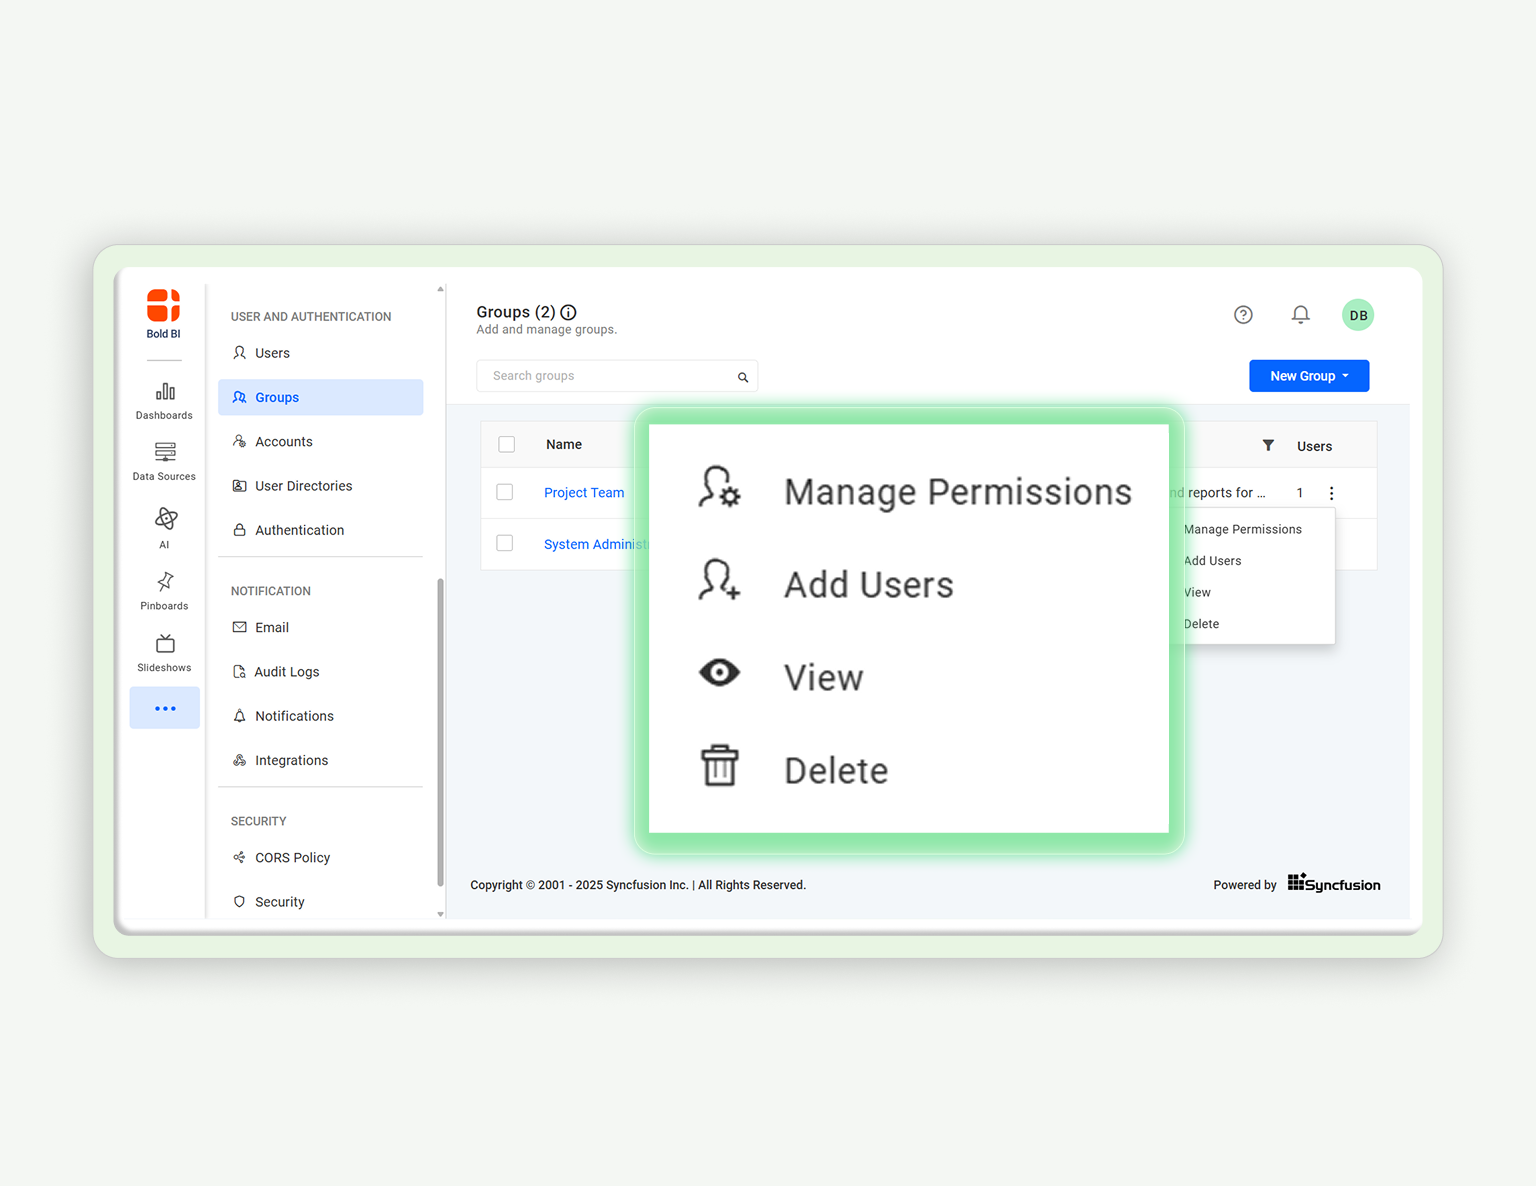
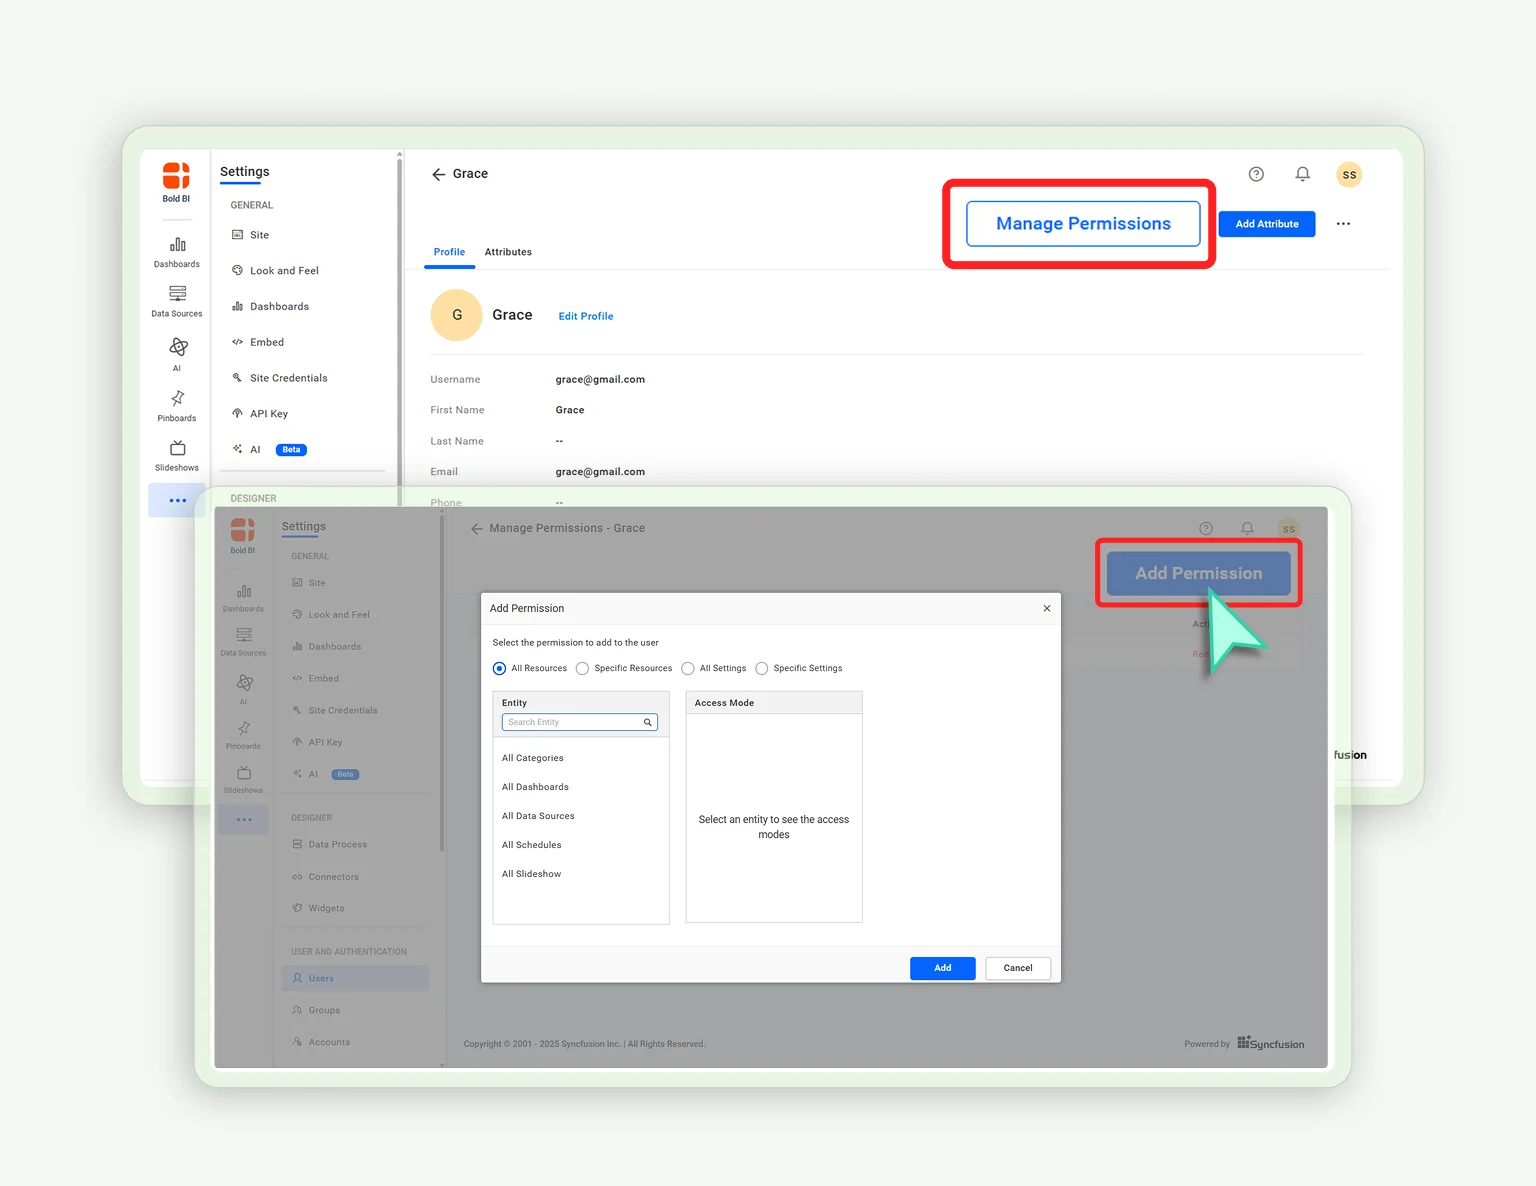
How to Add Groups and Manage Permissions
01:38
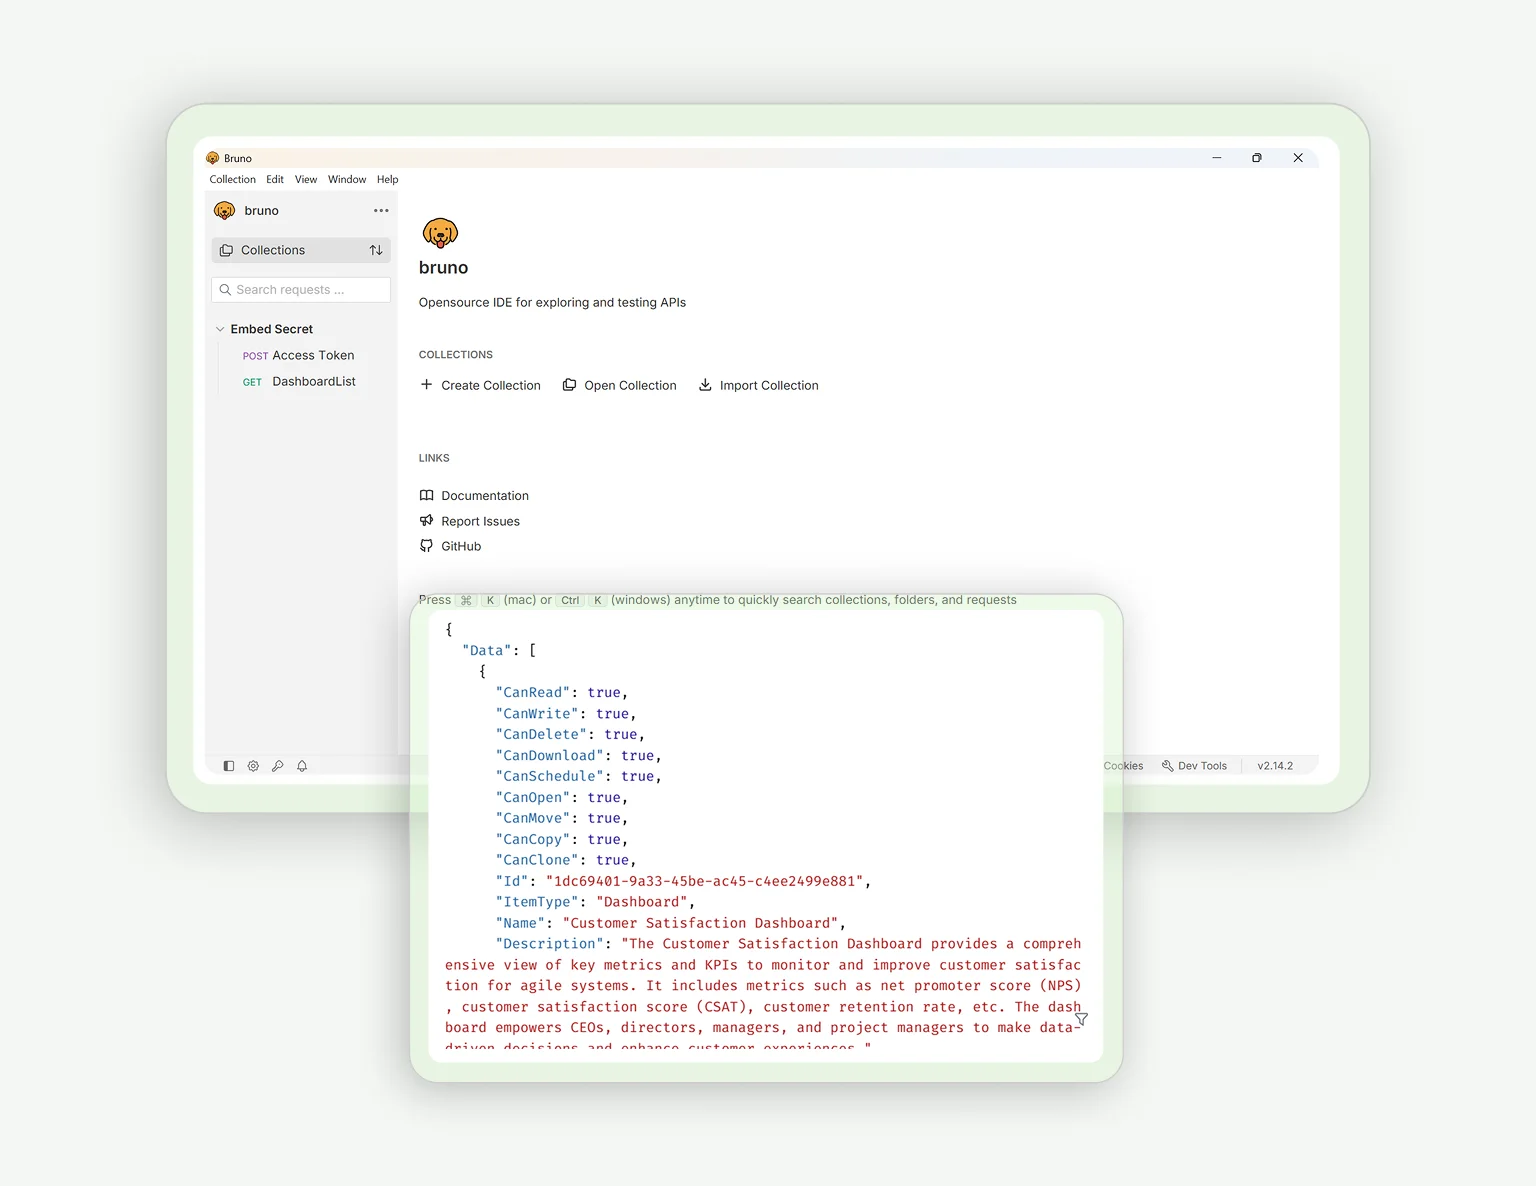
How to Retrieve User-Specific Dashboard Lists via REST API
03:55
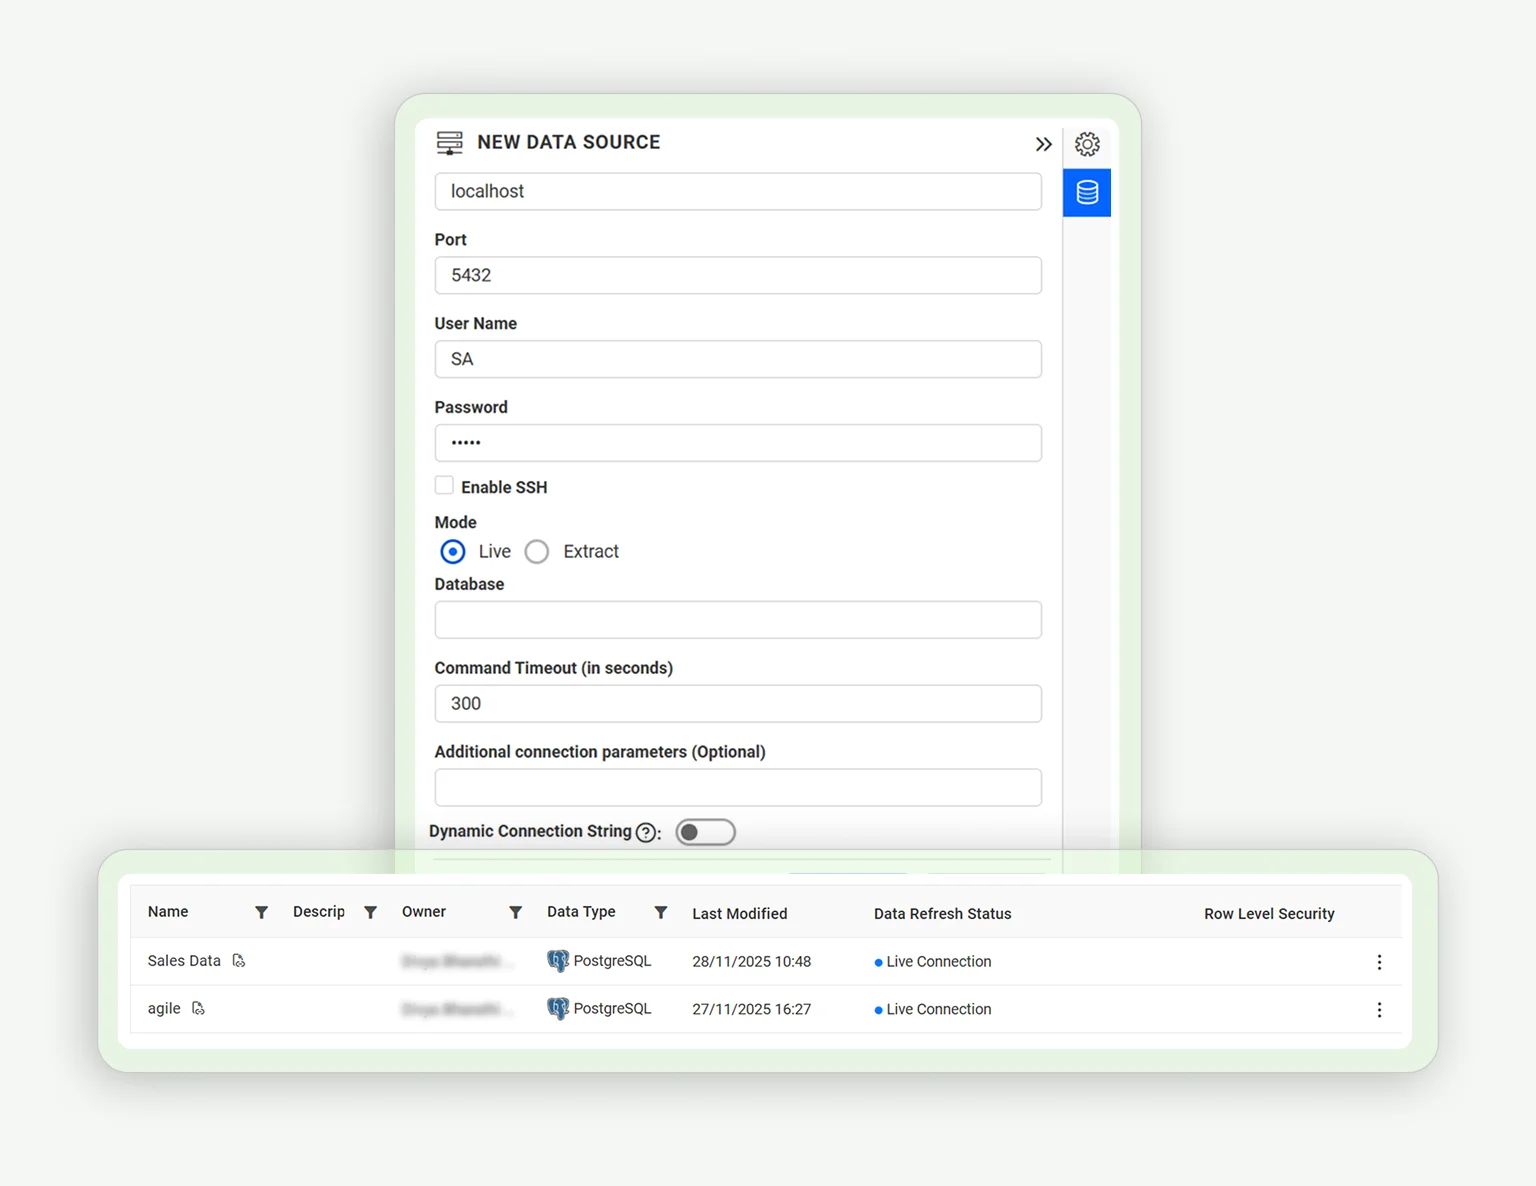
How to Connect to a Data Source in Live Mode
02:07
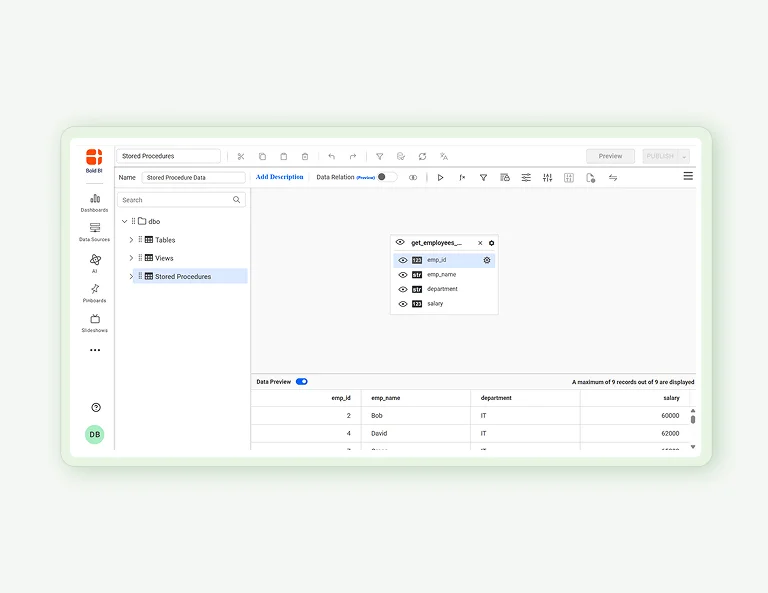
How to Connect to Stored Procedures in a SQL Server Database
02:41
How to Add Data Caching in Dashboards
02:47
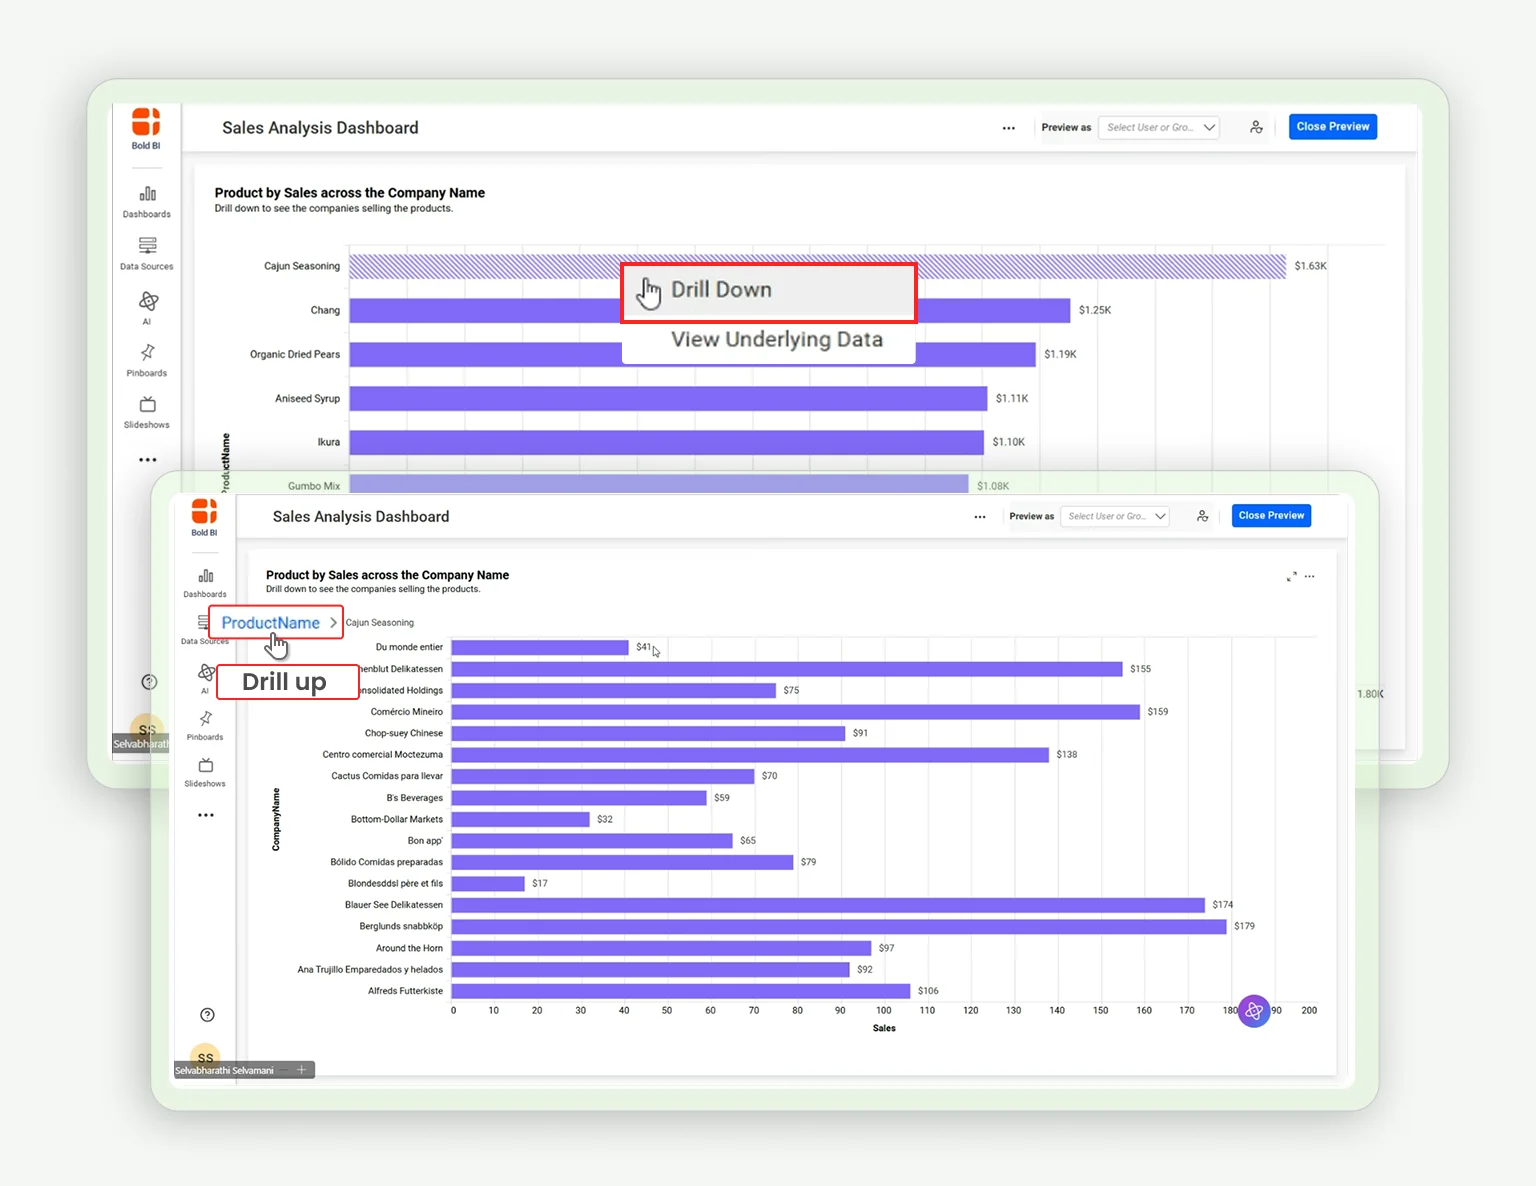
How to Enable Drill Down and Drill Up in Bold BI Widgets
05:07
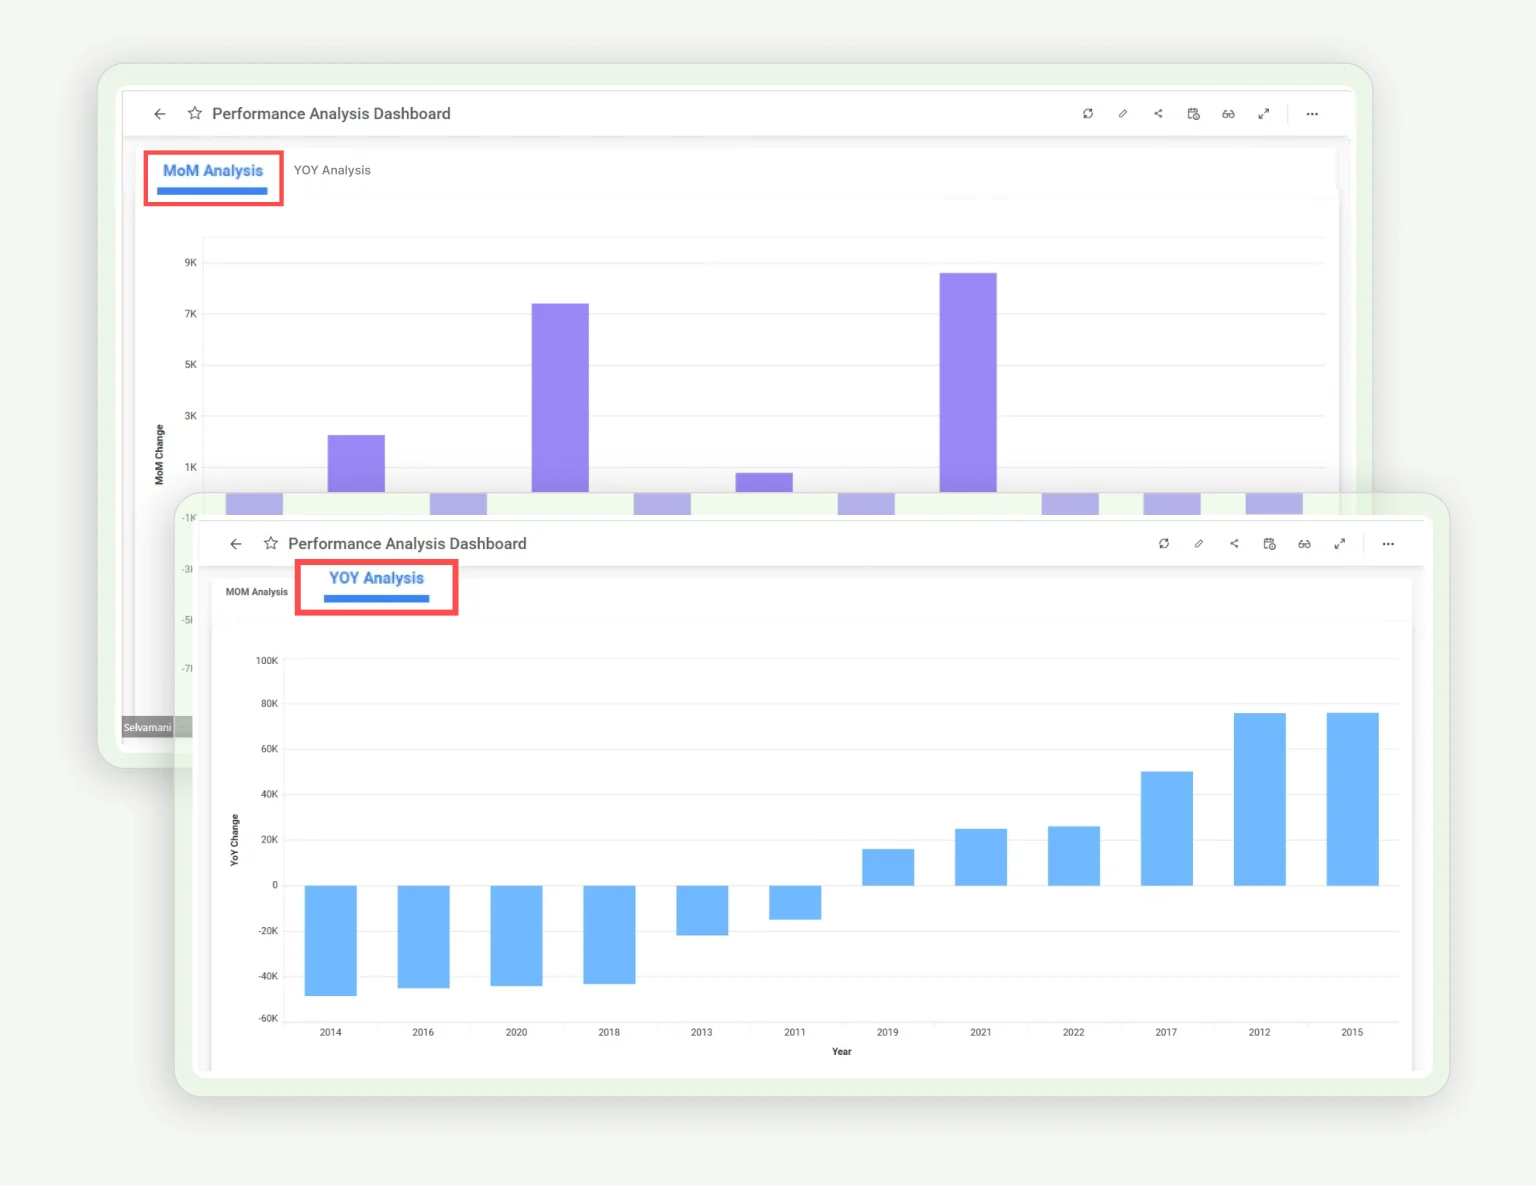
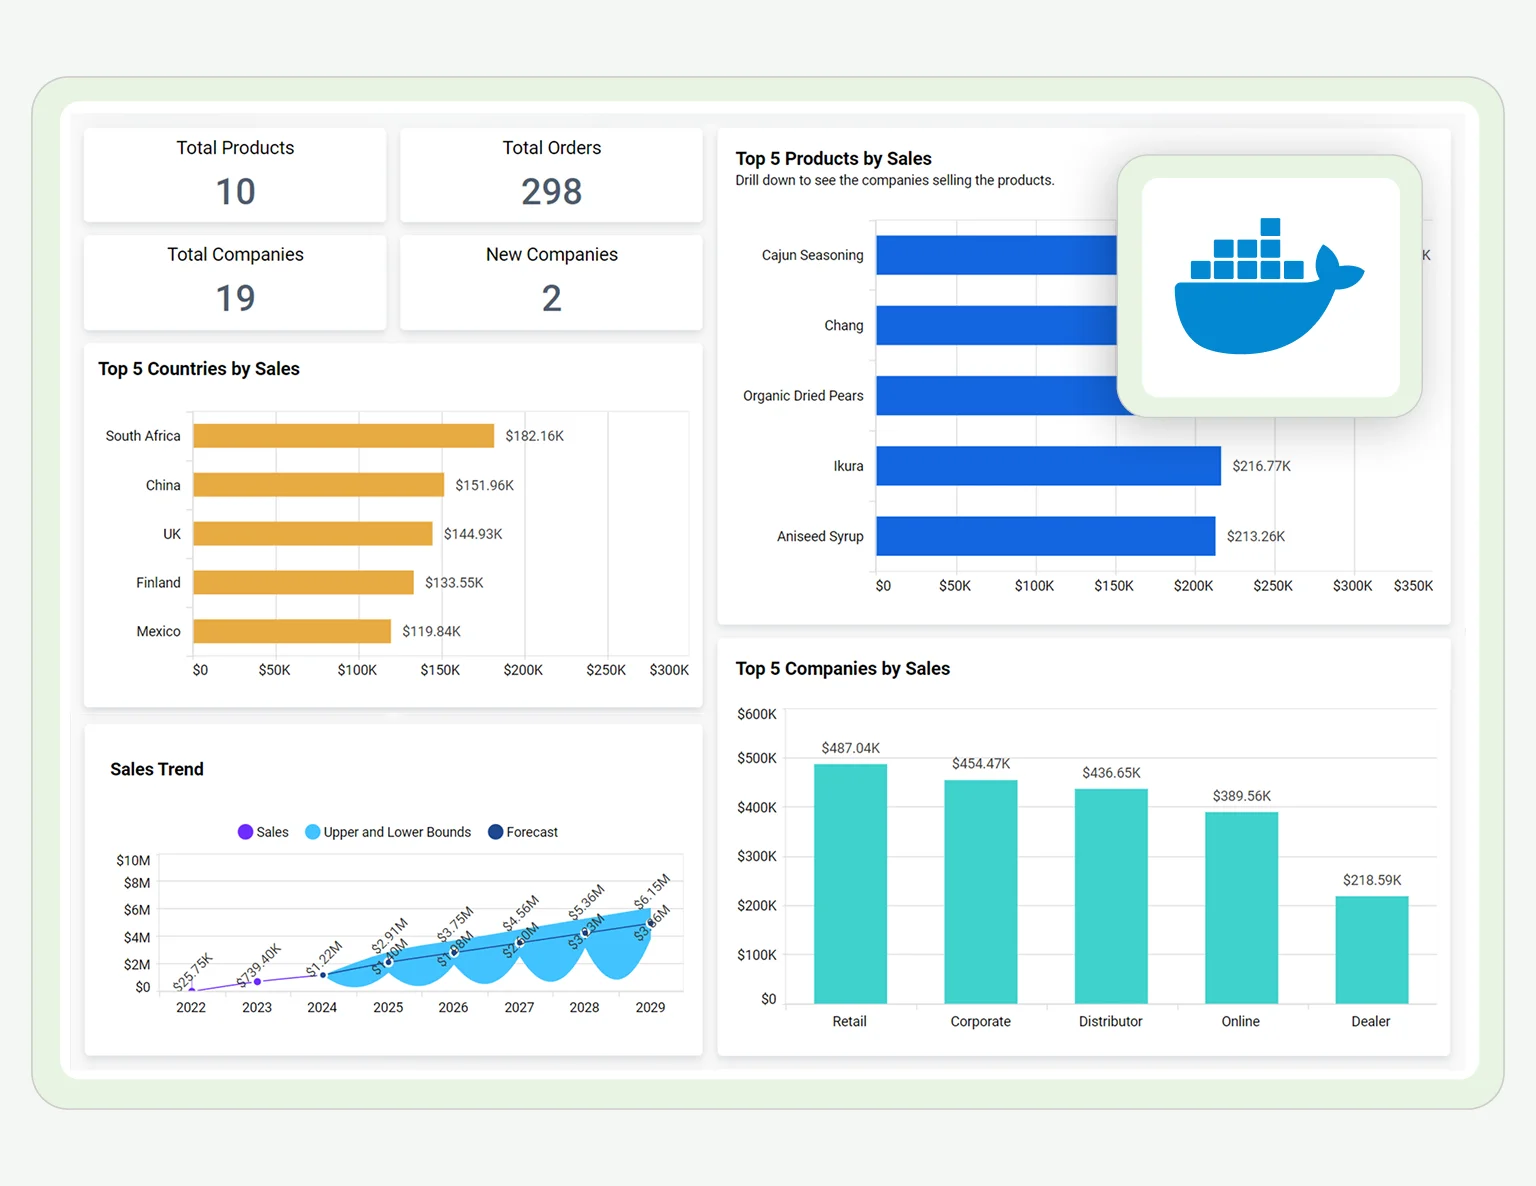
How to Create a Year-Over-Year (YOY) and Month-Over-Month (MOM) Sales Comparison Dashboard
01:53
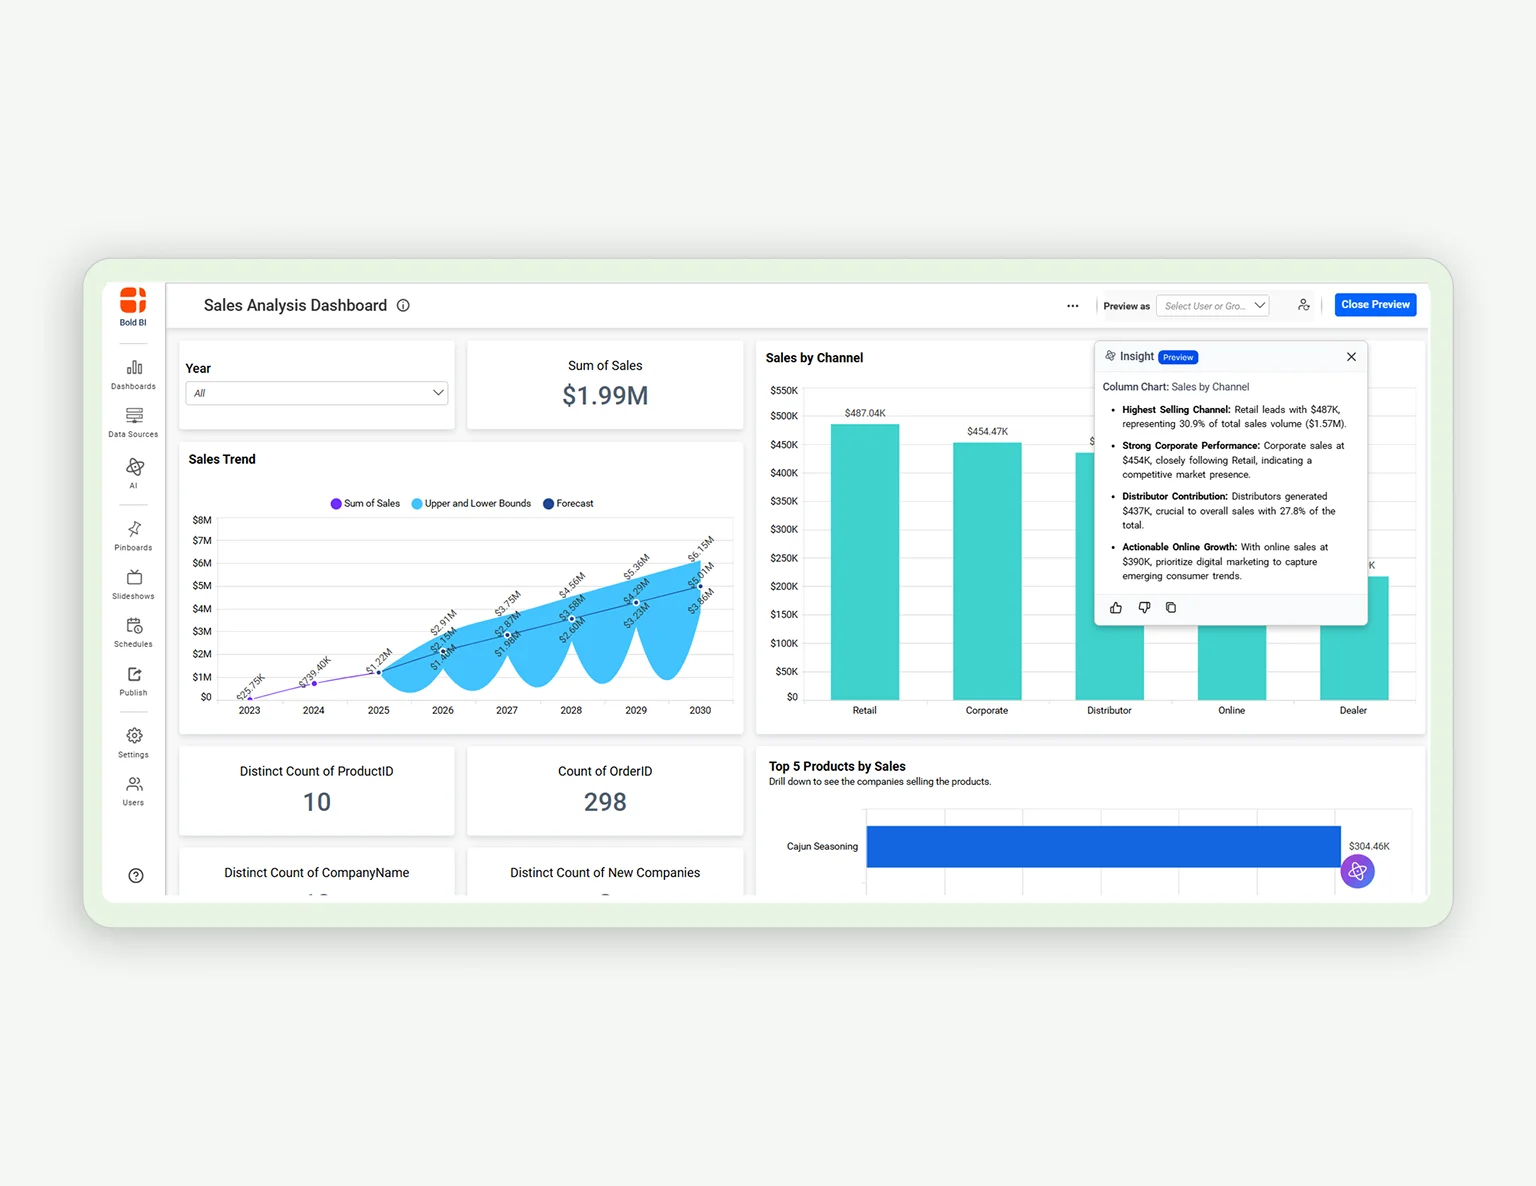
How to Use Widget Insights
04:09
How to Manage Dashboard Permissions at the User Level
03:26
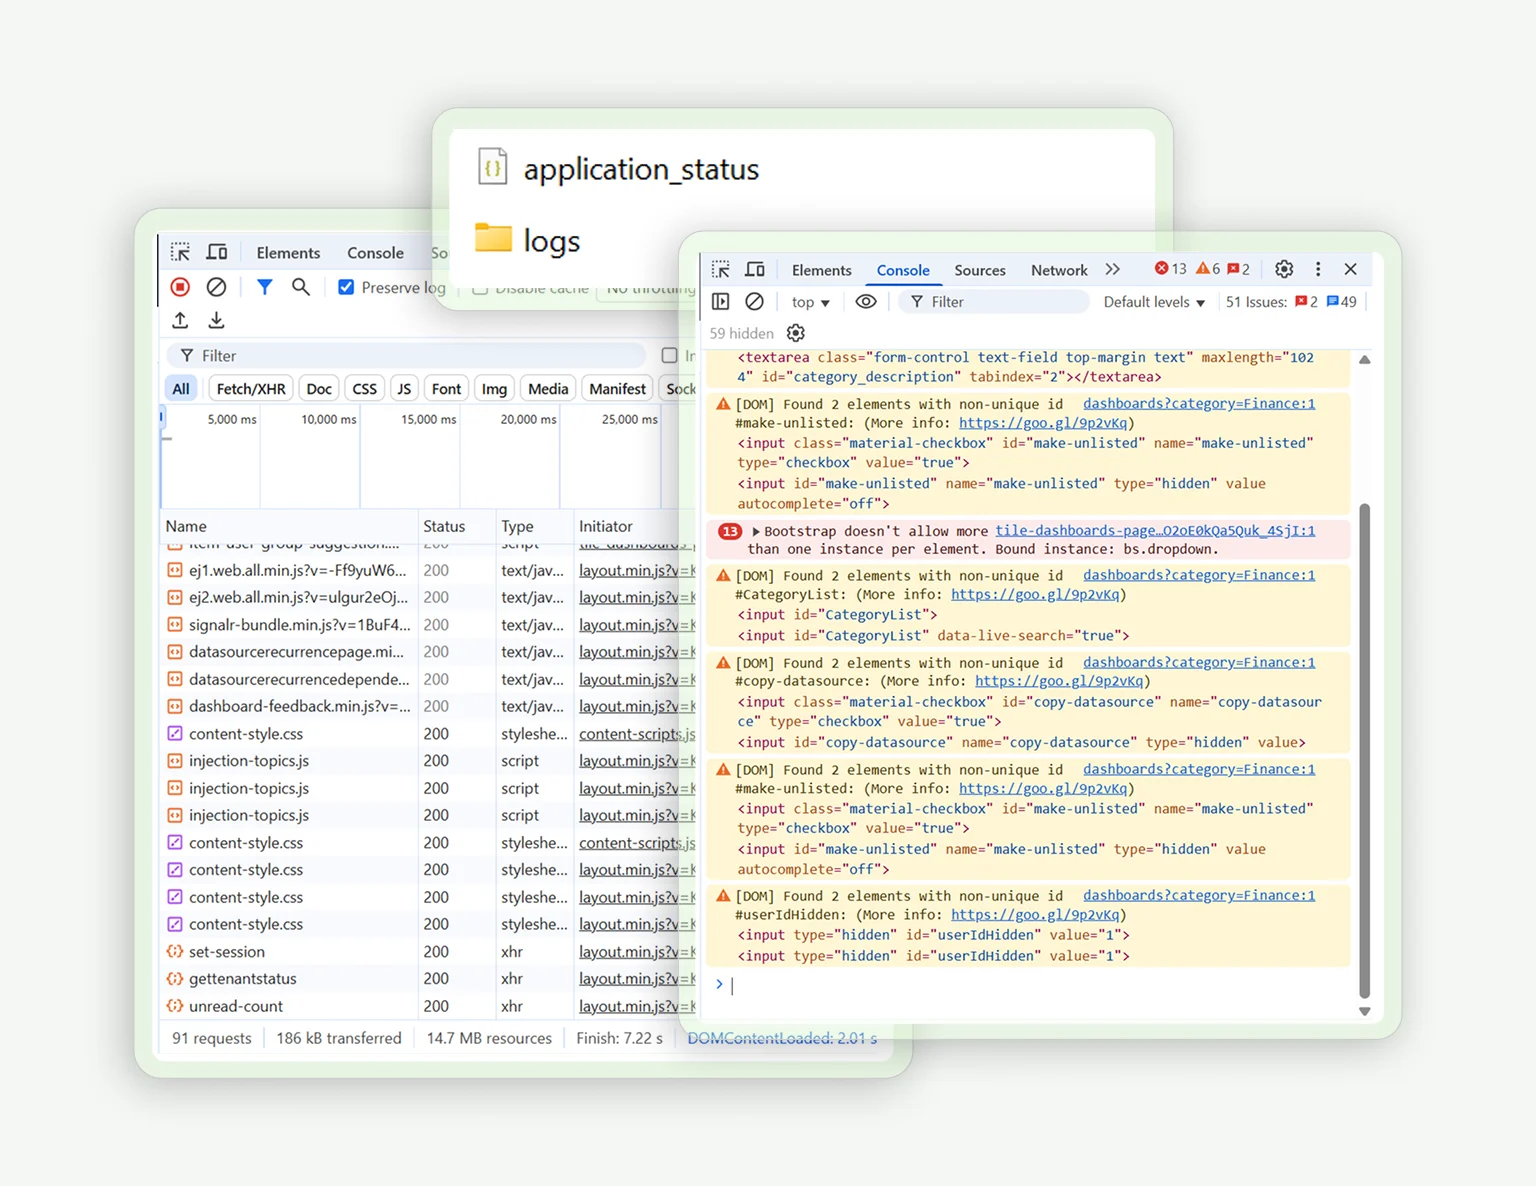
How to Share Error Logs, Console Logs, and a HAR file
04:10
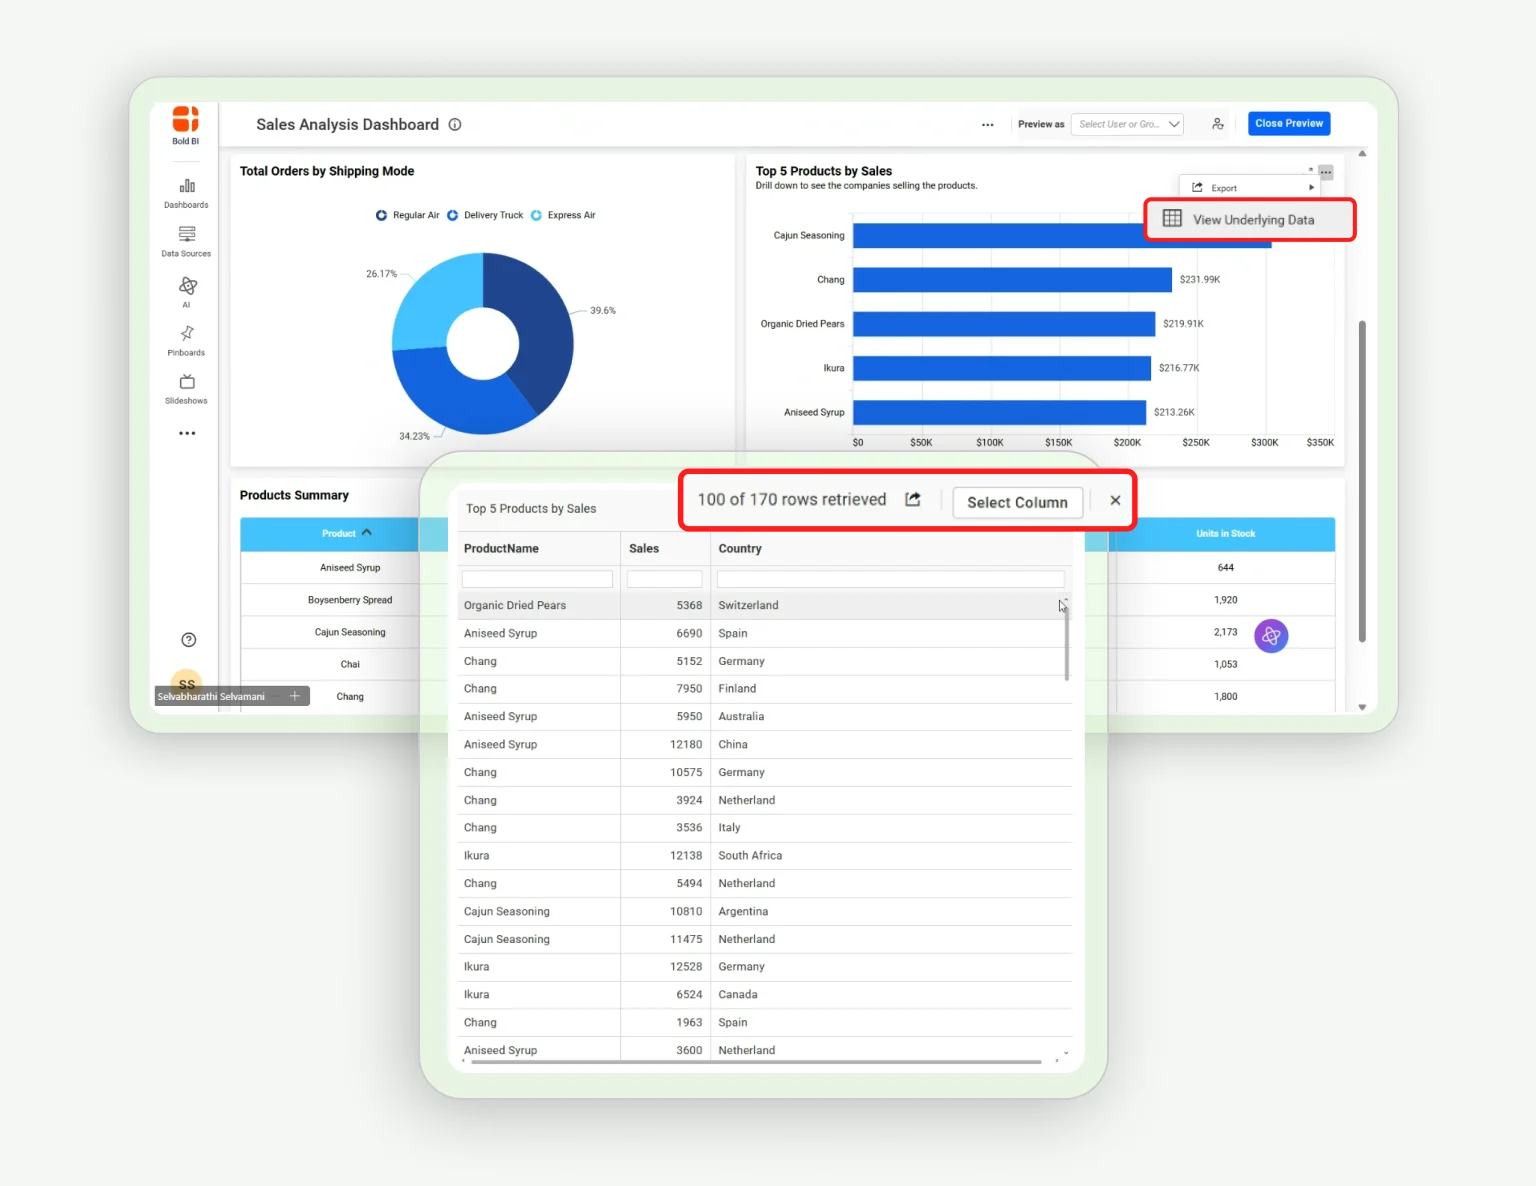
How to View the Widget Data in a Dashboard
01:54
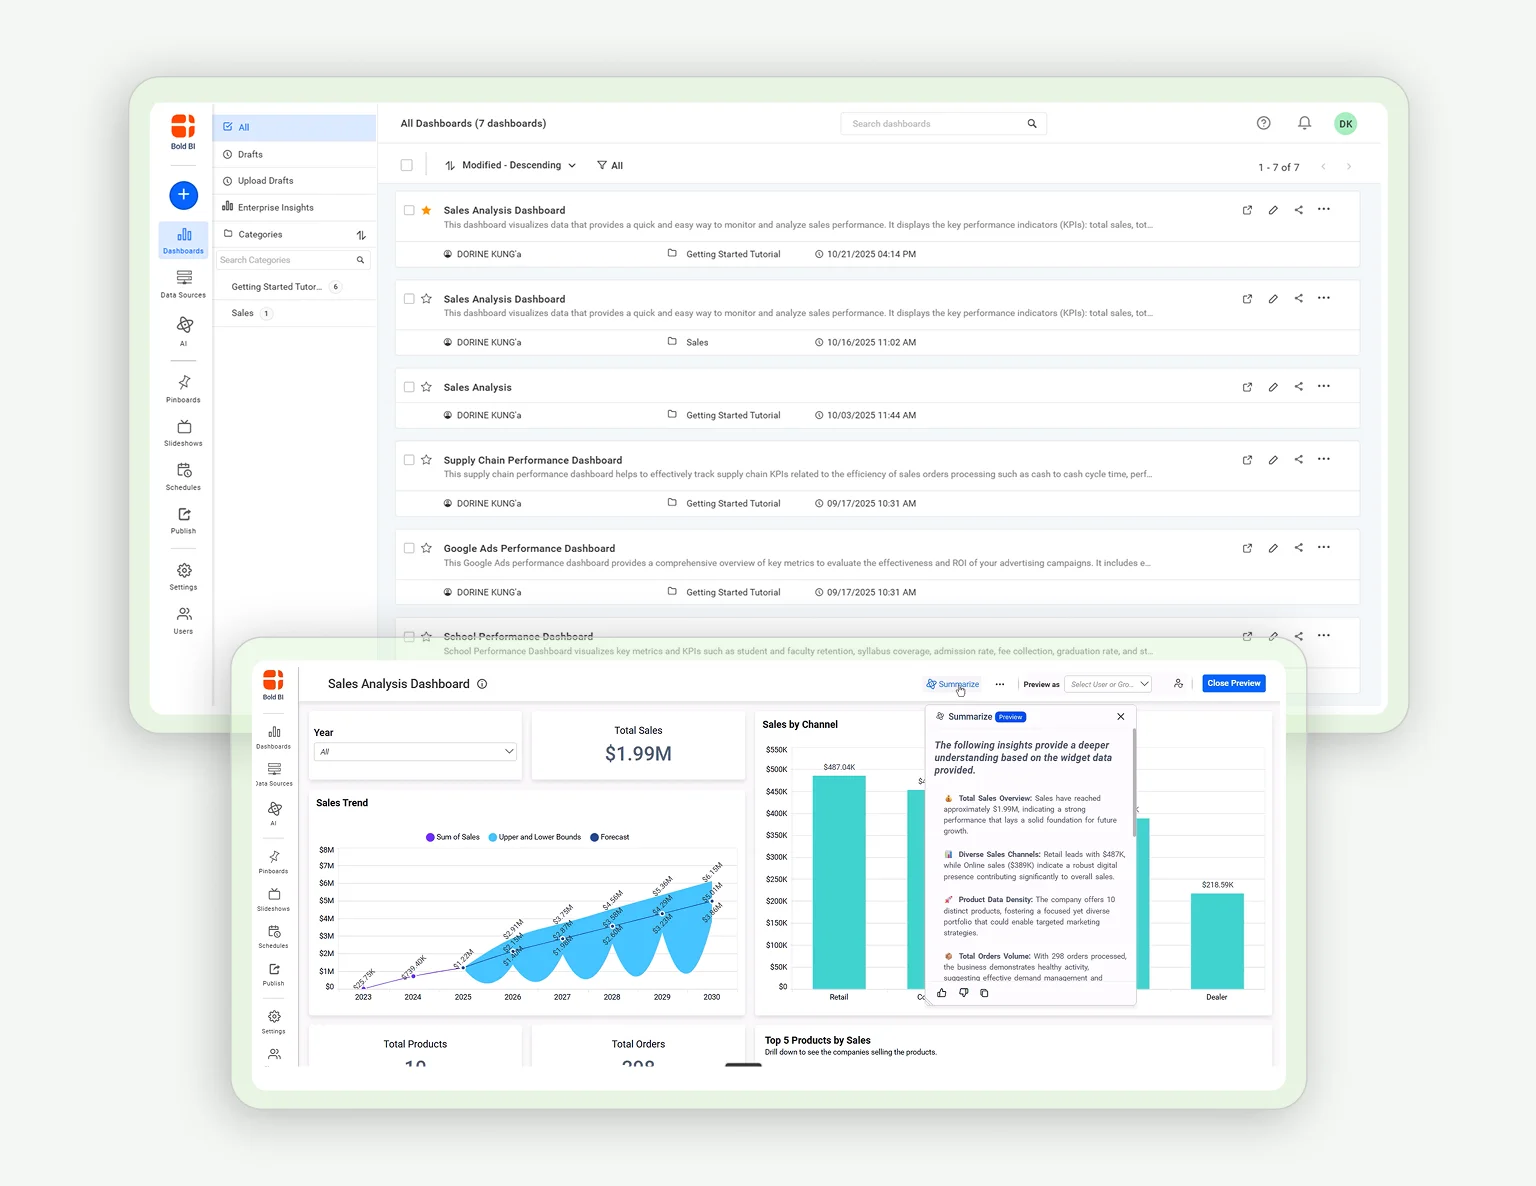
How to Use the Dashboard Summary
02:10
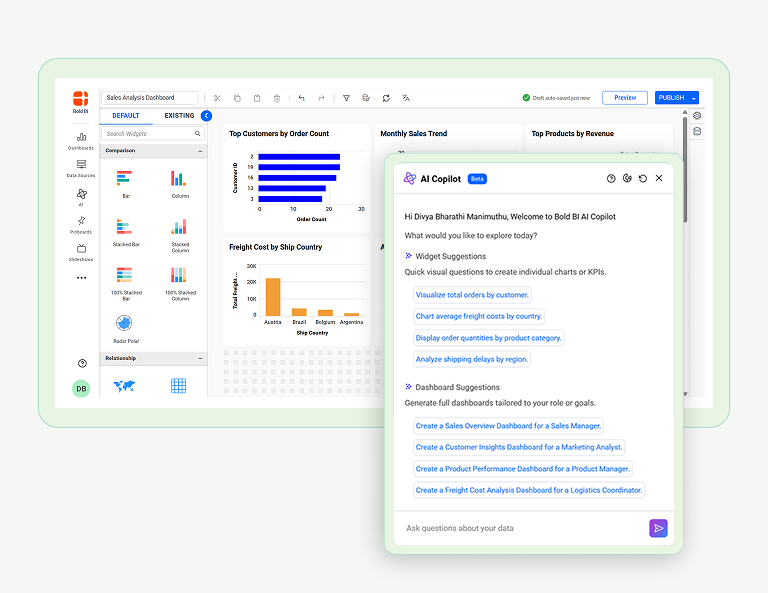
How to Use the AI Copilot in Dashboard Designer
03:17
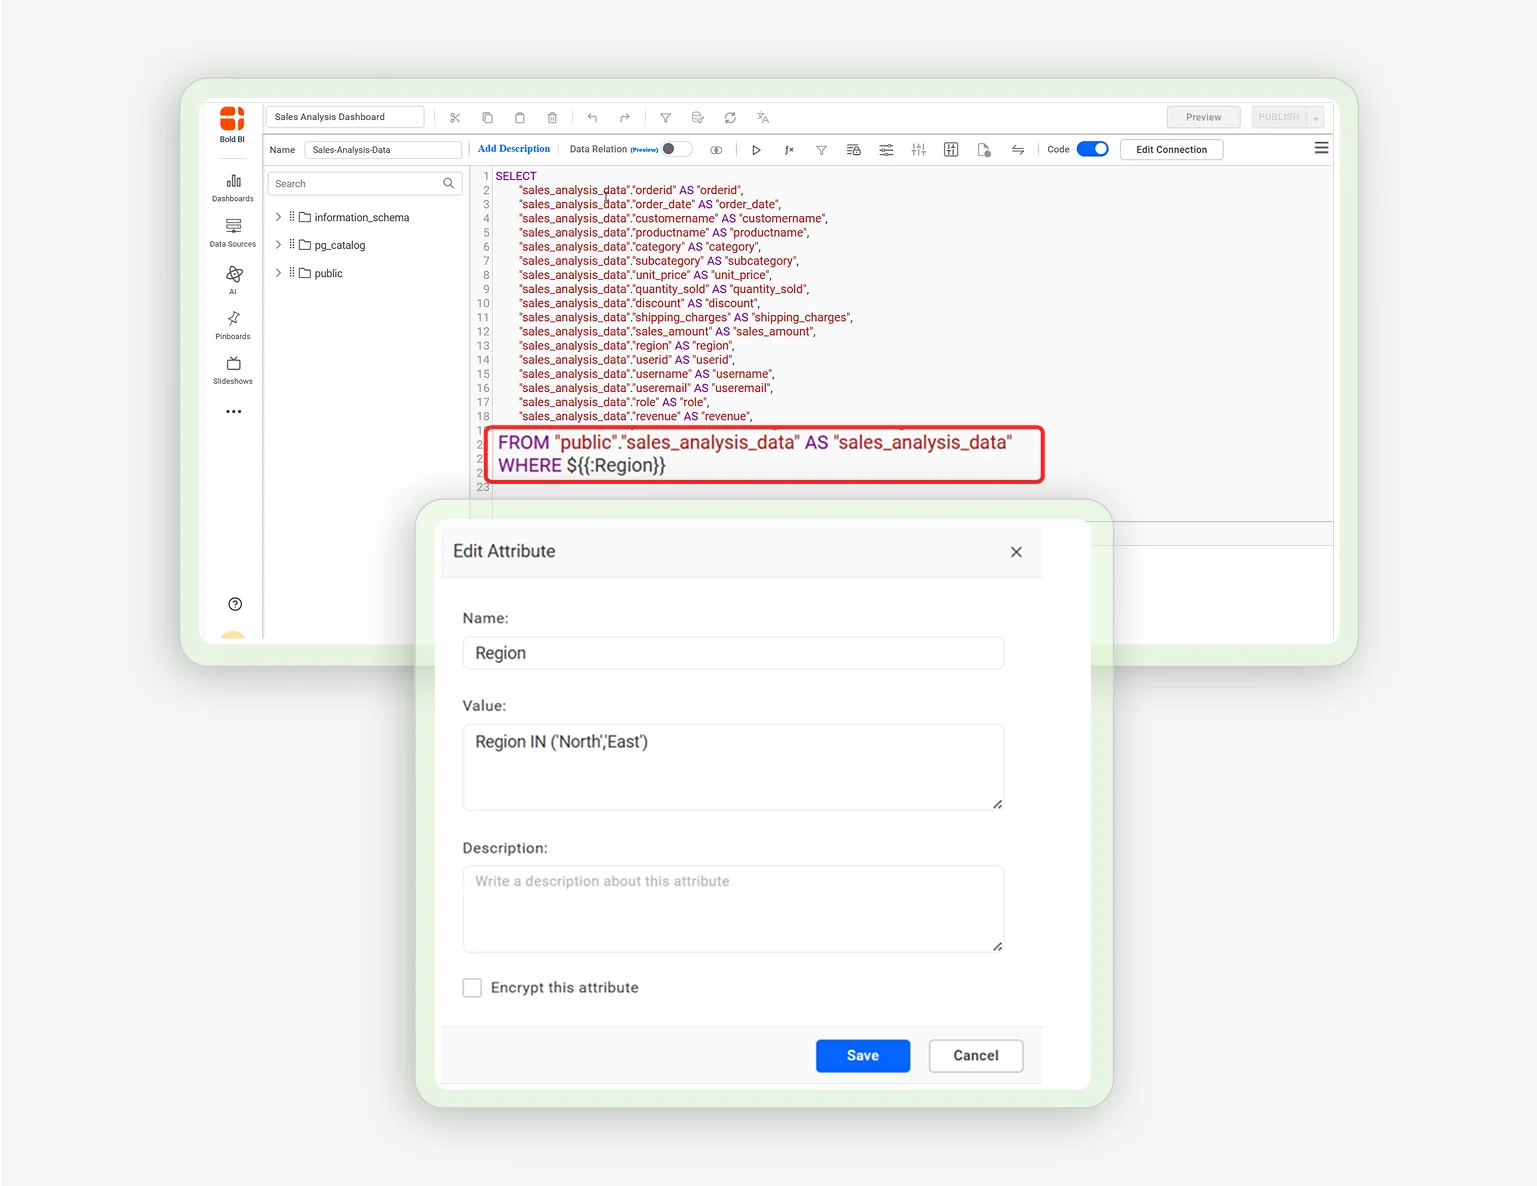
How to Filter Data from Data Sources Using Custom Attributes
02:52
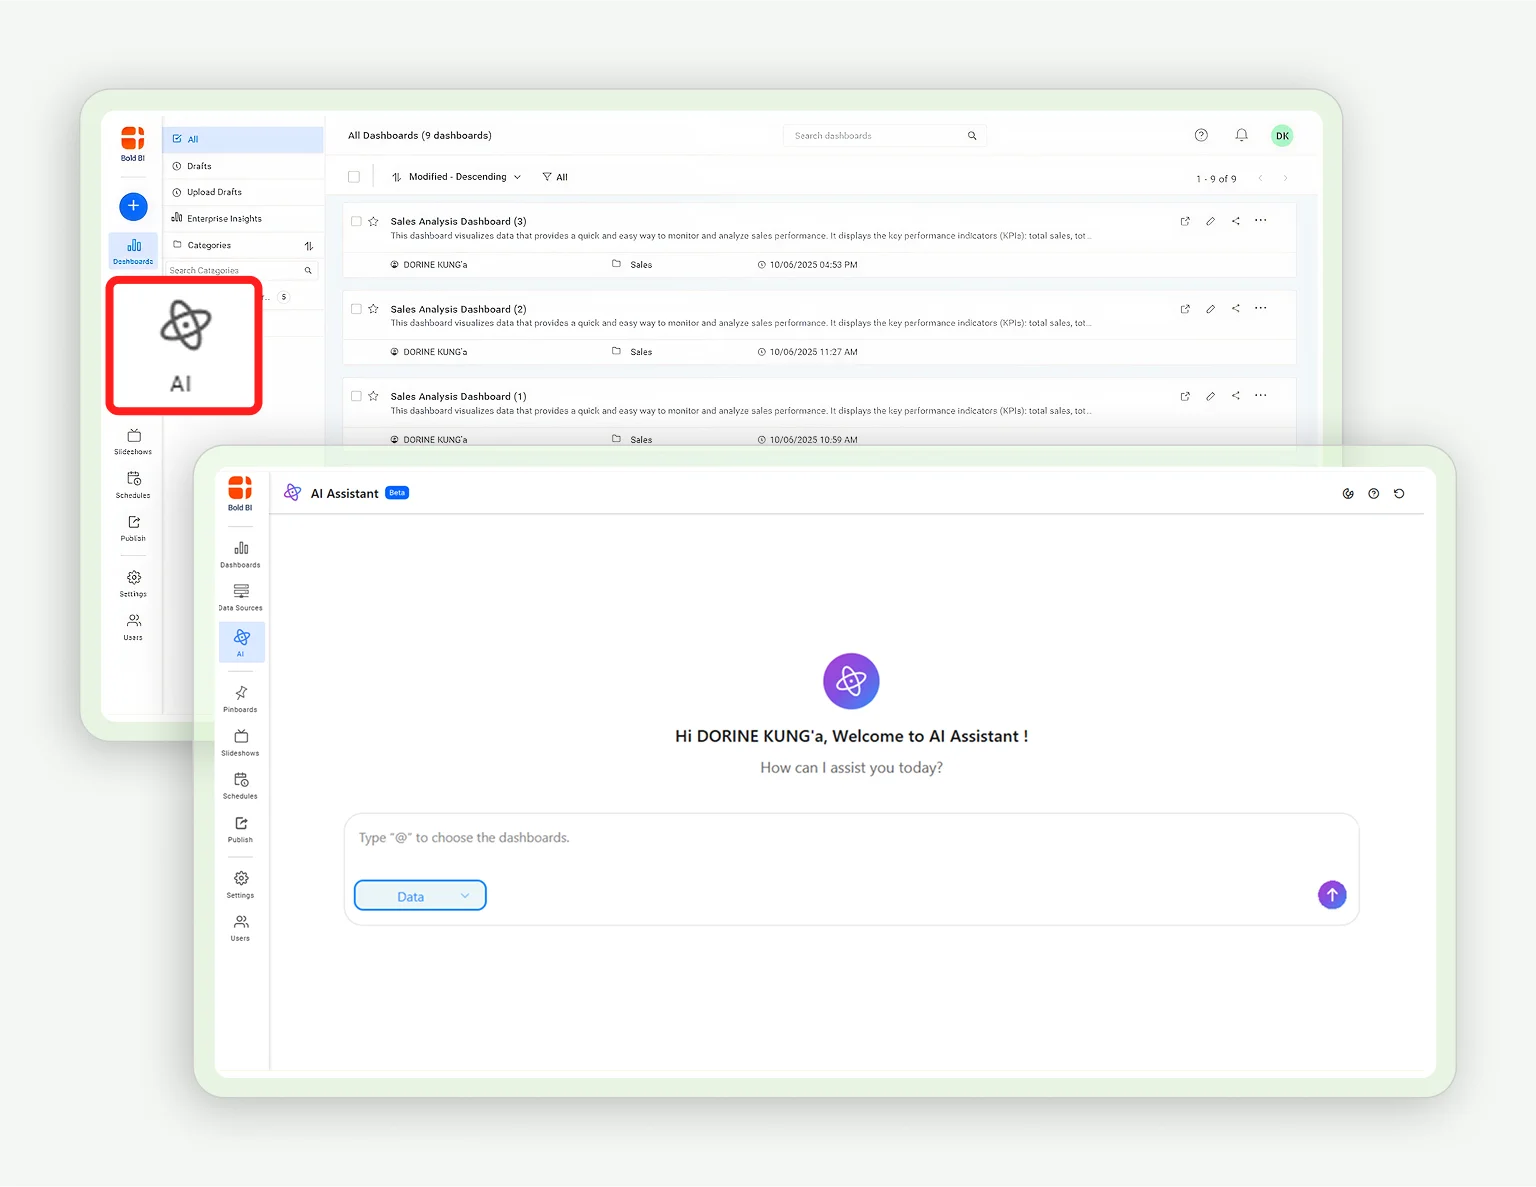
How to Use the Unified AI Agent
03:06
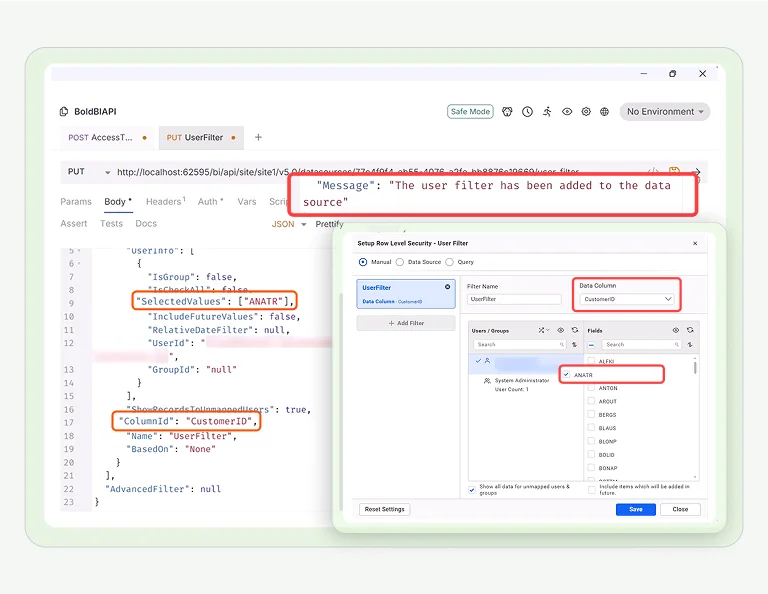
How to Create User-Based Filters via REST API
03:39
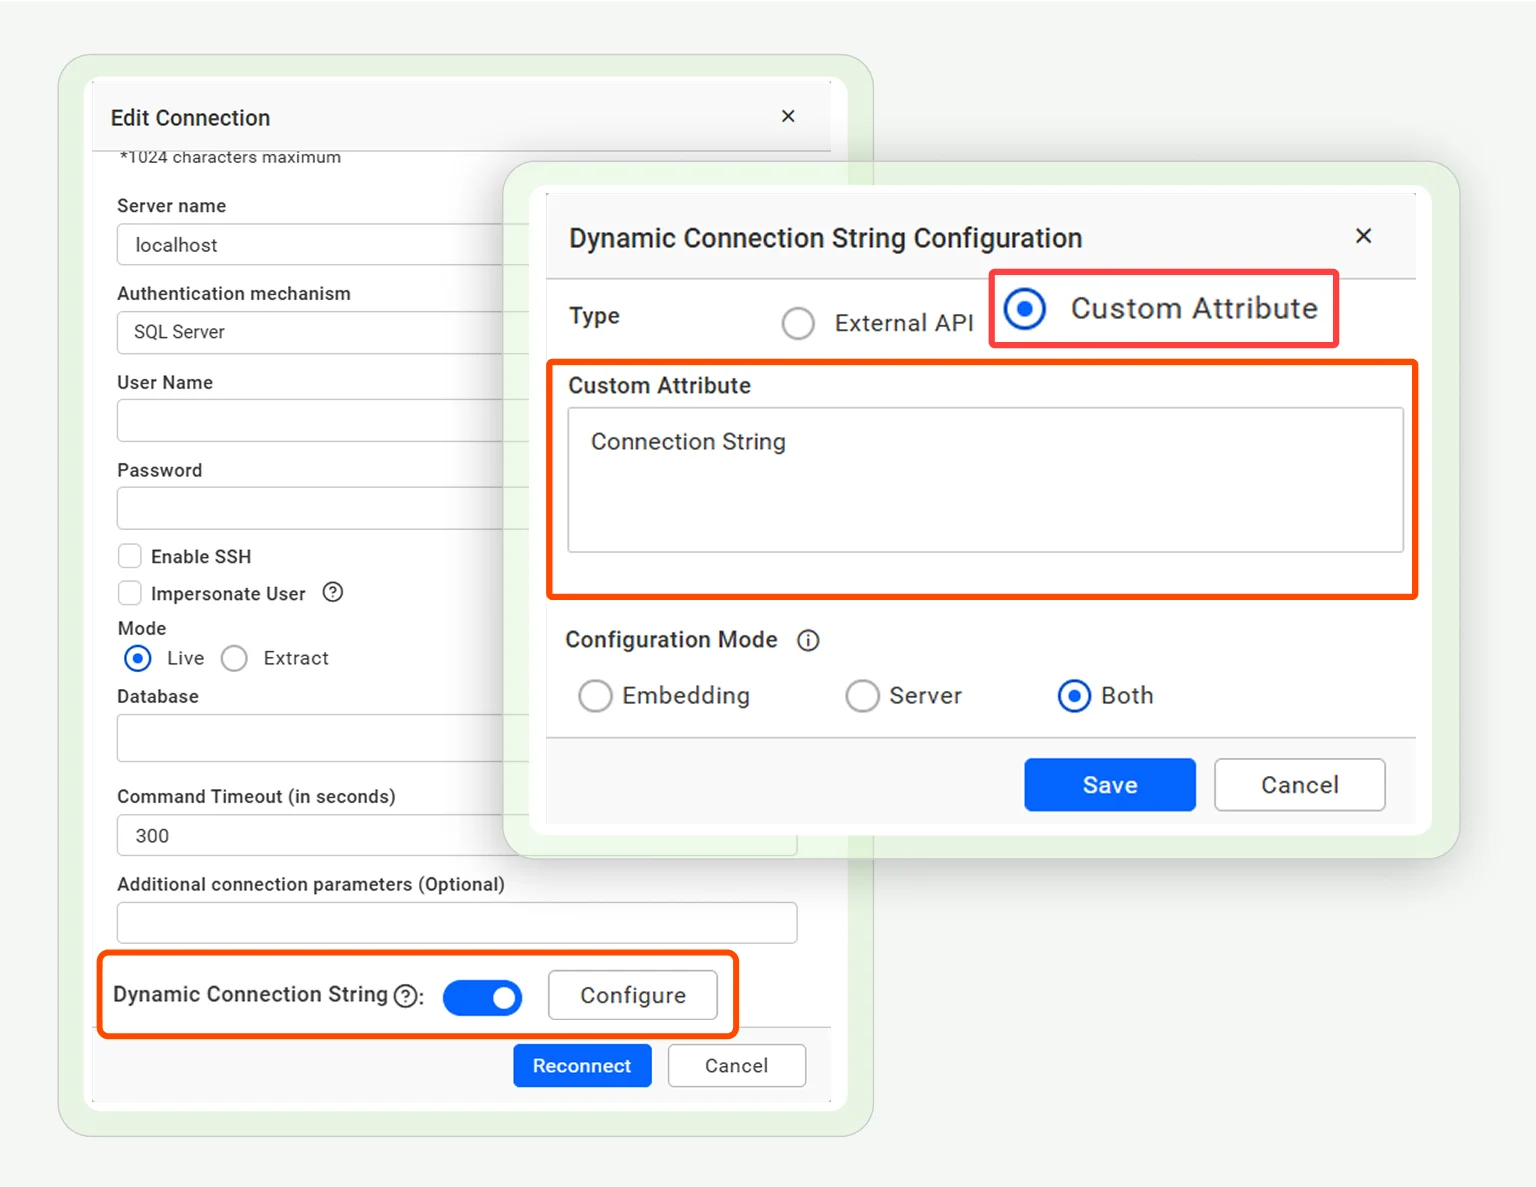
How to Configure Dynamic Connection String Using Custom Attributes in Dashboard
02:17
How to Deploy the Dashboard Server Using Docker

01:38
How to Set Up OAuth 2.0 Authorization for Google Apps Integration
02:51
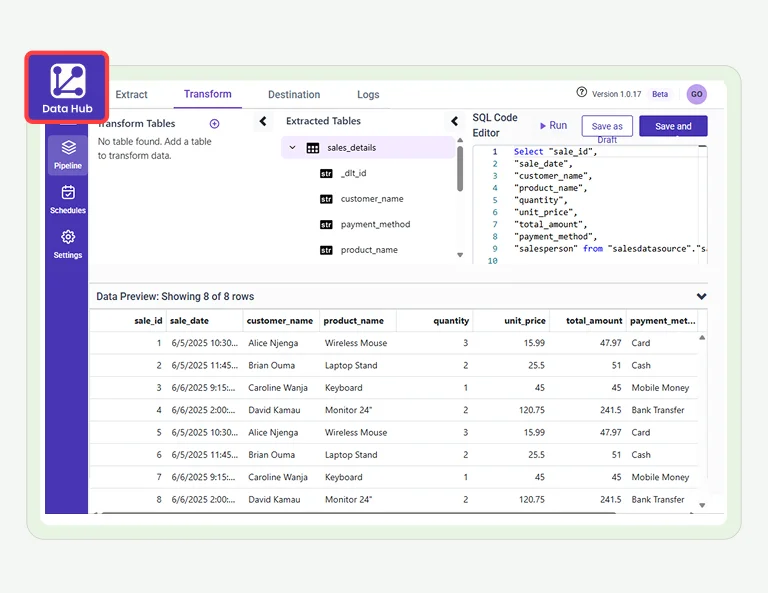
How to Create a Data Source Using Bold Data Hub
02:37
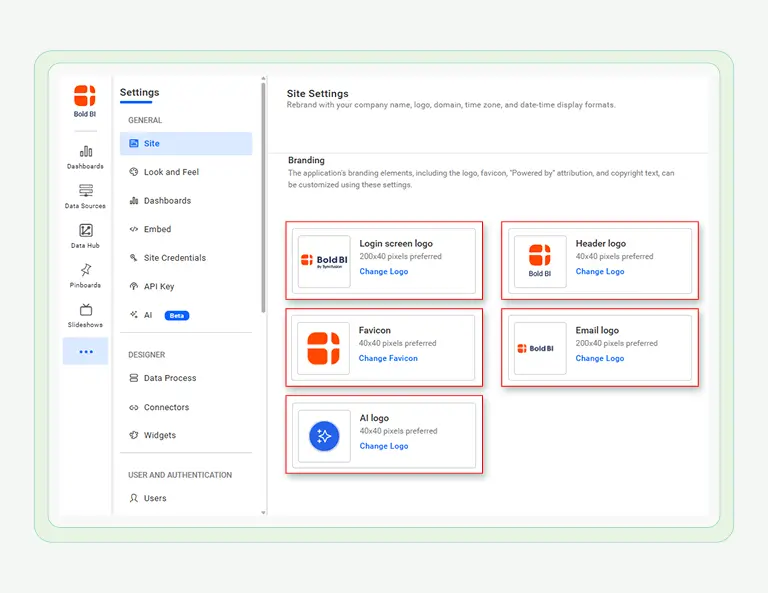
How to White Label Dashboard Server to Match Your Brand

02:30
How to Encrypt and Decrypt Data in SQL Server
02:33
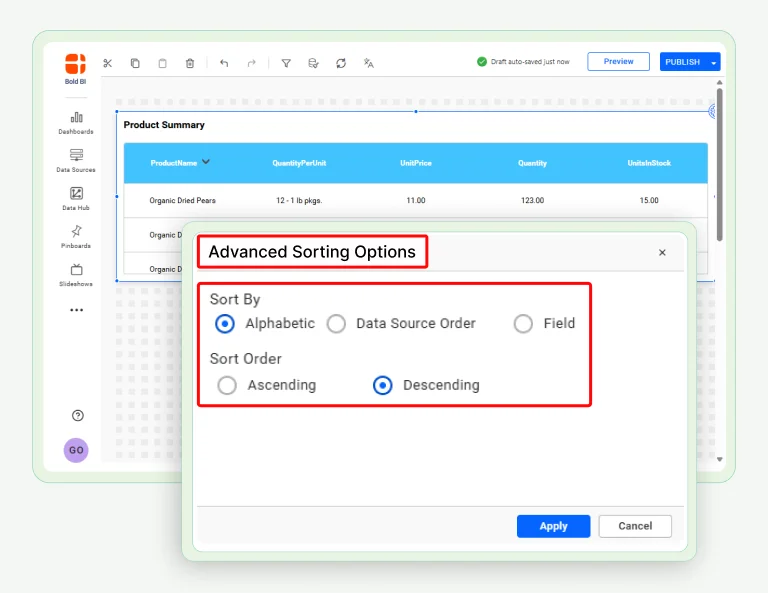
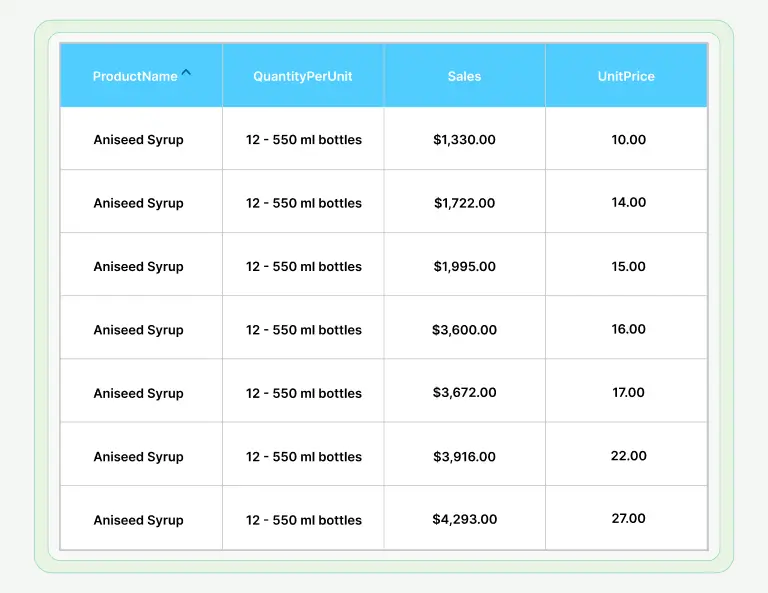
How to Add Custom Sorting to Dashboards
01:45
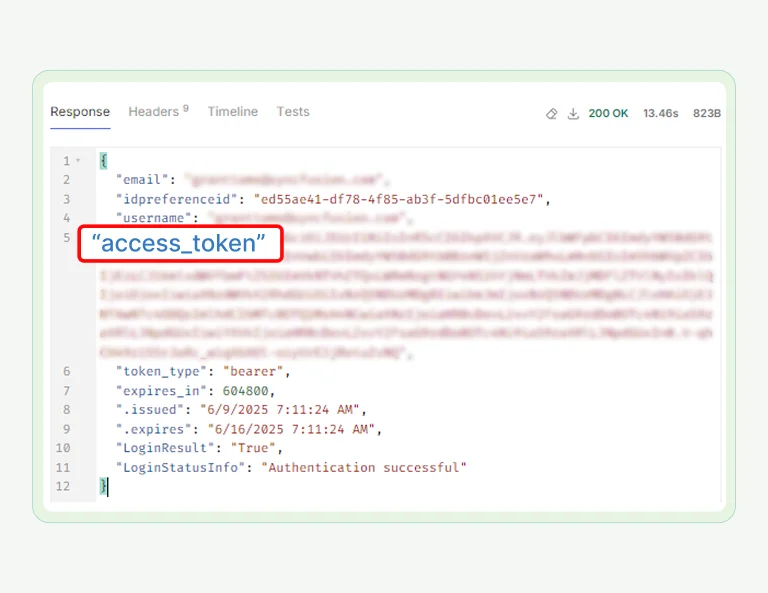
How to Generate Access Tokens Based on User Type via REST API
03:27
How to Apply Row-Level Security with Multiple CSV Files in Dashboard
03:01
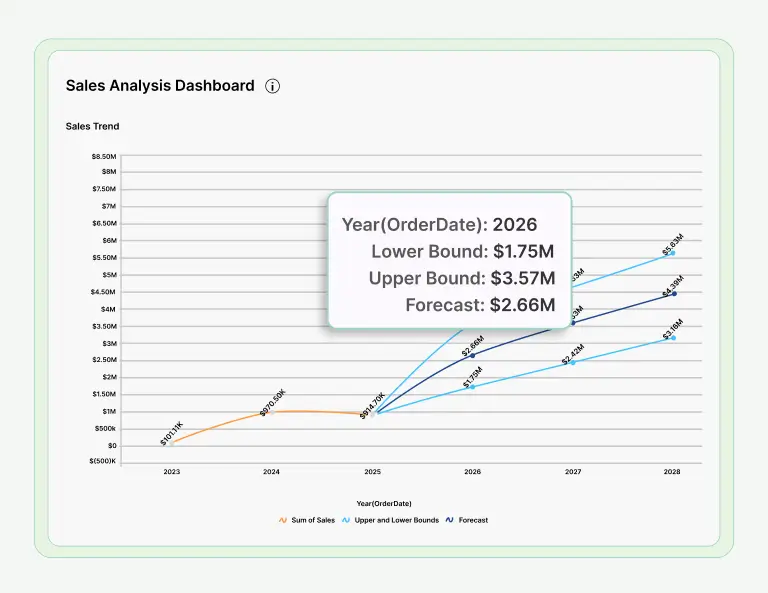
How to Predict Future Trends Using Forecasting Models
01:13
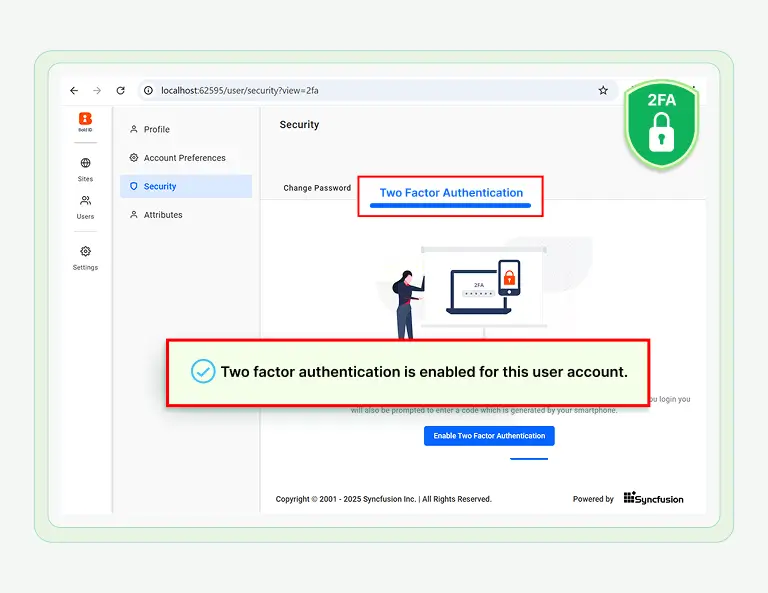
How to Enable Two-Factor Authentication (2FA) in the Dashboard Server
02:20
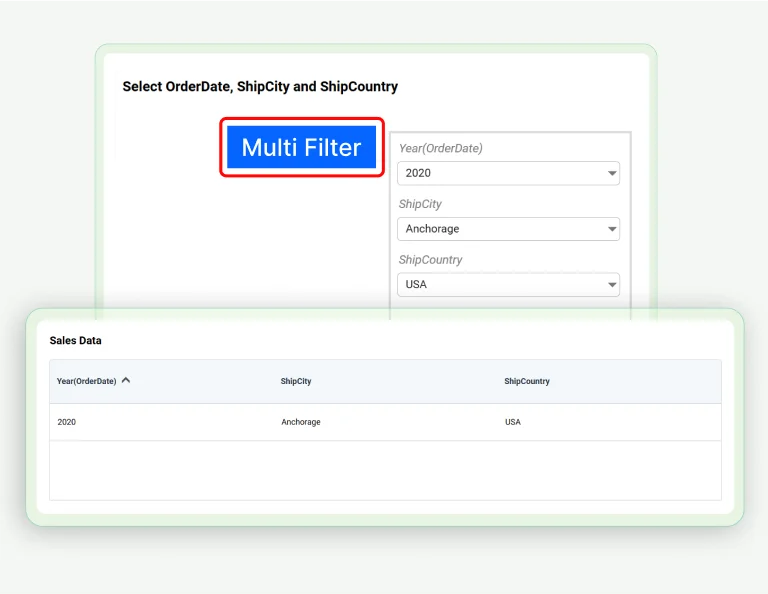
How to Add Multiple Filters to a Dashboard Using Custom Widgets
03:05
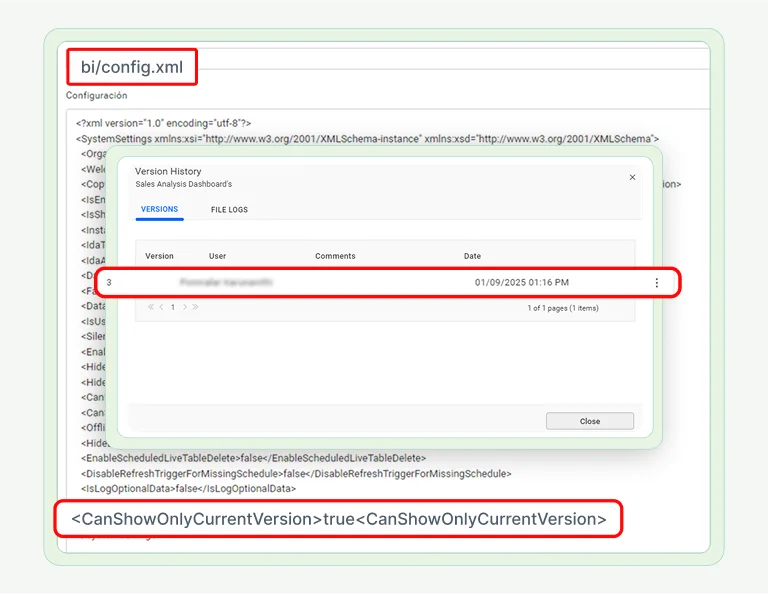
How to Restrict Non-Admin Users from Viewing Dashboard Versions
02:38
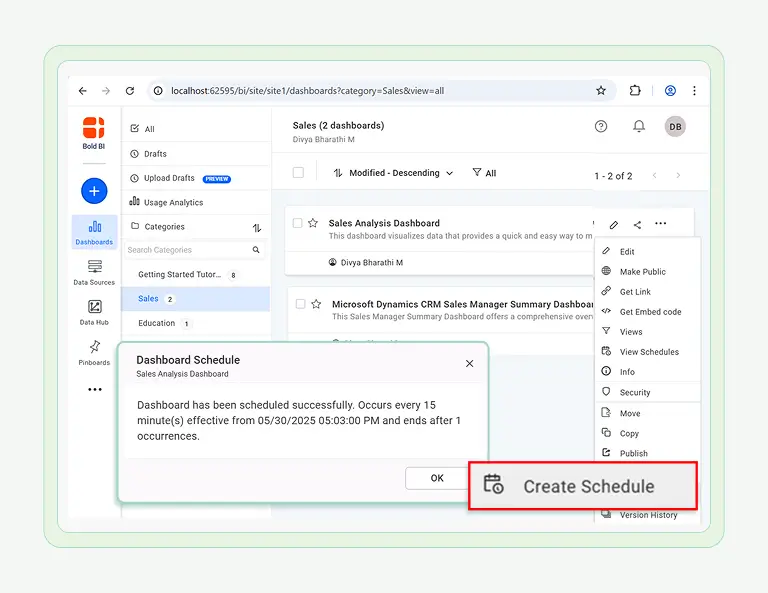
How to Schedule a Dashboard with Parameters
02:04
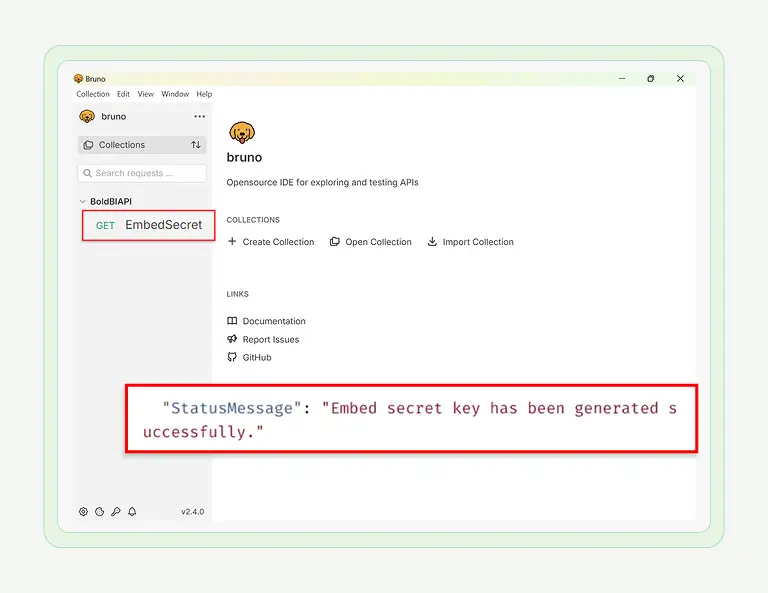
How to Generate an Embed Secret Key via REST API
02:28
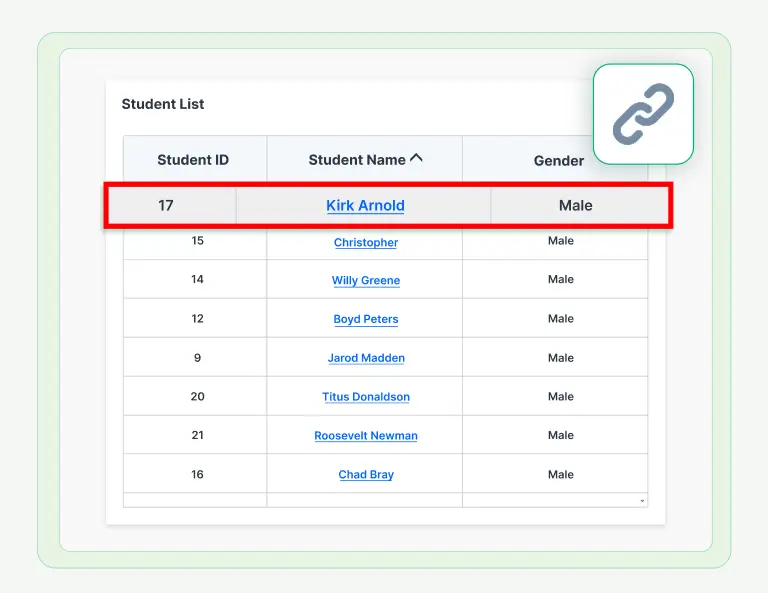
How to Add Drilldown to a Grid Widget Using Linking
02:23
How to Use AI Copilot and Agents in Your Dashboards
01:53
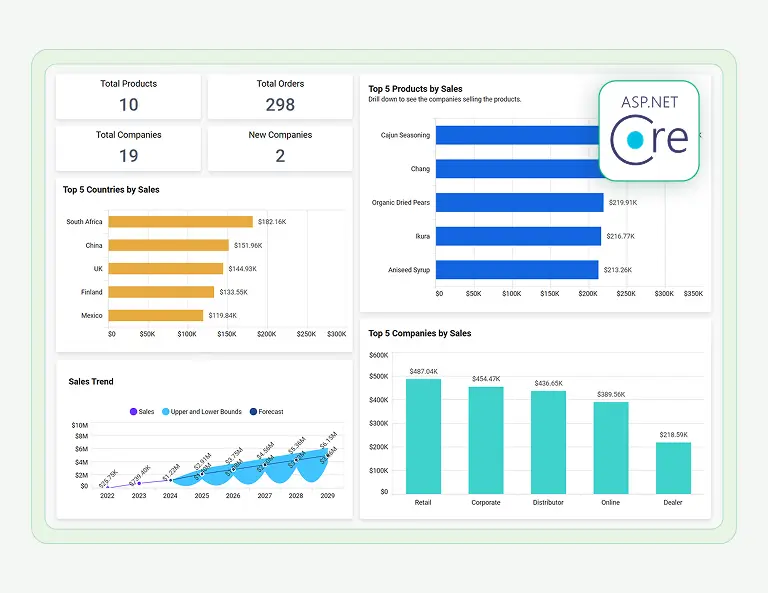
How to Embed Dashboards in ASP.NET Core Applications
03:01
How to Create Expressions with Custom Attributes in Dashboards

0
+
Fortune 500 Companies

0
M+
Developers

0
K+
Companies

0
+
Years in Business
What we liked best was the ability to connect to on-prem data sources, easy connectors, embedding visualizations, and a reasonable cost.

Samuel Davidson
We evaluated a bunch of dashboard solutions for one of our top clients. Finally, we zeroed down on Syncfusion. We are super happy with the results.

Tushar Apshankar
I like a lot of the dashboard features. The new user management server helps me to handle the users and authentication all in one place.

Pedro Hernandez
Now I can basically provide anything the customer needs from their dashboard, and I really don't have limitations. I can customize anything.

Timothy Kenny