

Embed real-time analytics inside your SaaS application
Add interactive dashboards directly inside your product — pick a quick iFrame for simple cases, or the full JavaScript SDK and REST APIs when you need deeper control over theming, filtering, and events.
No credit card required.

AI analytics
Type a question in plain English and watch a chart build itself.

White-label
Recolor, refont, and relogo it until it's unmistakably yours.

Multi-tenant
One deployment, hundreds of customers, each seeing only their own data.
Syscon
Networcx
A4B
DigiQuip
CarNow
Revver
Smartway2
GeniusVets
Talentegy
Two ways to embed — pick based on what you need
Bold BI supports two embedding methods. The right choice comes down to how much control you need — not which is "better." Security and licensing work identically either way.
iFrame embedding
Paste a single embed URL and a dashboard is live — no SDK, no build step. Best for internal tools, portals, blogs, and full admin-portal embedding, since Full Server Embedding can drop the entire Bold BI platform into an iframe when you need more than one dashboard.
-
Fastest path to a live dashboard — embed URL only
-
Appearance and theme customization
-
Token-based security via URL or embed secret
<iframe src="https://your-server.com/bi/site/site1
       /dashboards/{dashboard-id}/Embed?isembed=true"
       width="100%" height="100%"
allowfullscreen frameborder="0"></iframe>JavaScript SDK
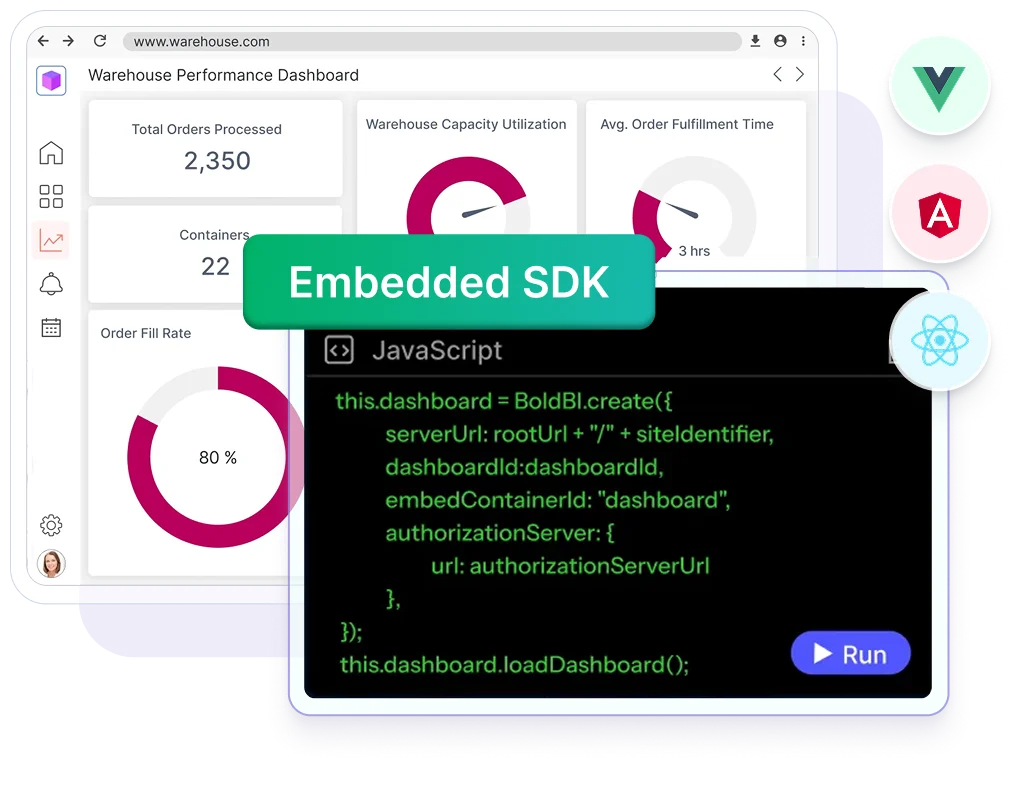
Call BoldBI.create() from Angular, React, Vue.js, or one of 20+ other supported frameworks and languages — including ASP.NET Core, ASP.NET MVC, Blazor, Java, PHP, Python, and Ruby on Rails — for full programmatic control.
-
Full API control over layout, filters, and events
-
Event handling and dynamic filtering
-
Token-based security via URL or embed secret
BoldBI.create({
  serverUrl: "https://your-server.com",
  dashboardId: "tenant-overview",
  embedContainerId: "dashboard-container",
  embedToken: token
});iFrame vs. JavaScript SDK: which one do you need?
Not sure which to pick? Compare the two side by side across customization, setup effort, and security to see which fits your project.
| Capability | iFrame embedding | JavaScript SDK |
|---|---|---|
| Customization | Appearance and theme only | Full API control — layout, filters, events |
| Interactivity | Limited | Full — events and dynamic filters |
| Ease of setup | Very easy — embed URL only | Moderate — requires coding |
| Token-based security | Supported via URL or embed secret | Supported |
| Event handling | Not supported | Supported |
| Best for | Internal tools, portals | SaaS applications, dev teams |
From data to live embed, in three steps
Choosing iFrame or SDK answers how you embed. Here's the full sequence around it.
Connect and secure
Point Bold BI at your data through one of 140+ connectors, then set up token-based authentication (JWT) with row-level security scoped to tenant, organization, or role.
Choose your embed
Drop in a single iFrame for the fastest path, or call BoldBI.create() from the JavaScript SDK when the use case needs event handling, dynamic filtering, or per-user theming.
Brand and scale
White-label the result, then grow into it — the same multi-tenant architecture that serves ten customers serves ten thousand, without a different setup.
No credit card required.
Key features
Everything below ships in the same platform — none of it is a separate add-on or a higher pricing tier.
Enterprise-Ready Compliance
Bold BI helps you meet key security and compliance standards. All activity logs are safely stored, can’t be changed, and are easy to export when needed.




Support and resources
The evaluation doesn't end at signup — here's what's there once you're actually building.
Analytics that wins awards and users
Recognized by G2, TrustRadius, and Visual Studio Magazine for delivering standout performance and value.
I appreciate Bold BI for making it easier to provide reporting for our customers, allowing both our analysts and customers to easily build and publish reports. The ability to build dashboards and modify queries for specific outcomes is very user-friendly. I value the mobile readiness of the app and its integration capabilities with API structures. The addition of AI features is impressive. The economic pricing model and the effective partnership, which includes consistent and helpful support, make it an invaluable tool for our OEM model.
Ravi S.

The support from Bold is unmatched. They do not charge extra for support and it is excellent anyway. All our tickets and questions are quickly answered with authoritative and precise guidance. This is important at the product is complex, powerful and mature. To get the most out of the tool, the level of support they provide is essential.
Murph M.
It was easy to implement data visualizations into our product. The standard widgets allowed us to build professional looking dashboards, and a robust API provided excellent control of the development and runtime process from within our application.
Scott Y.
Users Love Us
Visual Studio Reader's Choice - 2025
Leader - Fall 2025
High Performer - Fall 2025 EMEA
Regional Leader - Fall 2025 AMERICAS
TrustRadius Tech Cares
Capterra - 4.9/5
G2- 4.4/5
GetApp - 4.9/5
Software Advice - 4.9/5
Frequently asked questions
Embedded analytics means building dashboards and reports directly into a software application — a SaaS product or an internal tool — instead of sending users to a separate BI tool. Bold BI supports this through a JavaScript SDK, REST APIs, or iFrame embedding, depending on how much control a given use case needs.
Yes — migration paths exist for teams moving off other embedded BI tools, and the application-based licensing model (rather than a per-viewer fee) is often the specific reason a SaaS company outgrowing per-seat pricing makes the switch.
The combination is what matters more than any single point: 140+ data connectors, 20+ supported frameworks and languages for embedding, full white-label customization, and pricing that doesn't charge per end-user viewer the way several competitors do.
Yes — access is scoped through token-based authentication (JWT) and row-level security, so each user only ever sees their own tenant's, organization's, or role's data, with SSO available via Okta, Auth0, Azure AD, ADFS, Keycloak, and AWS Cognito.
A SaaS team can drop dashboards directly into their product, restyle them to match their own brand, and keep every tenant's data walled off from every other tenant's — using a fast iFrame for simple cases or the JavaScript SDK when deeper, event-driven control is worth the extra setup.
Yes — each tenant's data stays fully isolated within a single deployment, with a choice between site-per-tenant or single-site architecture depending on how the product needs to scale.
Yes — fonts, colors, logos, and UI chrome are all customizable, and Bold BI's own branding can be removed entirely so the embed reads as a native part of the host product.
Traditional BI requires users to leave the application and log into a separate platform to view reports. Embedded analytics puts those same dashboards directly inside the product someone already uses, which is what actually drives adoption — insights people have to go looking for get checked far less often than insights sitting in the workflow they're already in.
Two reasons come up most often: customers increasingly expect a “reporting tab” as a baseline feature, not a differentiator, and building that capability in-house diverts engineering time a product team would rather spend on the core roadmap. Embedding an existing platform gets the feature shipped in weeks instead of the 6–12 months a custom build typically takes.
Related articles
Explore expert guides, use cases, and best practices to help your team get more from Bold BI and turn data into decisions faster.



See your own data embedded, not just a demo dataset
Start a free 30-day trial with no credit card required, or get a walkthrough from a solutions engineer scoped to your actual use case — not a generic sales deck.
No credit card required.