Jira Dashboard Example with Bold BI

Jira software is a great tool for software teams and organizations to plan, track, and deliver solutions effectively. With Jira data, projects and issues can be tracked and business decisions can be made. To identify the actionable trends, Jira data needs to be visualized. Bold BI lets you turn your data into useful information by showcasing key metrics, such as issues resolved and created over time and the current status of issues, in individual widgets organized as Jira dashboards for your agile teams. This blog post will walk through the steps to connect your Jira data to Bold BI. The sample data used throughout this post is focused on the issue tracking module in the Jira project management tool.
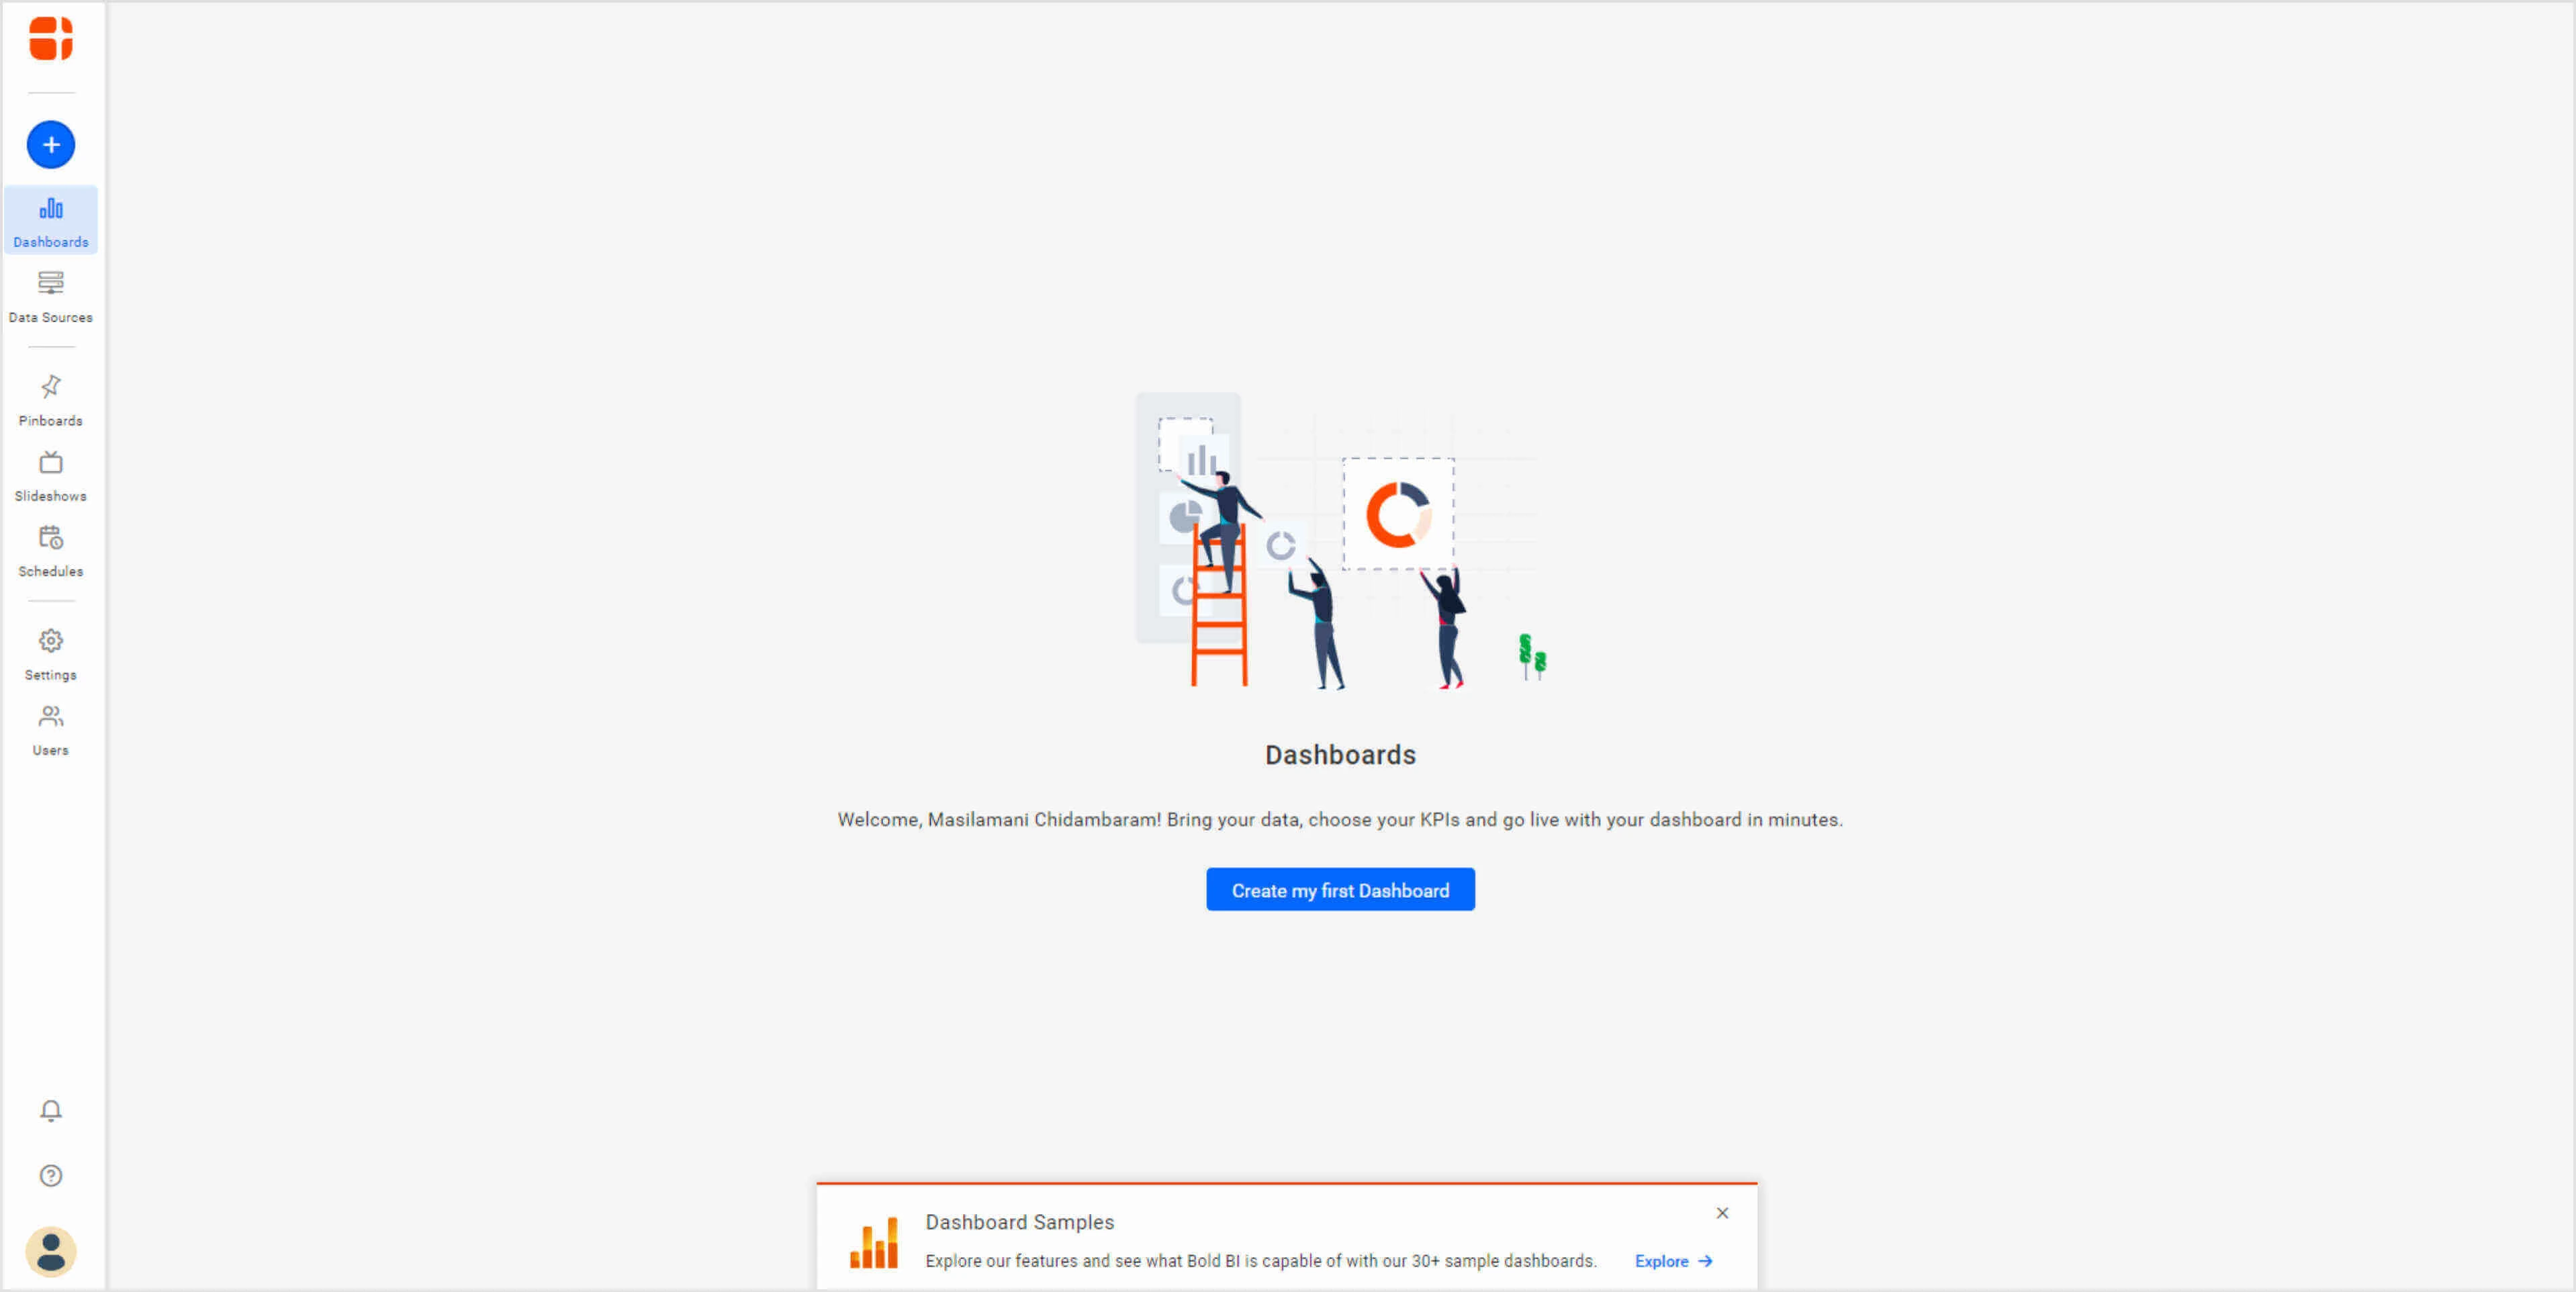
First of all, if you are new to Bold BI, sign up for a free 30-day trial on our website. Log into the site to see the home page.
You can create a new dashboard through any of the following ways:
We’ll go through each in turn.
Connect your Jira data to a custom dashboard
To create a new dashboard with a Jira dashboard template, click the Add icon in the left navigation bar.

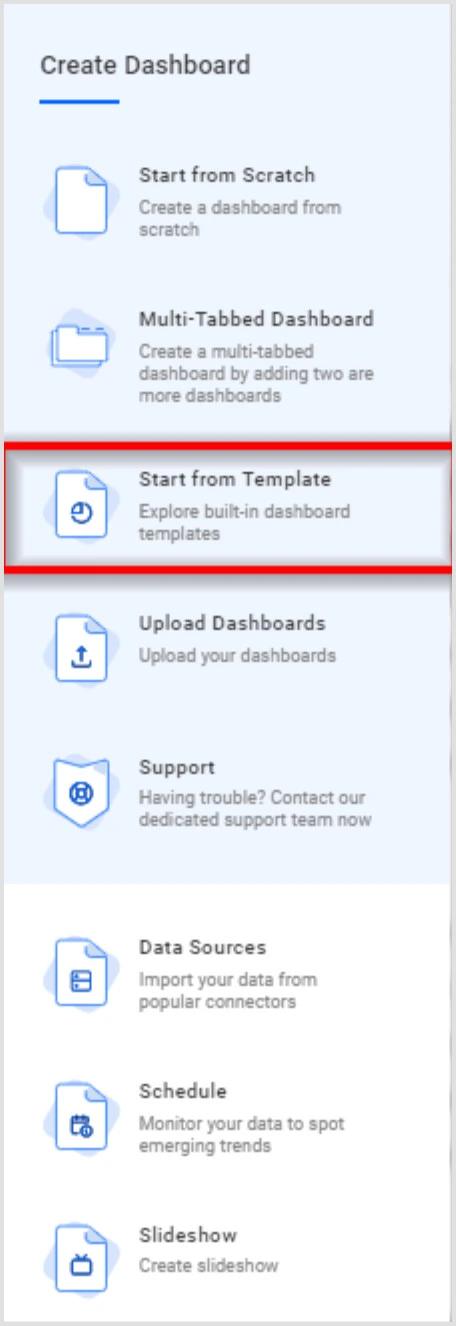
This opens the sliding panel you see in the following image with multiple options for creating dashboards. Click Start from Template.
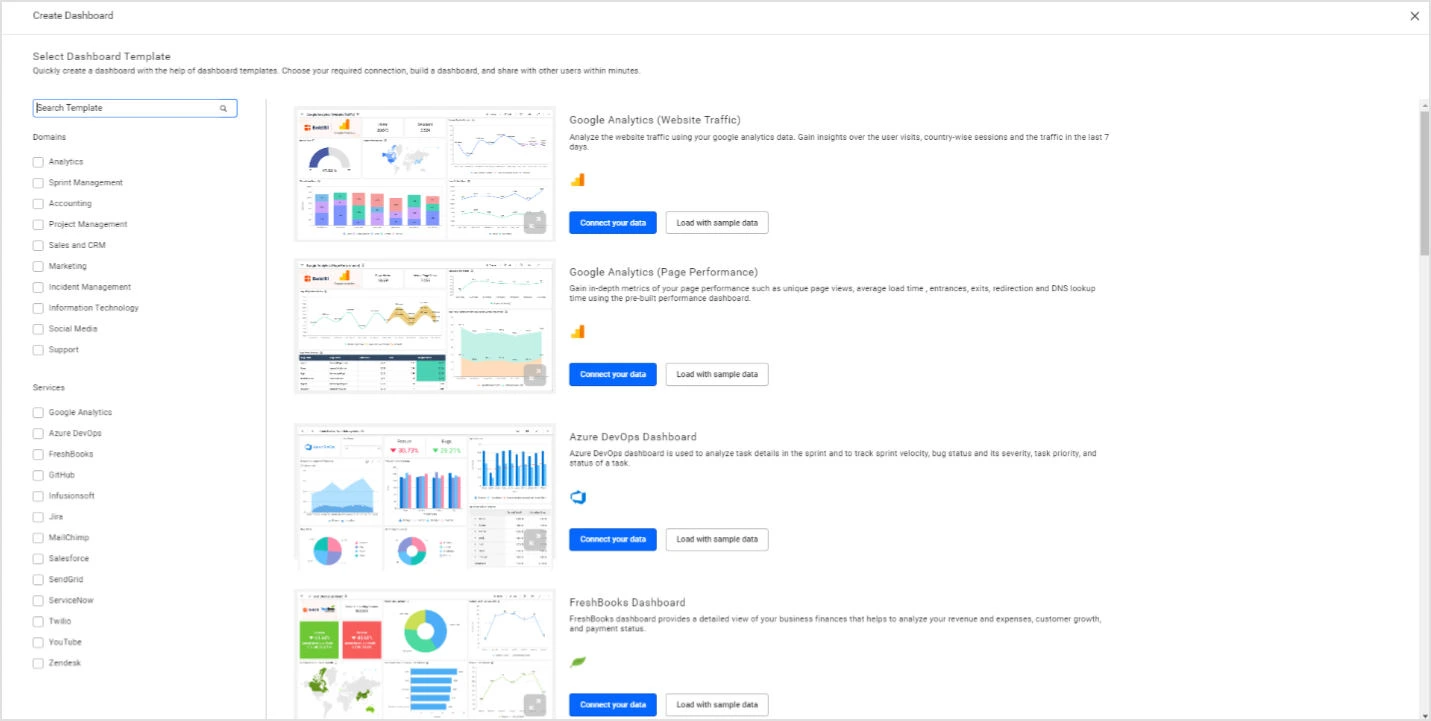
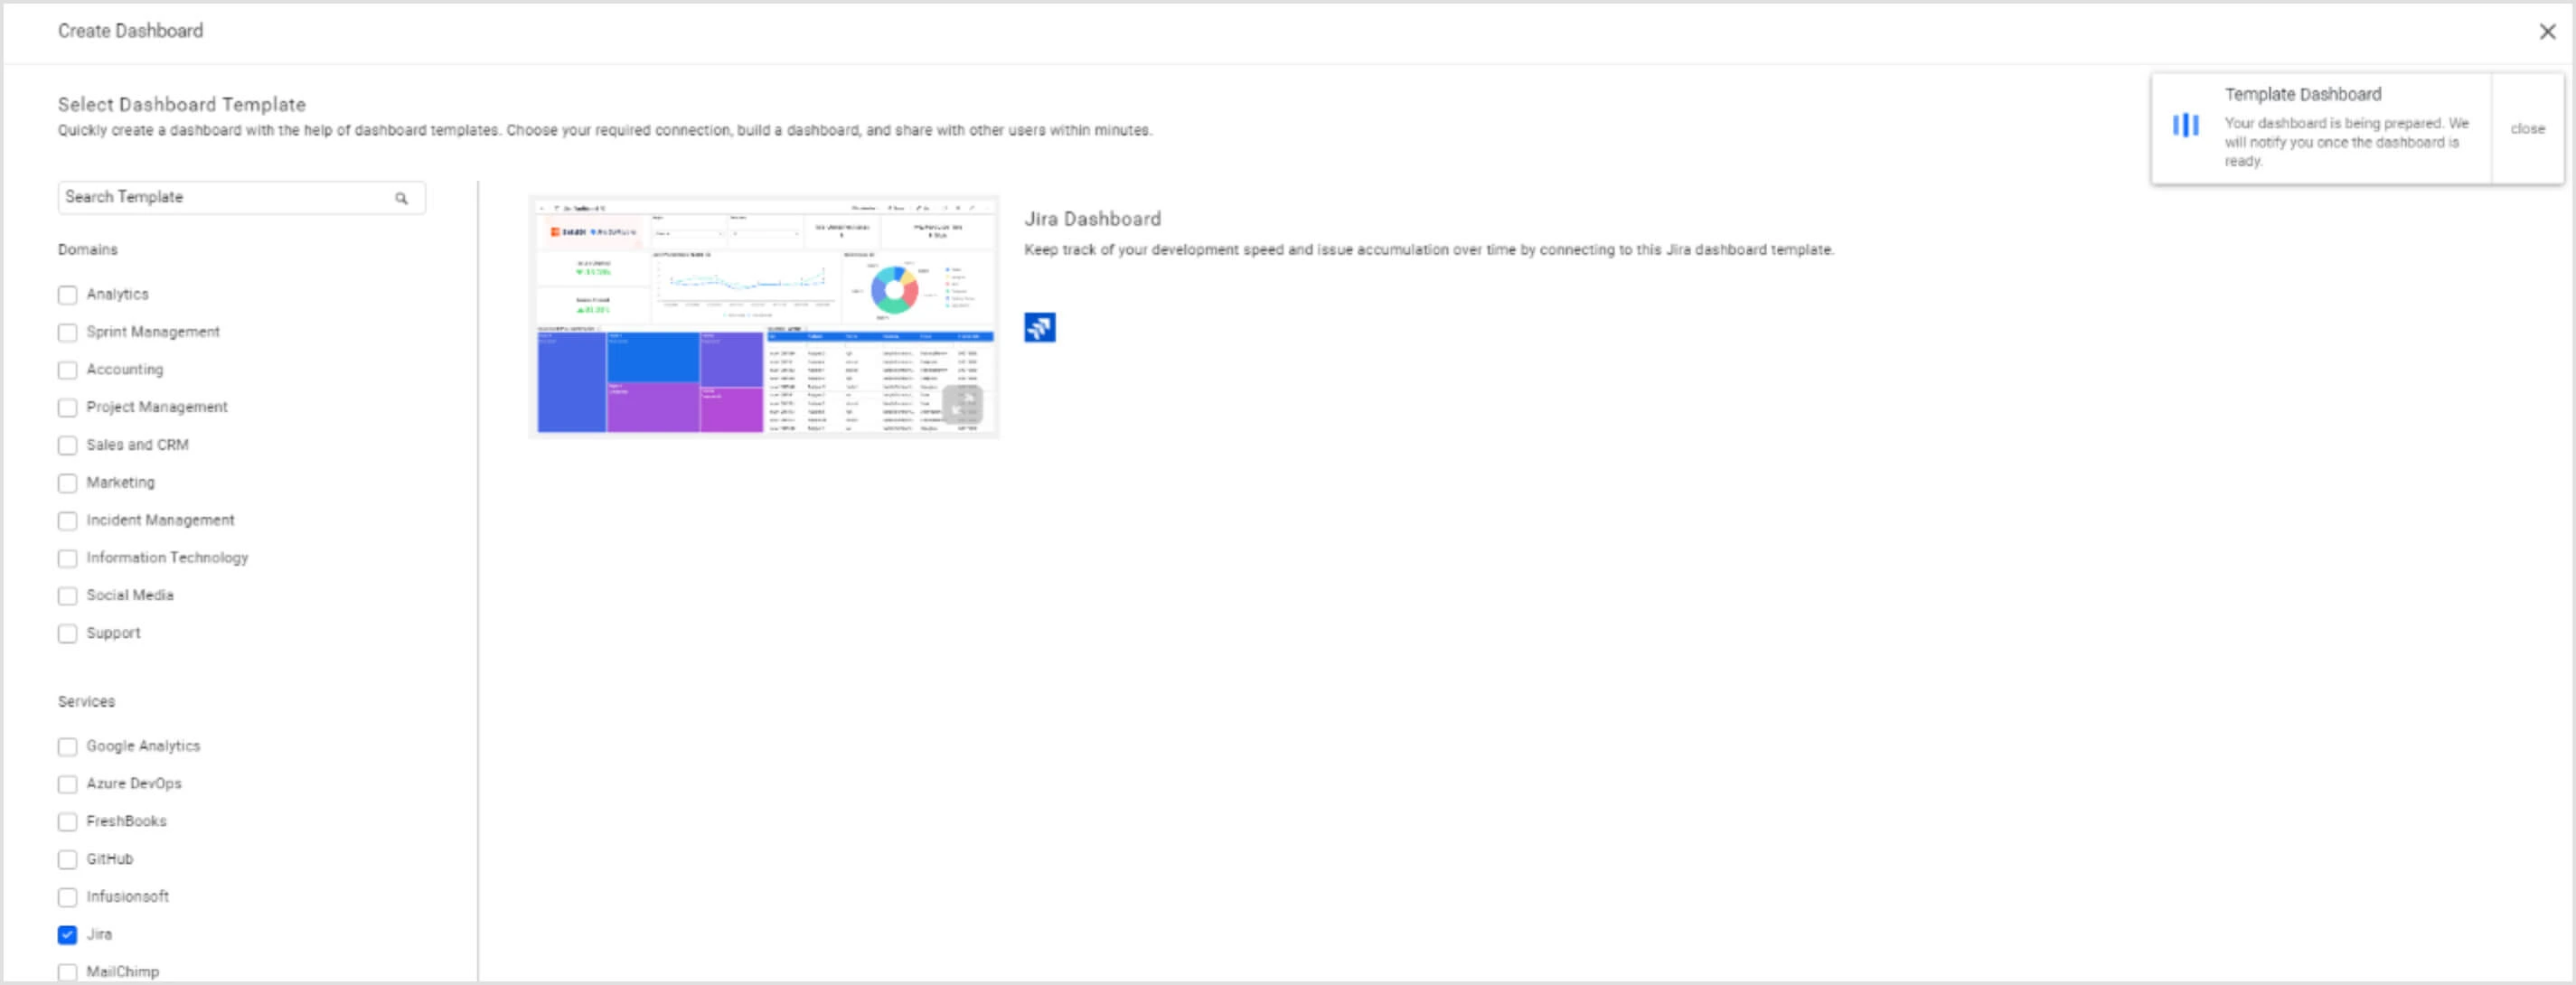
As a result, the Dashboard Templates window displays like in the following image.
Select Jira in the Data Sources listing to the left. Doing so will list the available Jira dashboard templates on the right.
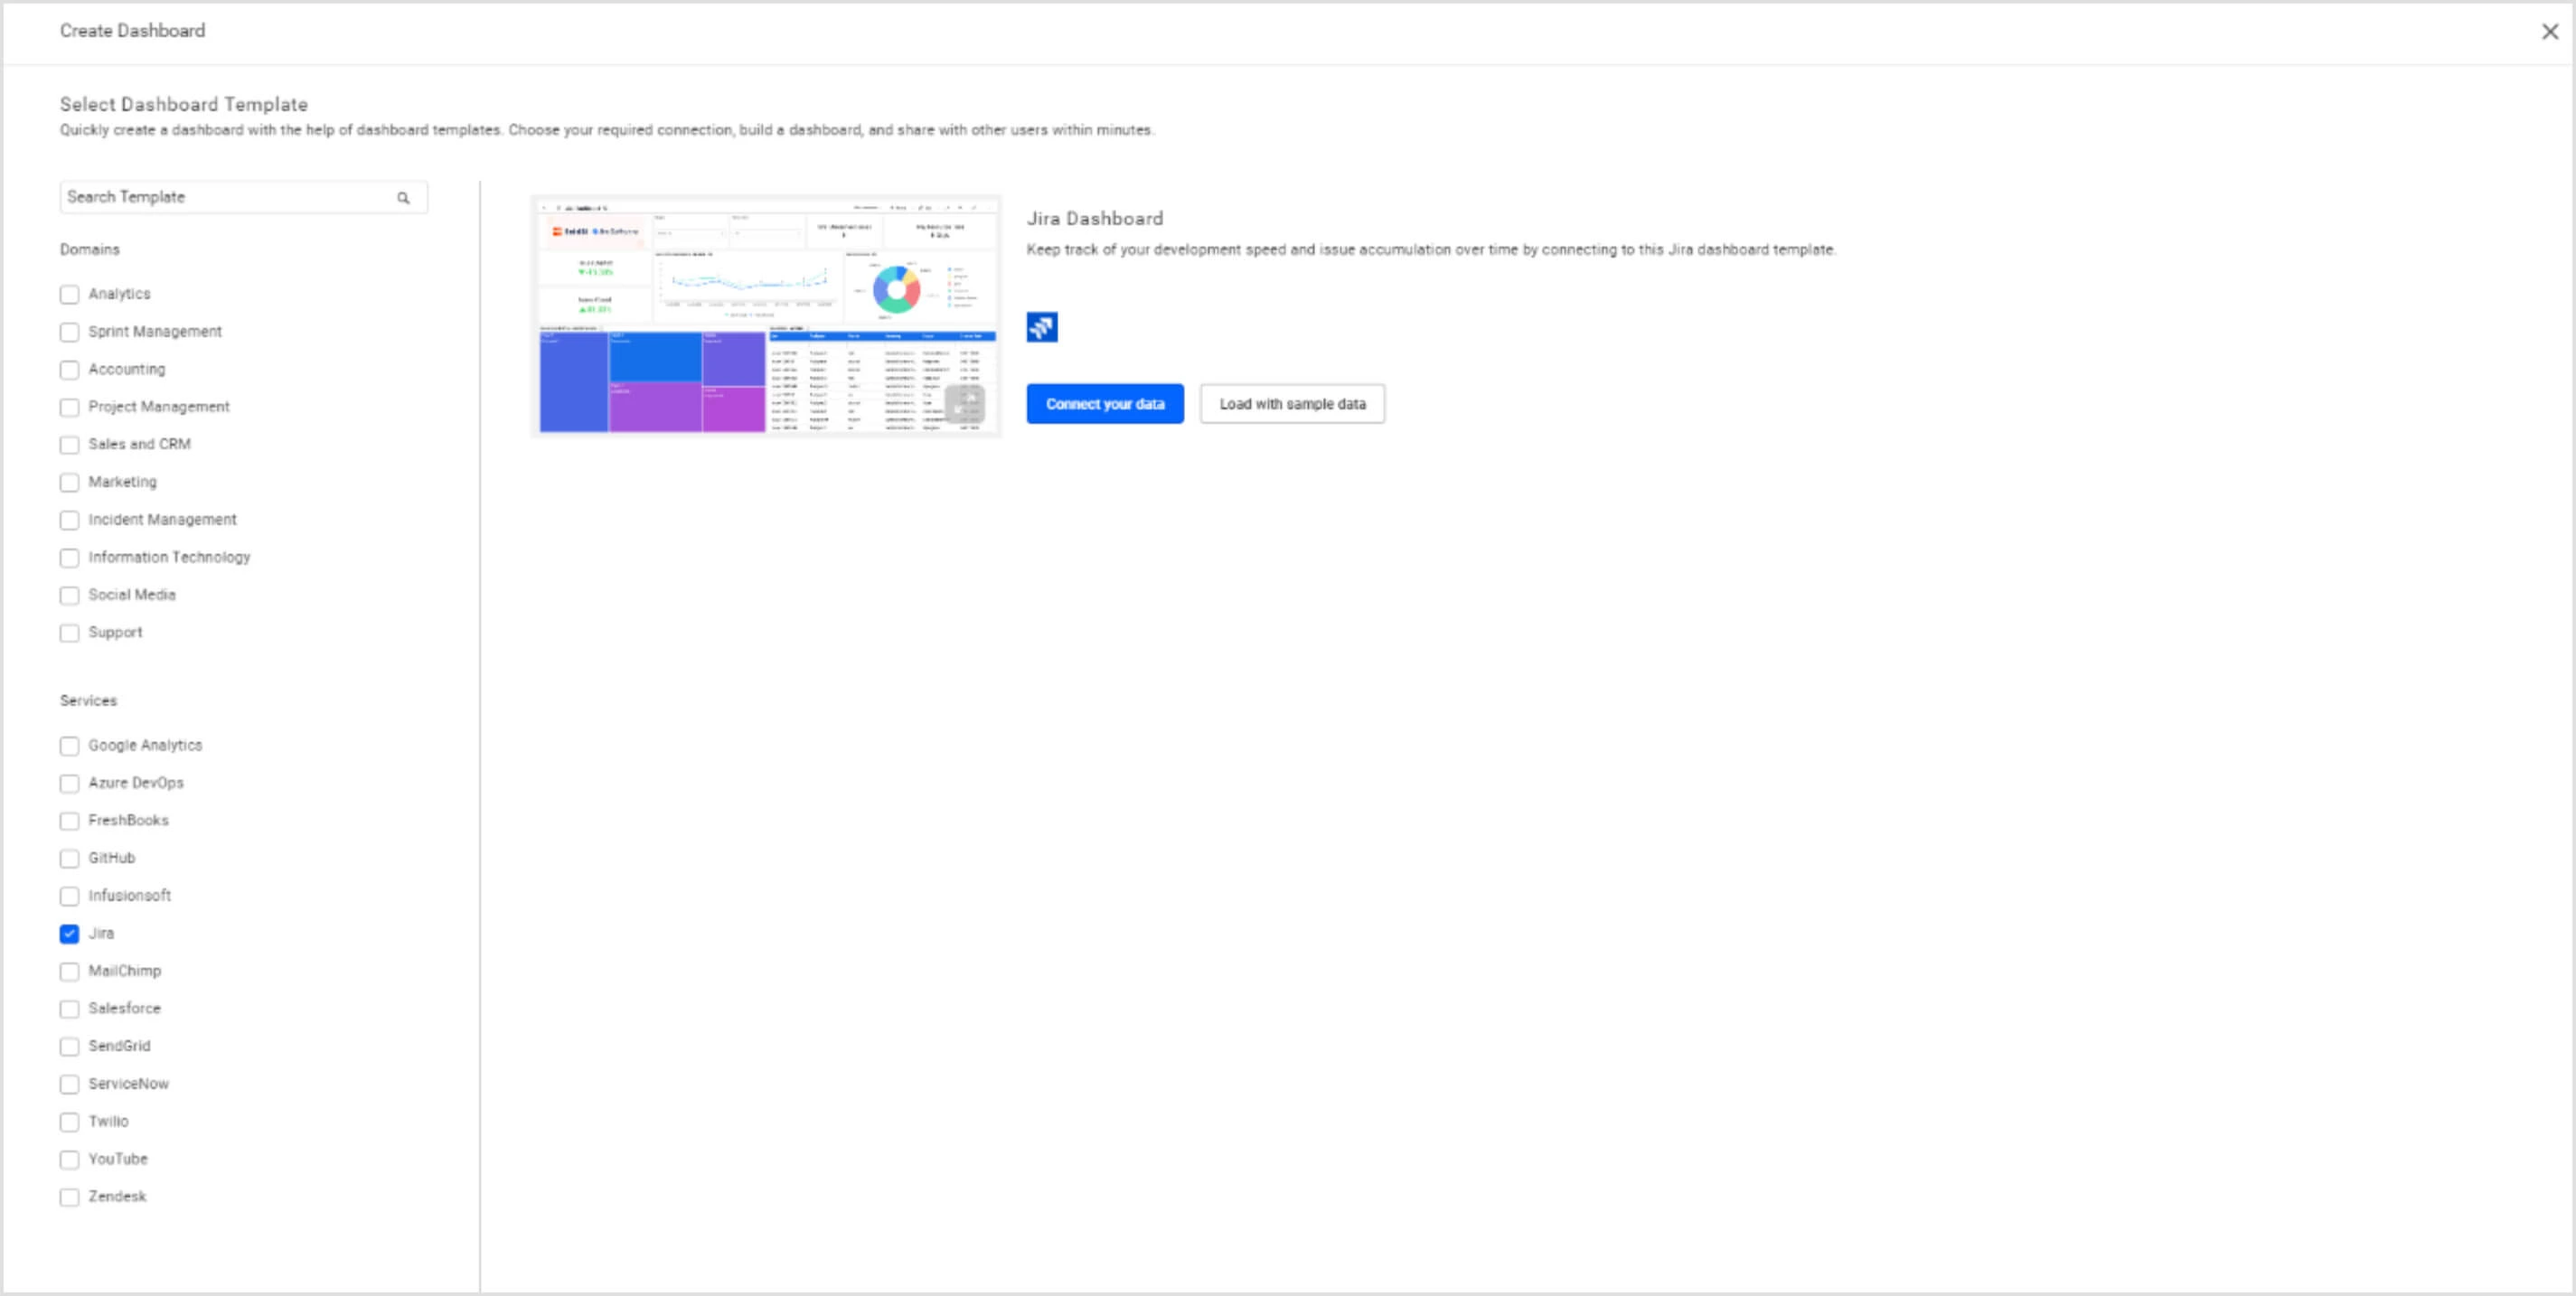
Choose your preferred Jira template from the listing. Currently, only one template is available in Jira. More templates may be available in the future.
To preview the dashboard template, select Load with sample data. The notification banner on the right shows the dashboard preparation progress with sample data.
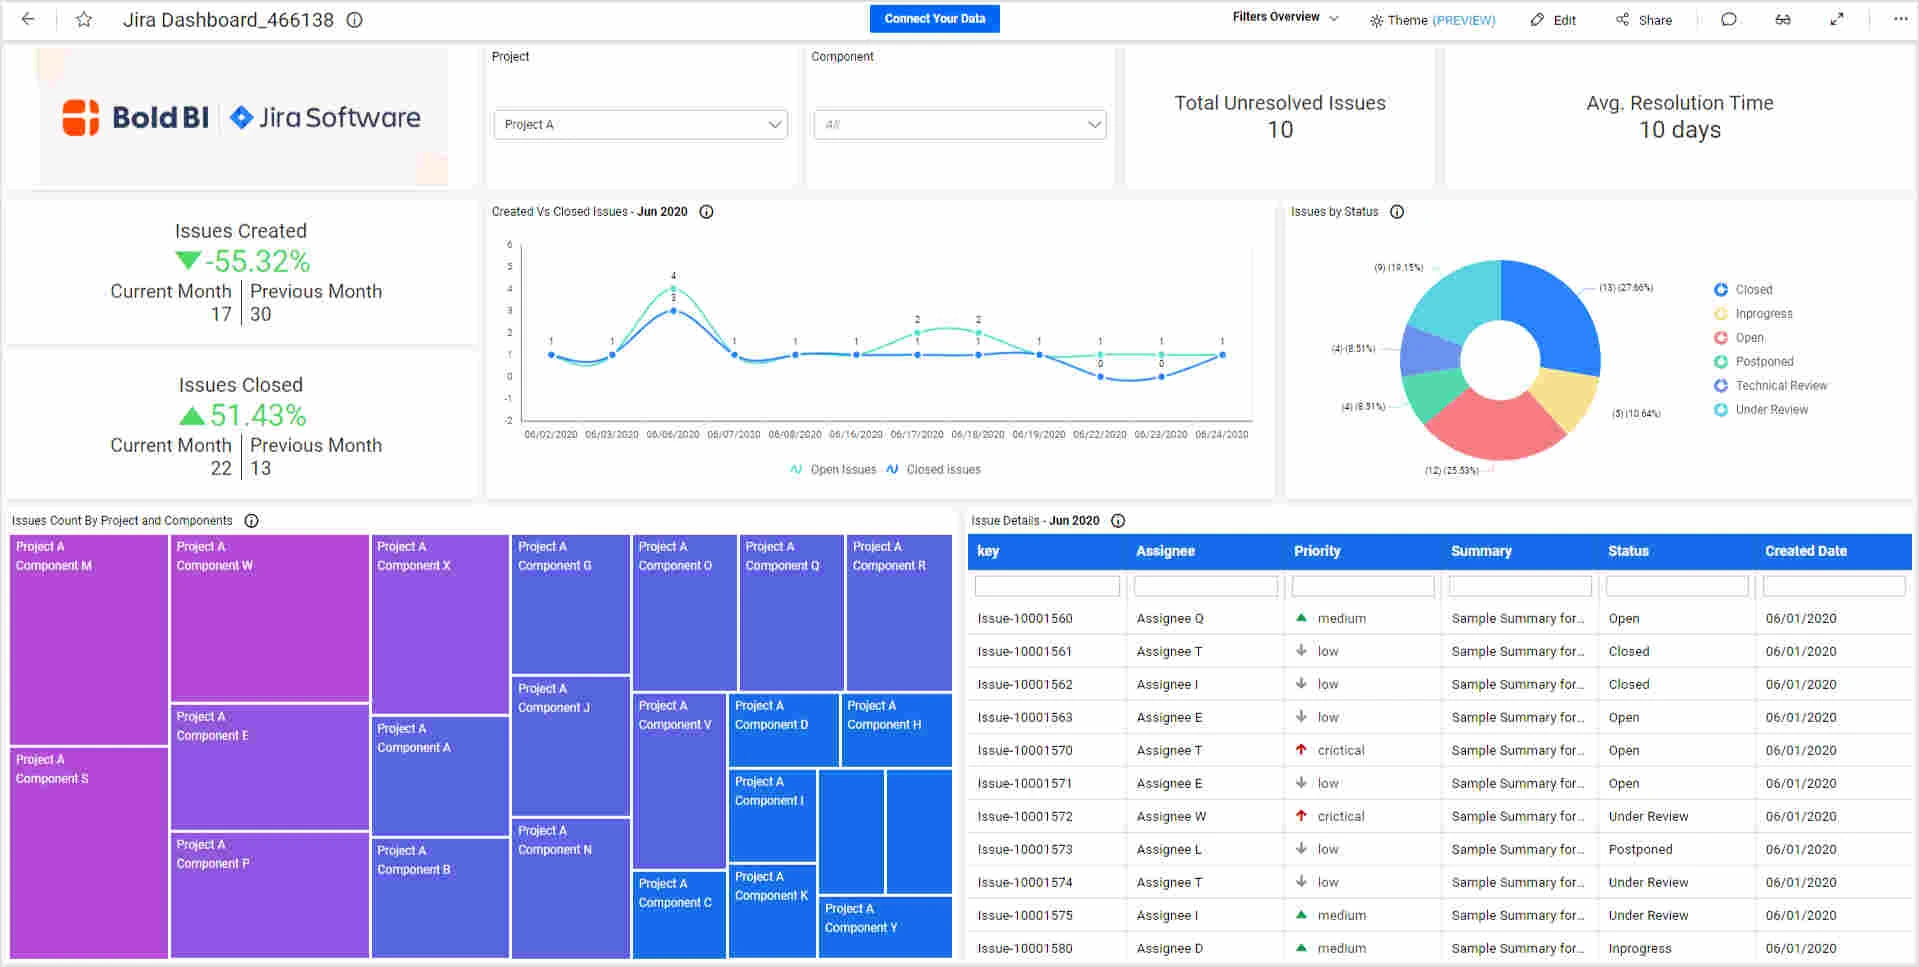
As a result, the Jira dashboard loads with sample data.
Once previewed, if you would like to visualize your own data, simply select Connect Your Data at the top of the dashboard. A window prompt like the one in the following image asks you to input your Jira domain and account details. This step is mandatory to authorize the connection to your account from your dashboard.
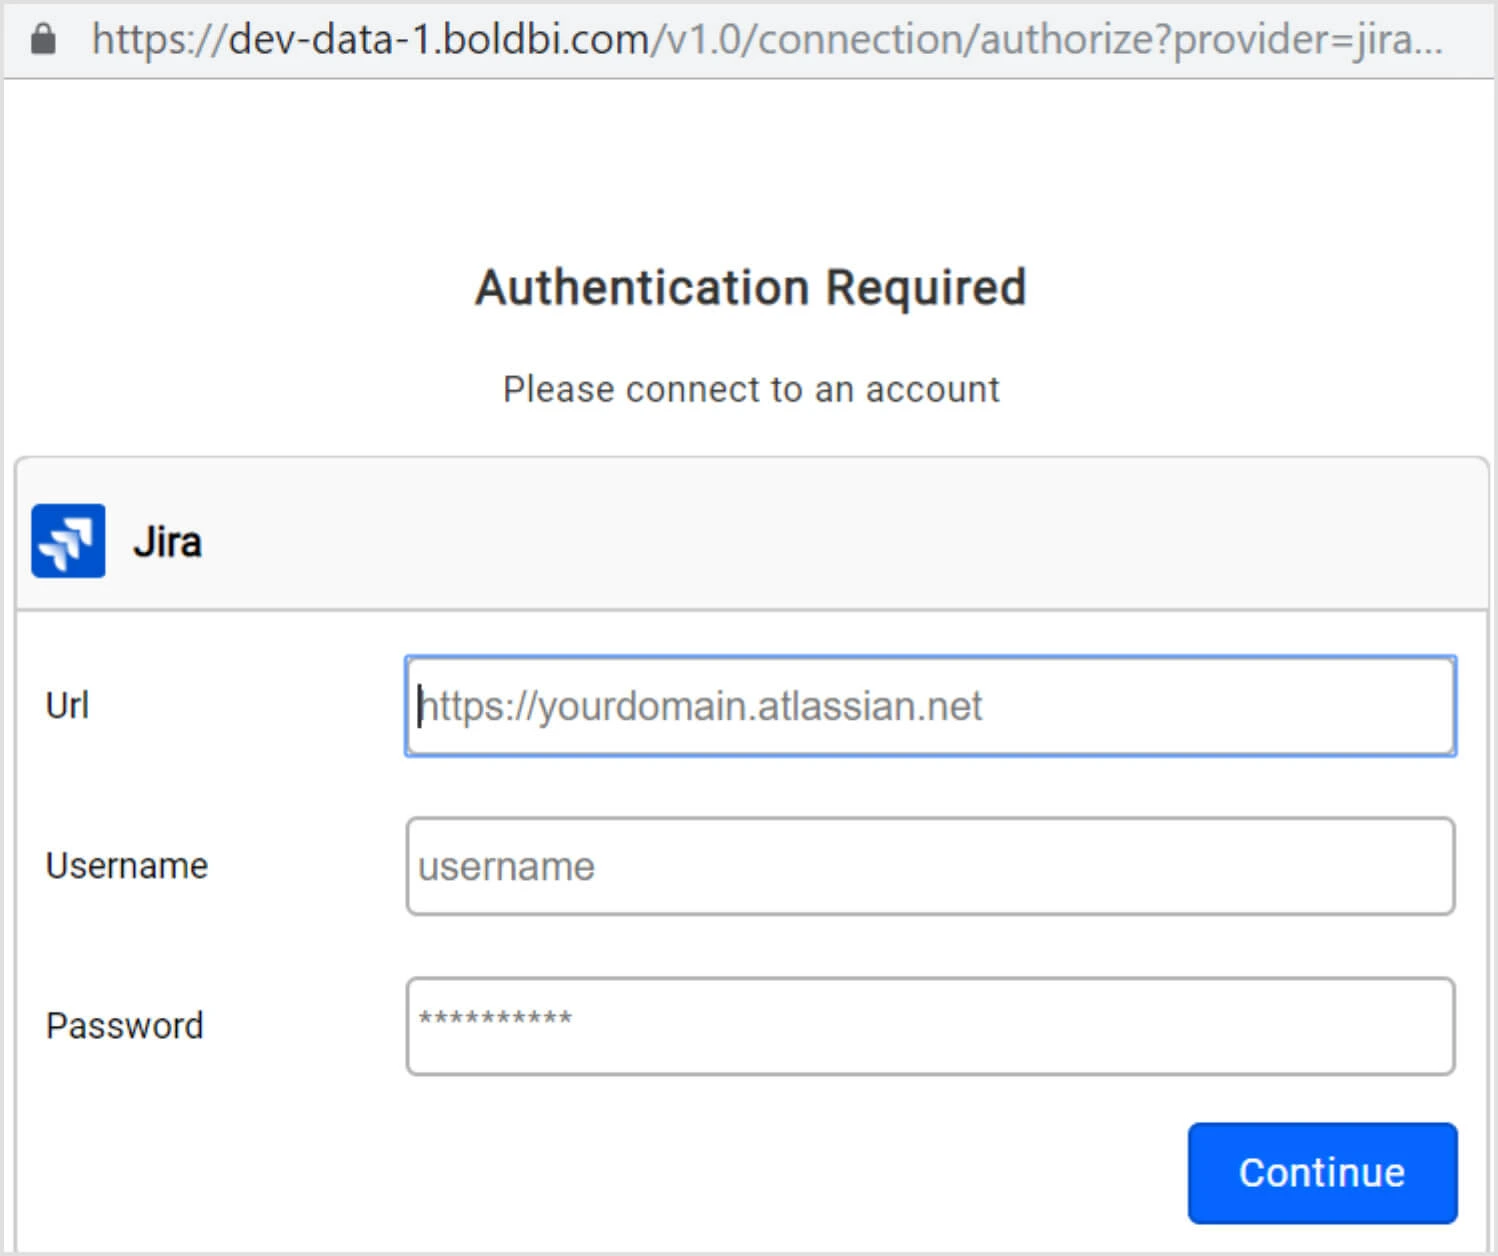
Enter the requested details and select Continue. The notification banner at top-right will show the dashboard preparation progress with your own data.
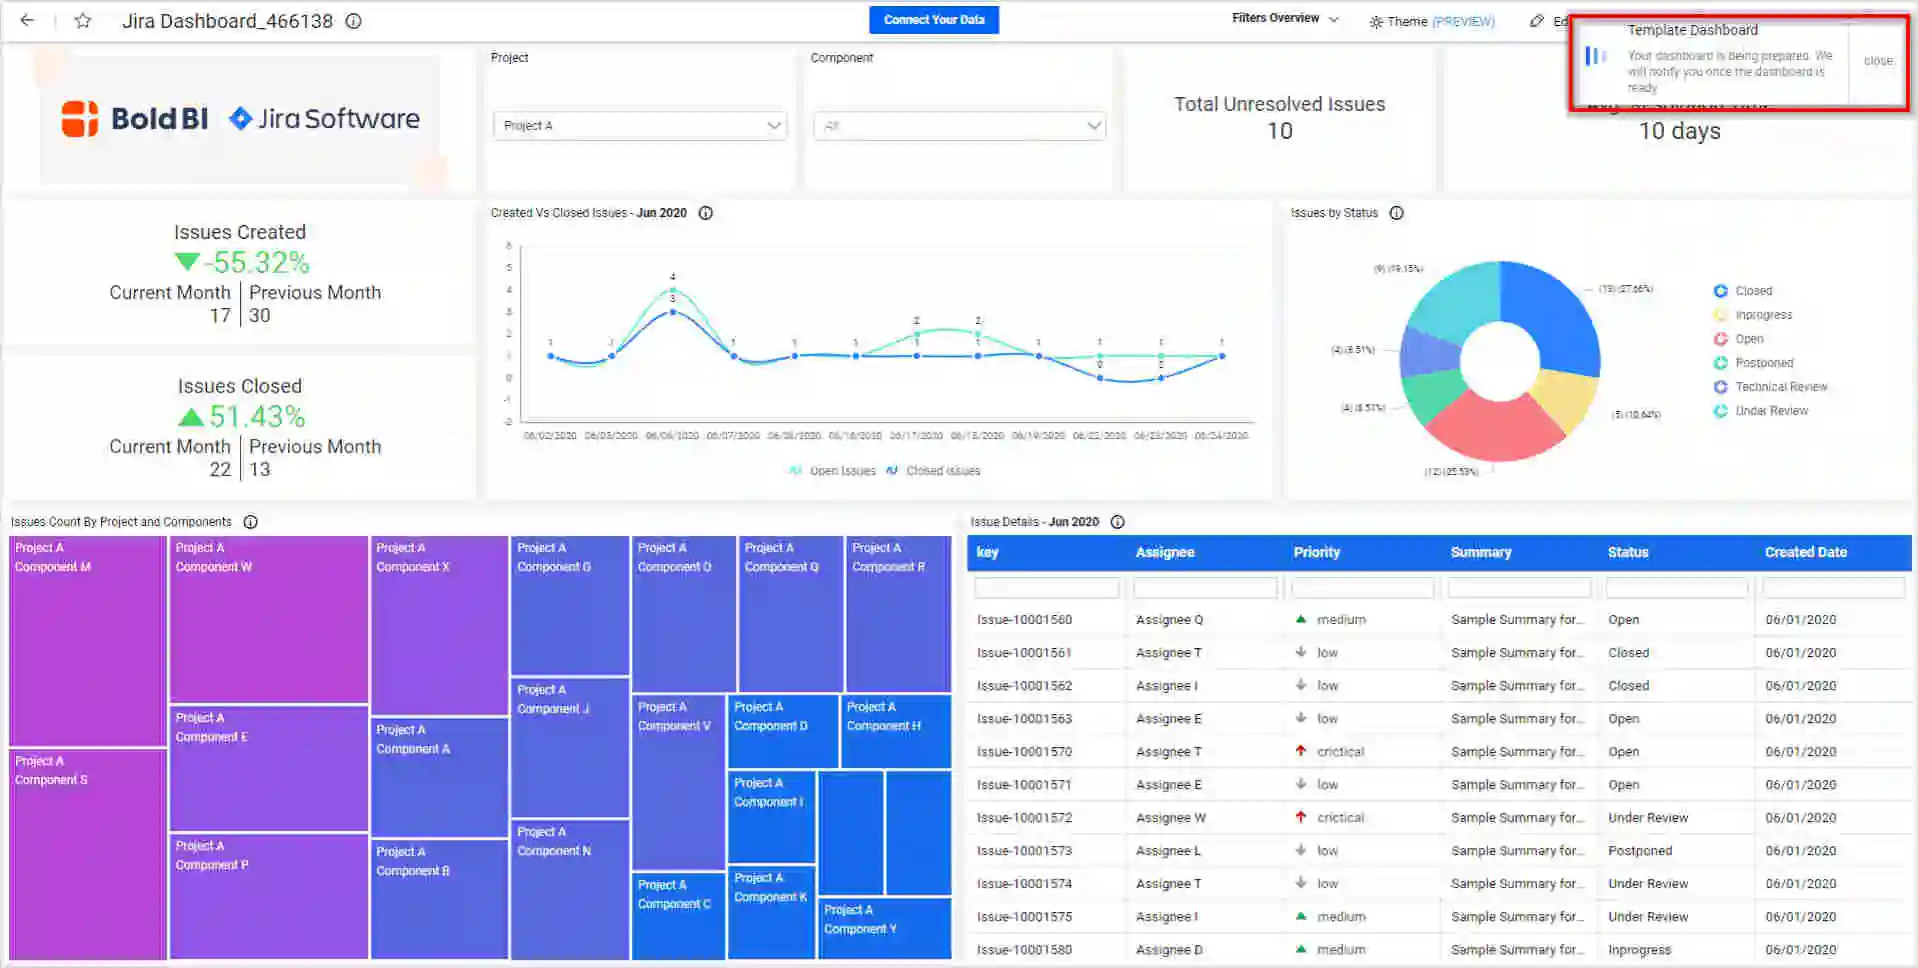
Once the preparation process is complete, the current page renders the Jira Dashboard with your own data. To share this dashboard with others, enable access permission to it for concerned users, copy the URL from address bar, and share it.
Start with your Jira data connected to a blank dashboard
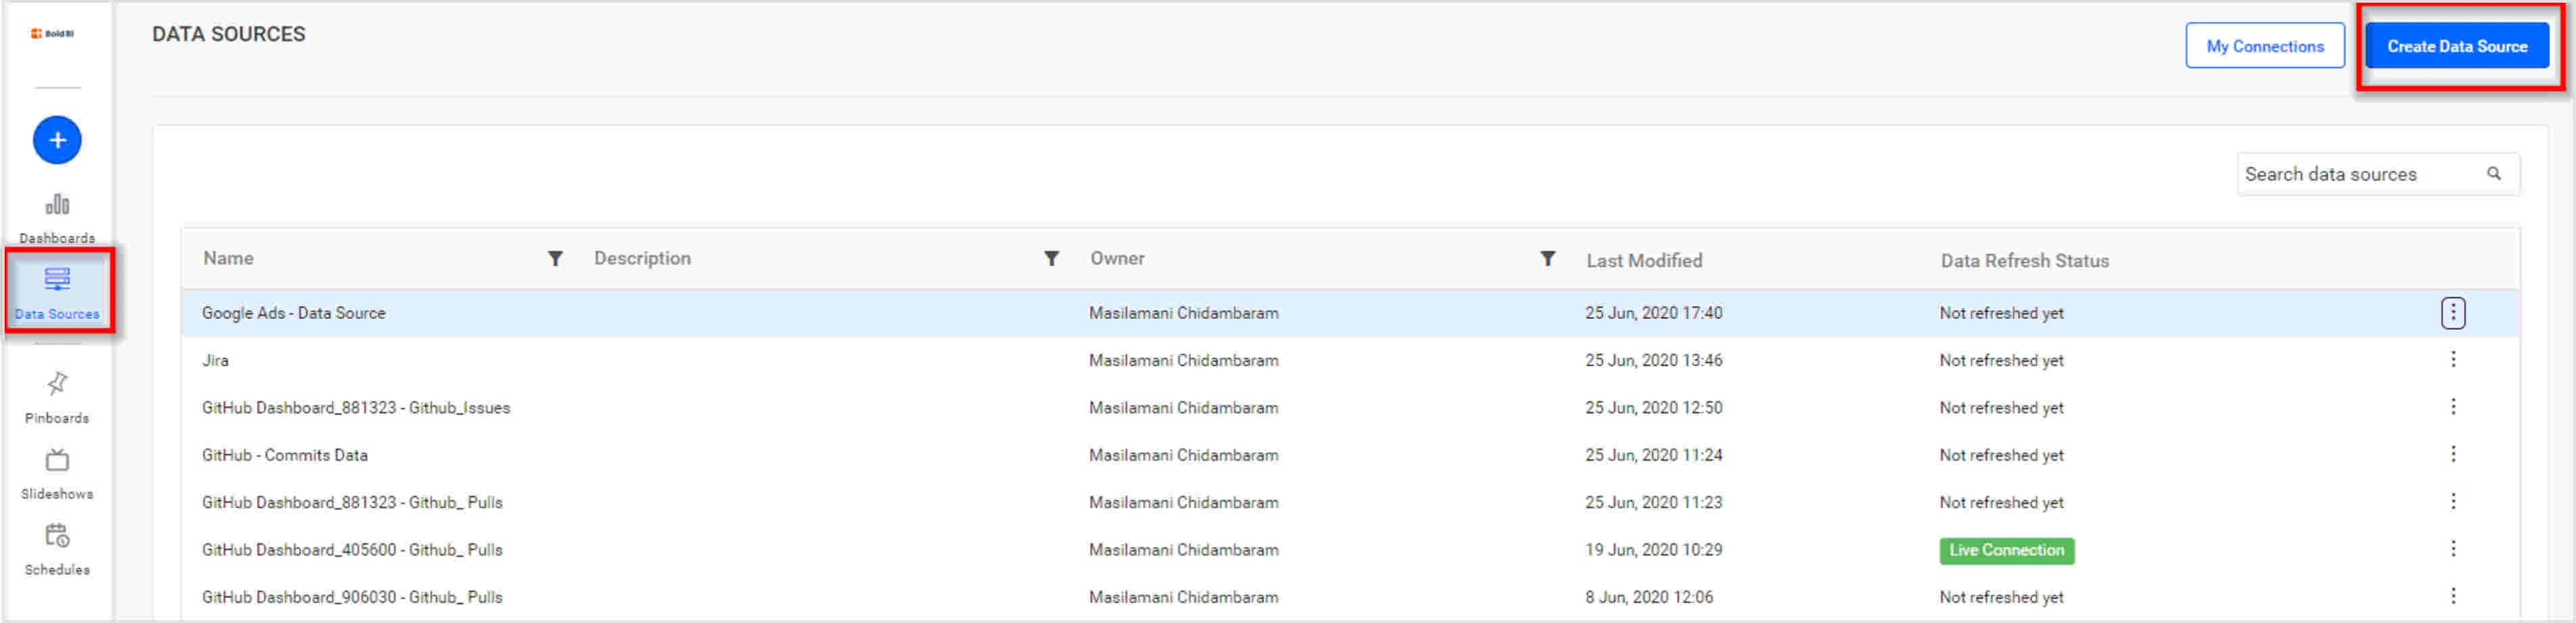
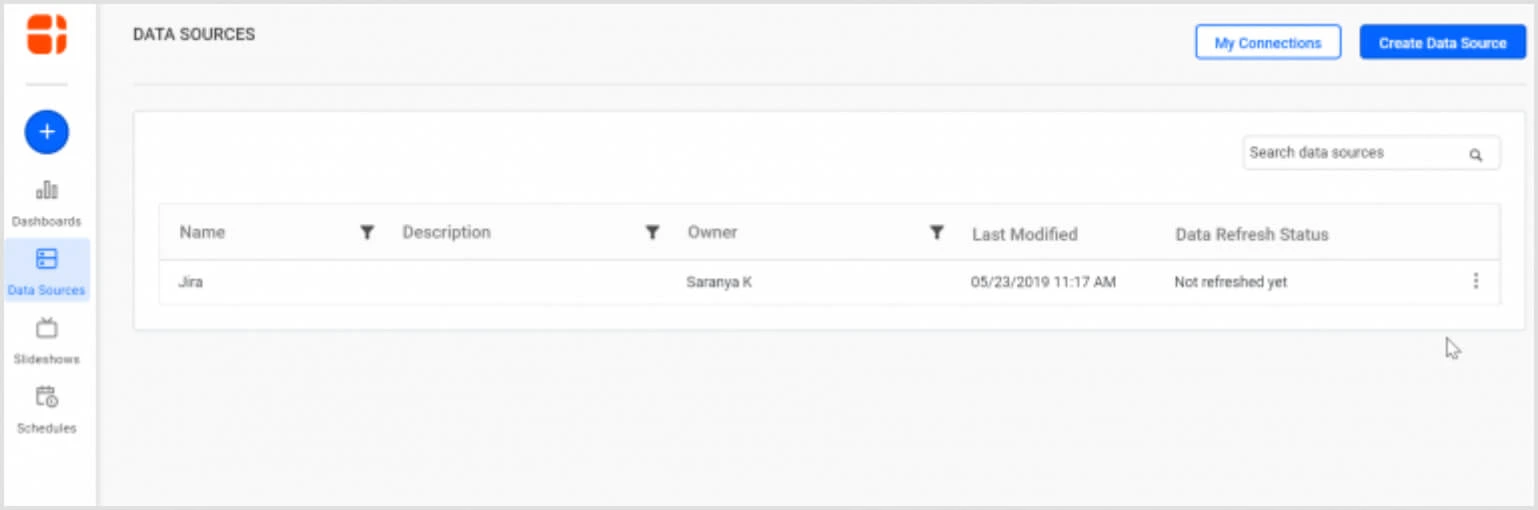
To connect your data, in the home page view, select Data Sources and then Create Data Source.
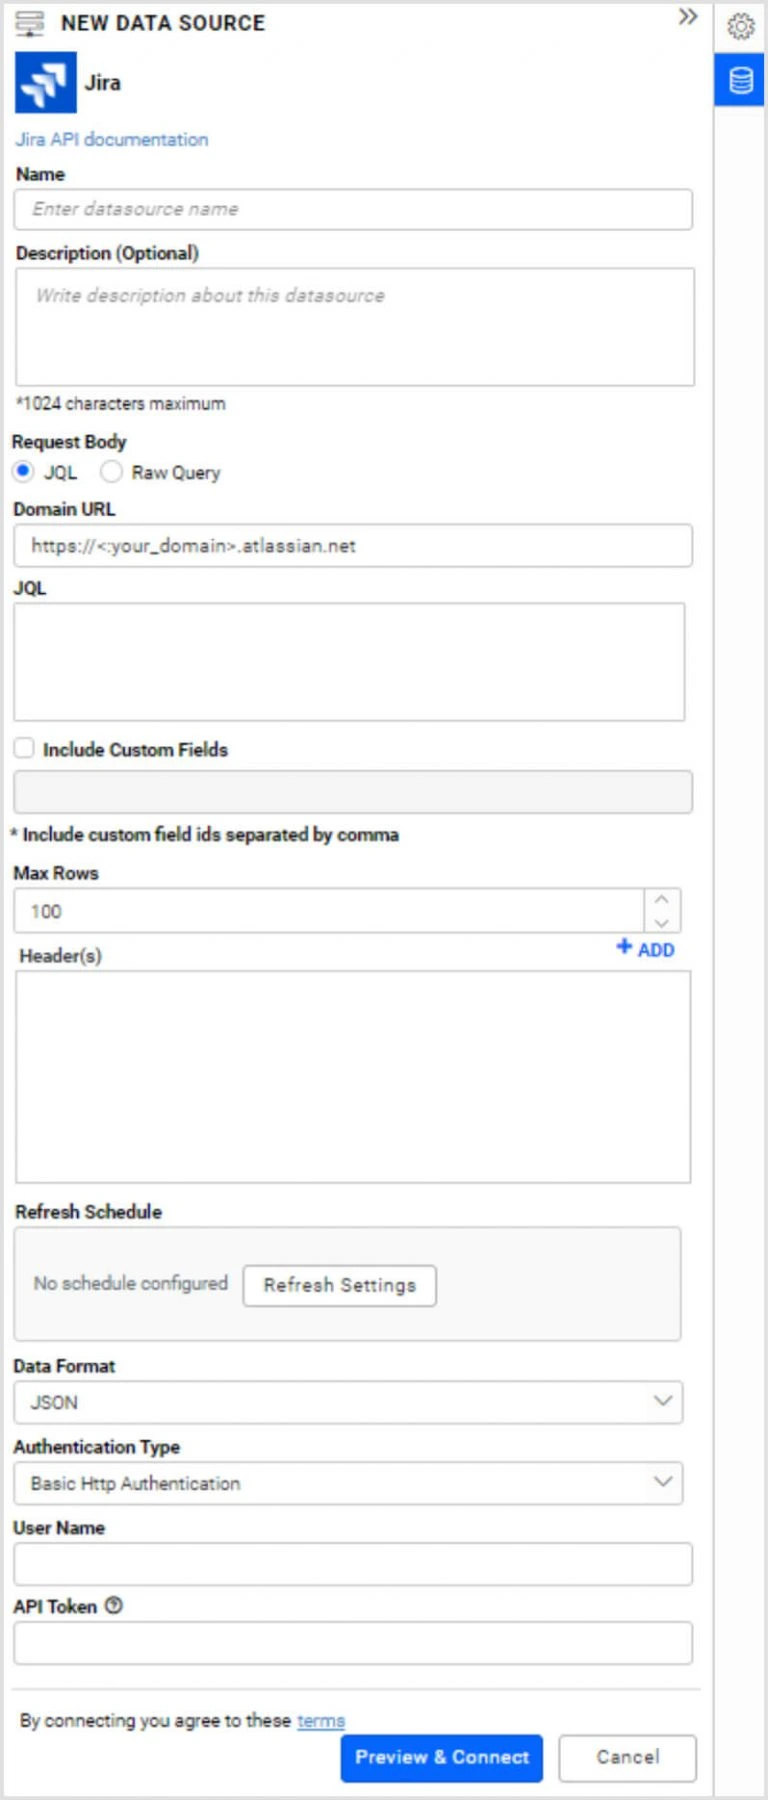
Choose the Jira icon. A Jira connection window will prompt like the following image.
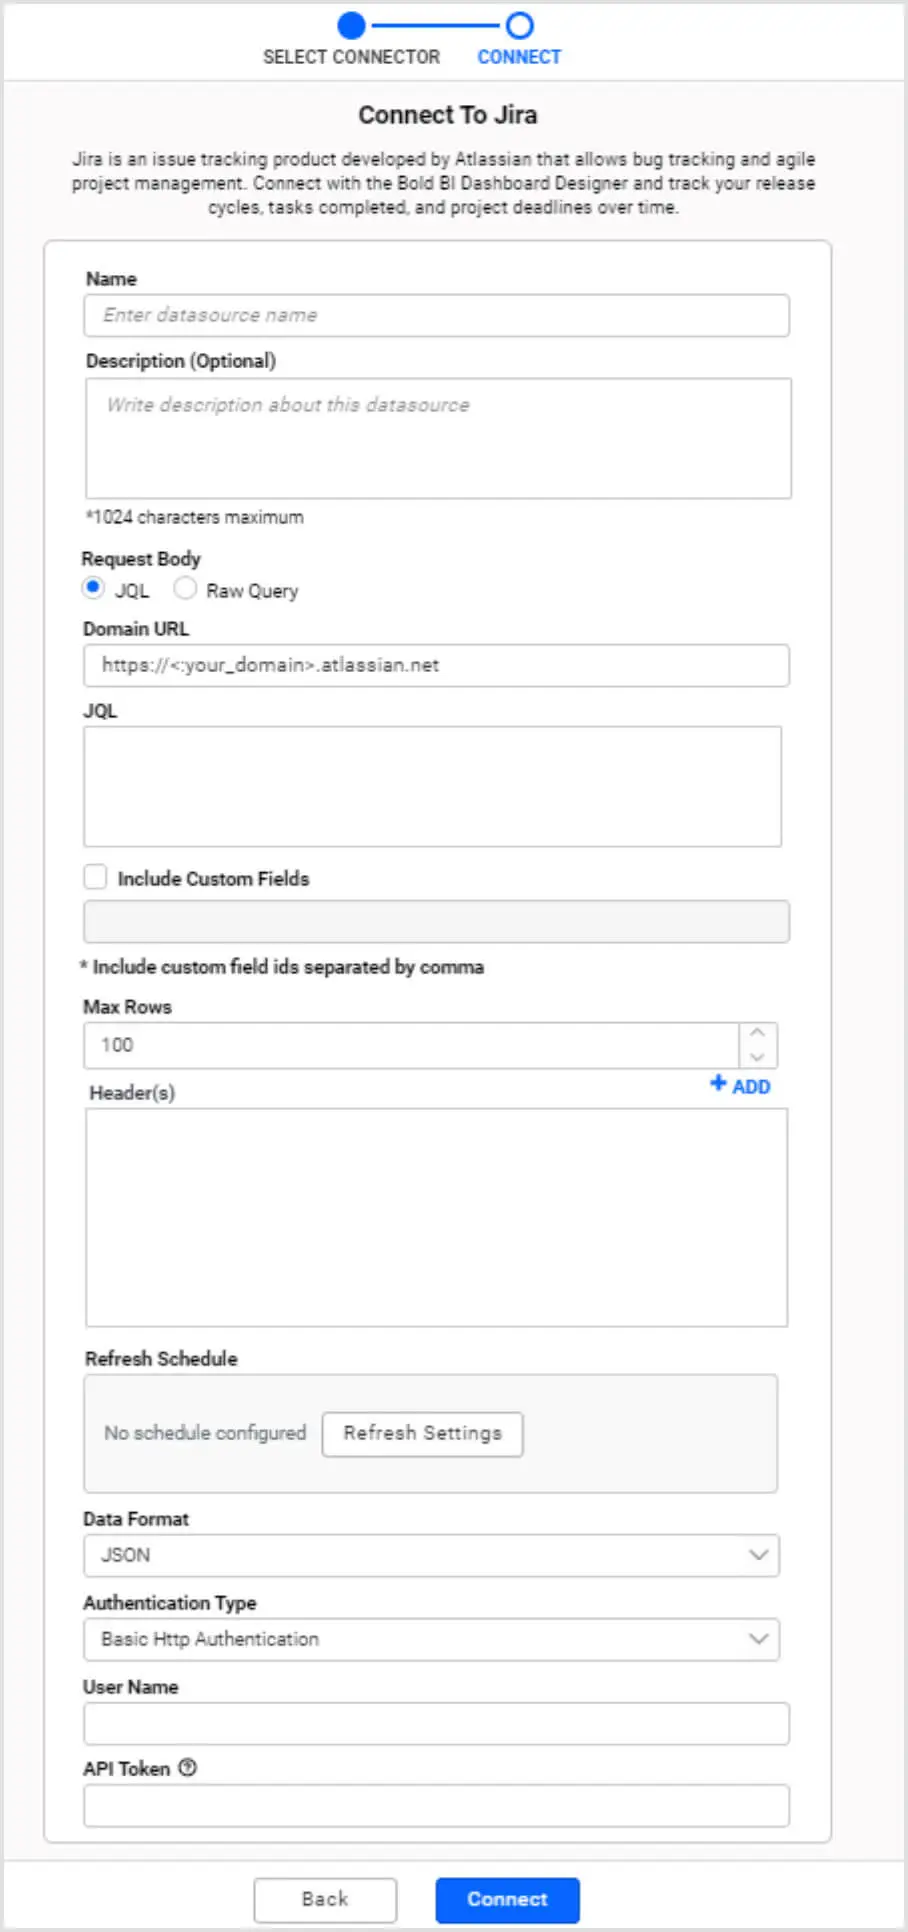
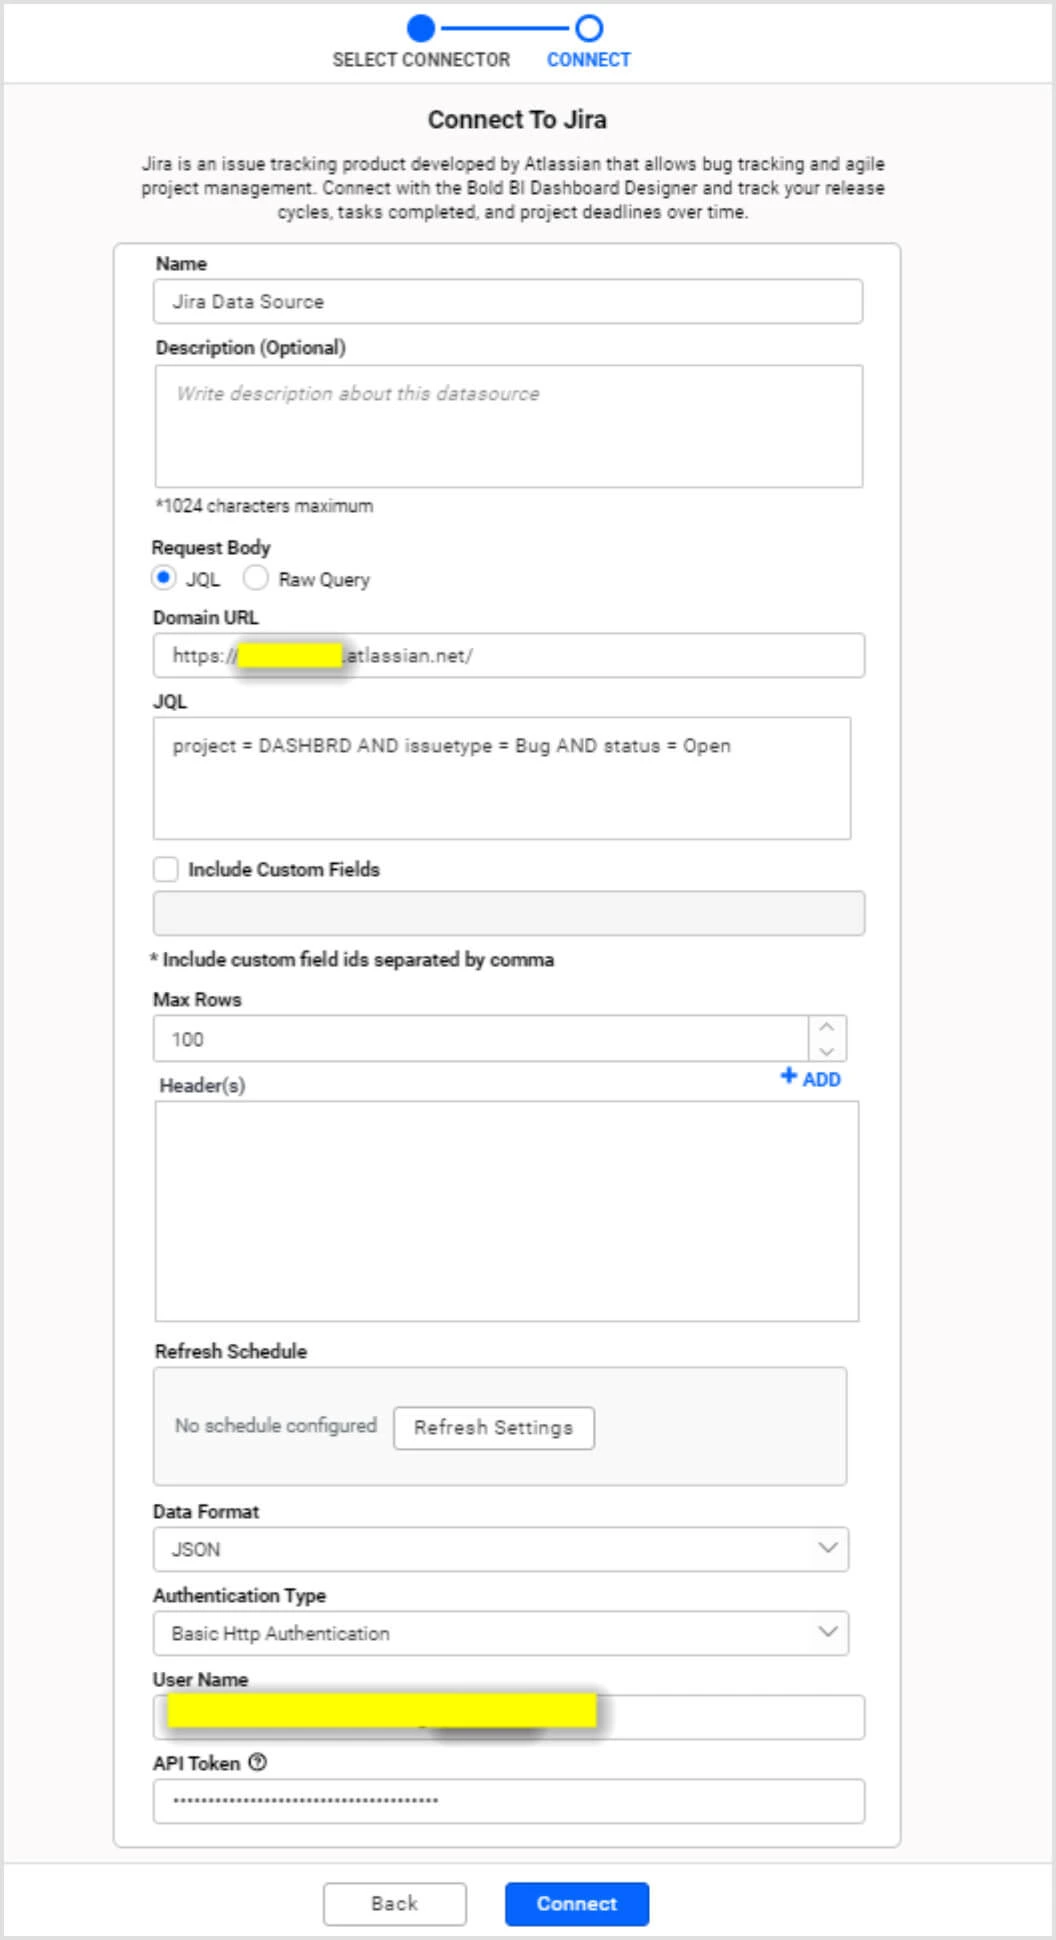
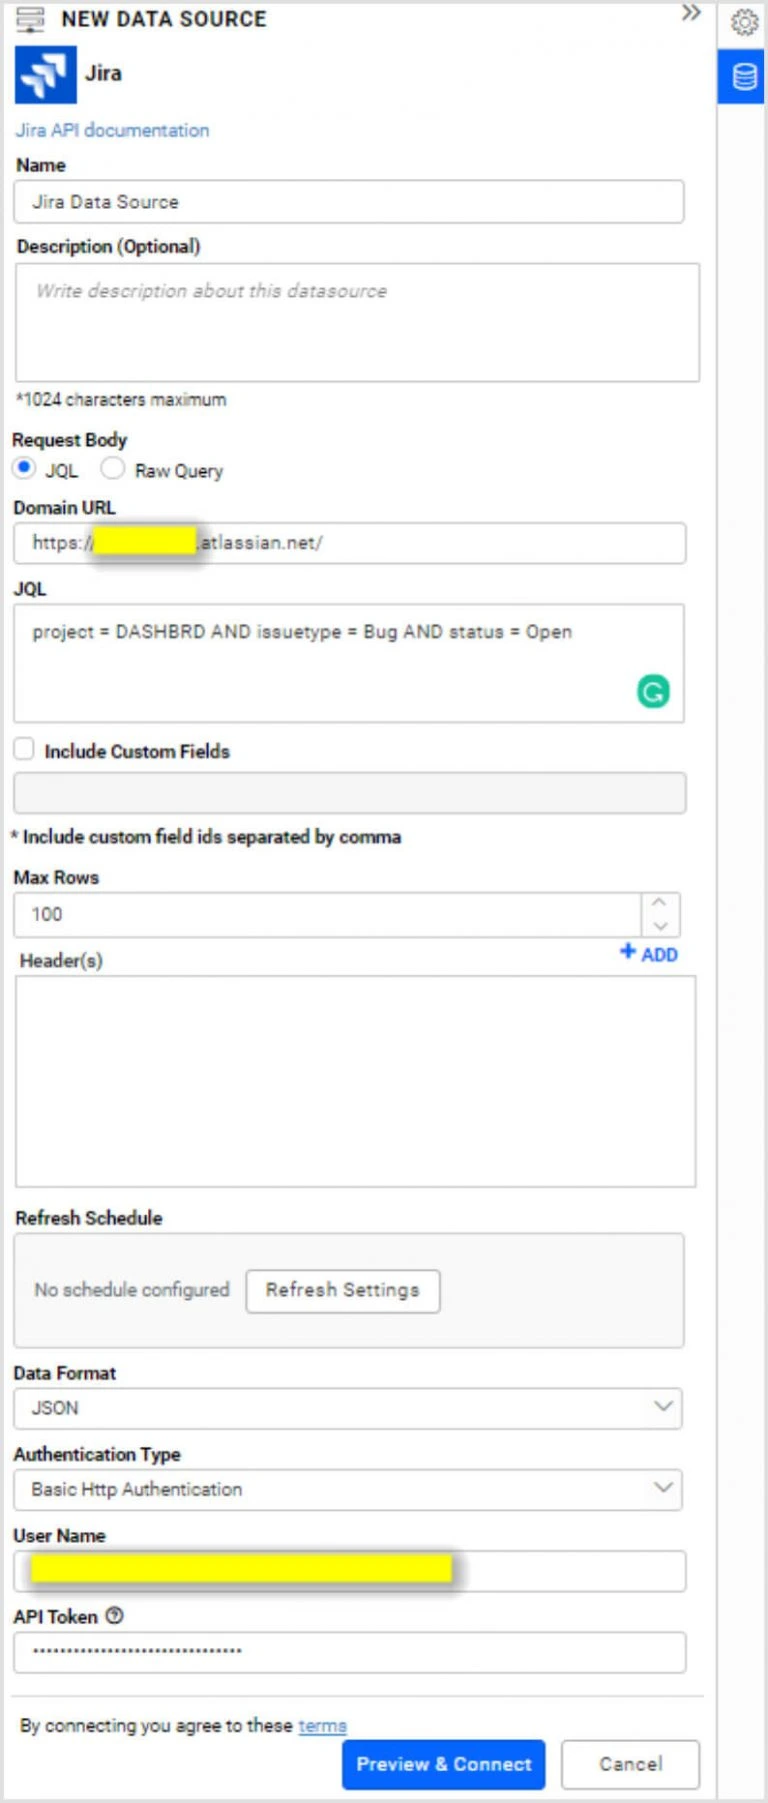
Provide a unique name for the data source and a description (optional). Enter your Jira domain URL, JQL or Raw Query, custom fields (if you have any) and Add authentication key and value under the Header(s) section (if you have any). Define the refresh settings to refresh the dashboard with the latest data updates on a schedule.
Set the data format of the result returned by the query from the Jira service. Set the authentication type, username, and API token for your Jira account.
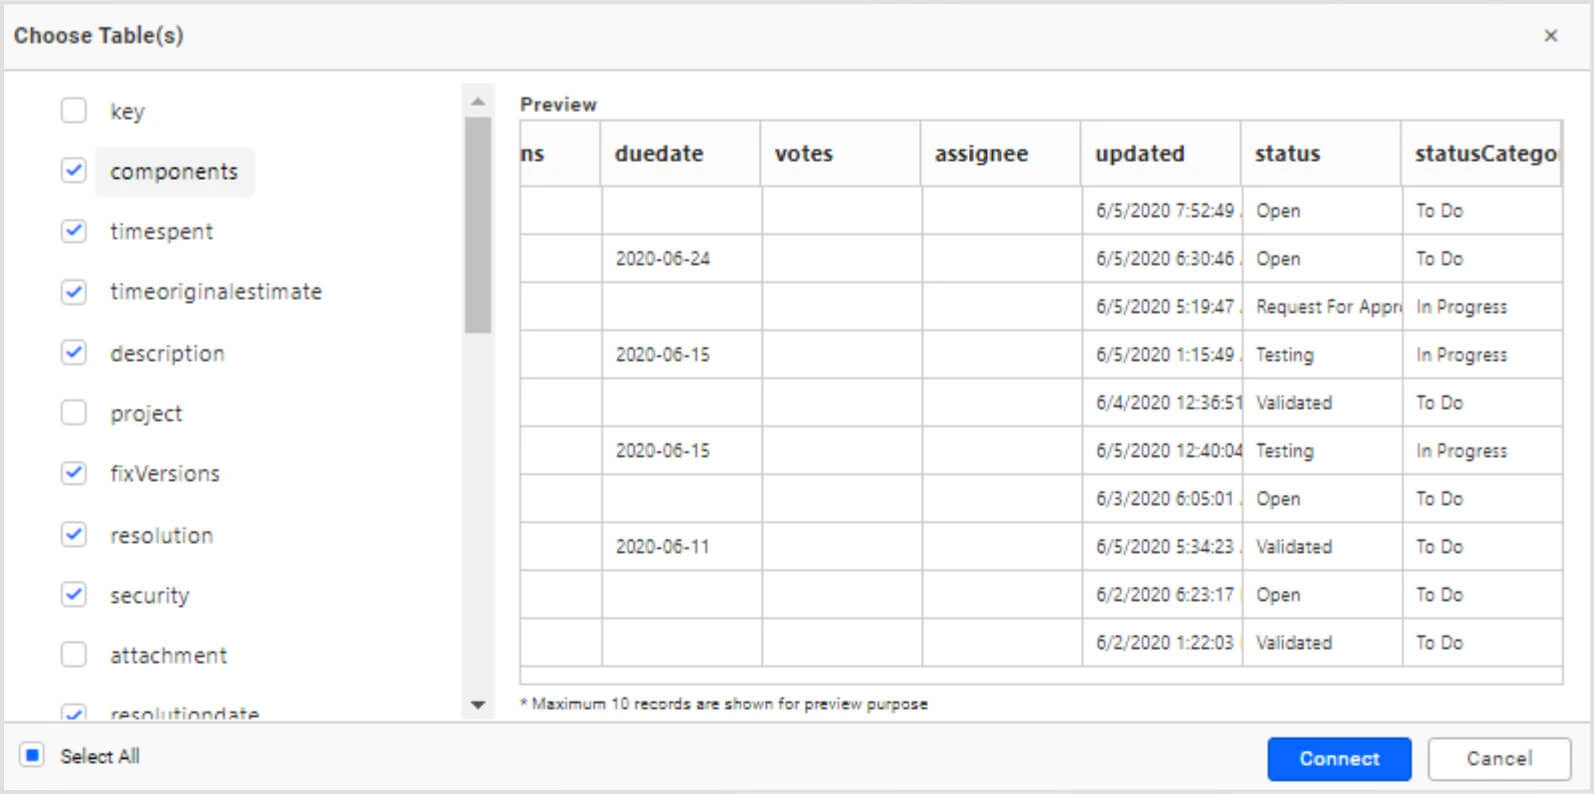
Select Preview & Connect. A window will open and display the data results, categorized into table columns.
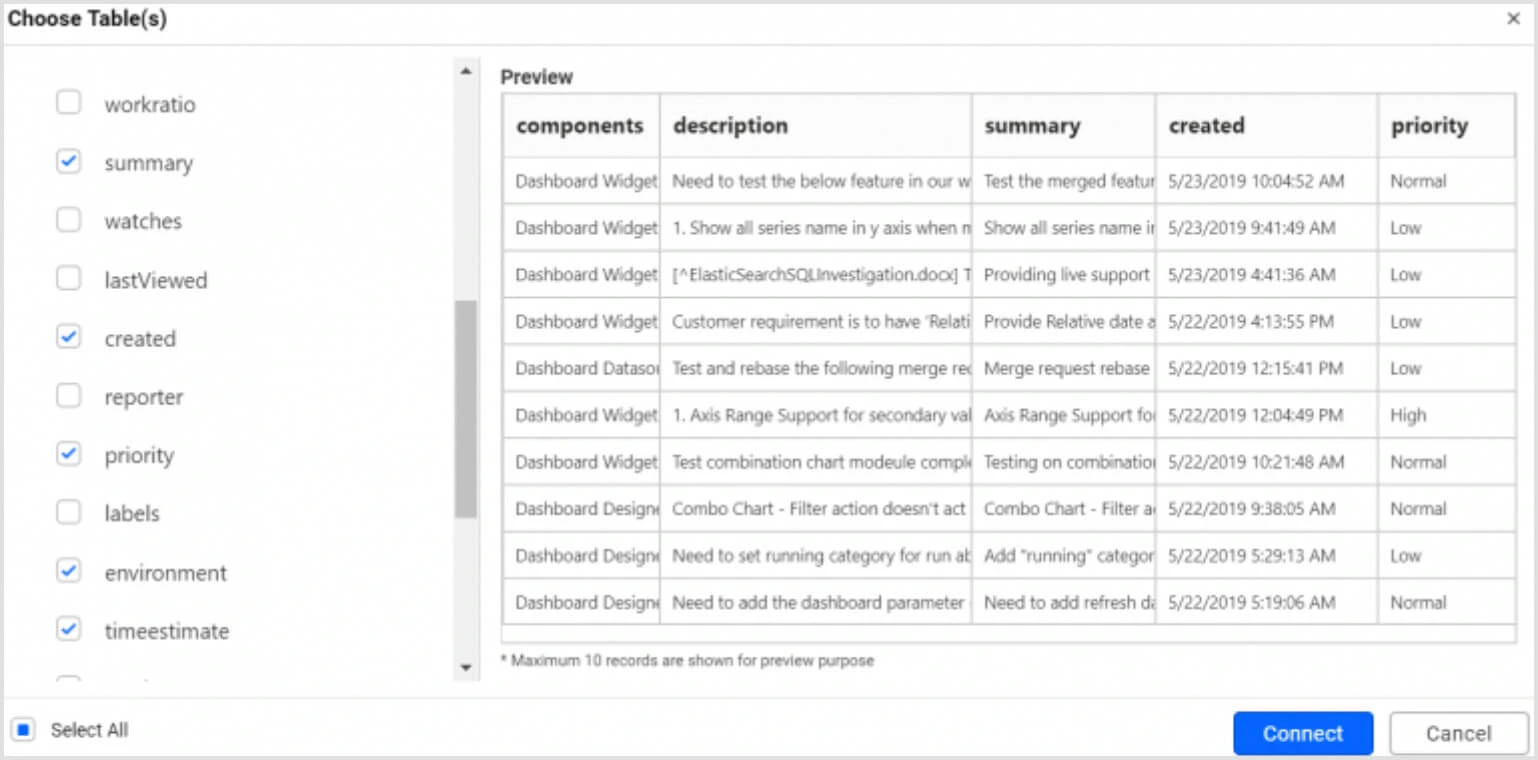
Choose the desired columns and select Connect to create a data source with them. Drag and drop the table and save data source by selecting Continue to Dashboard in the top-right corner menu.
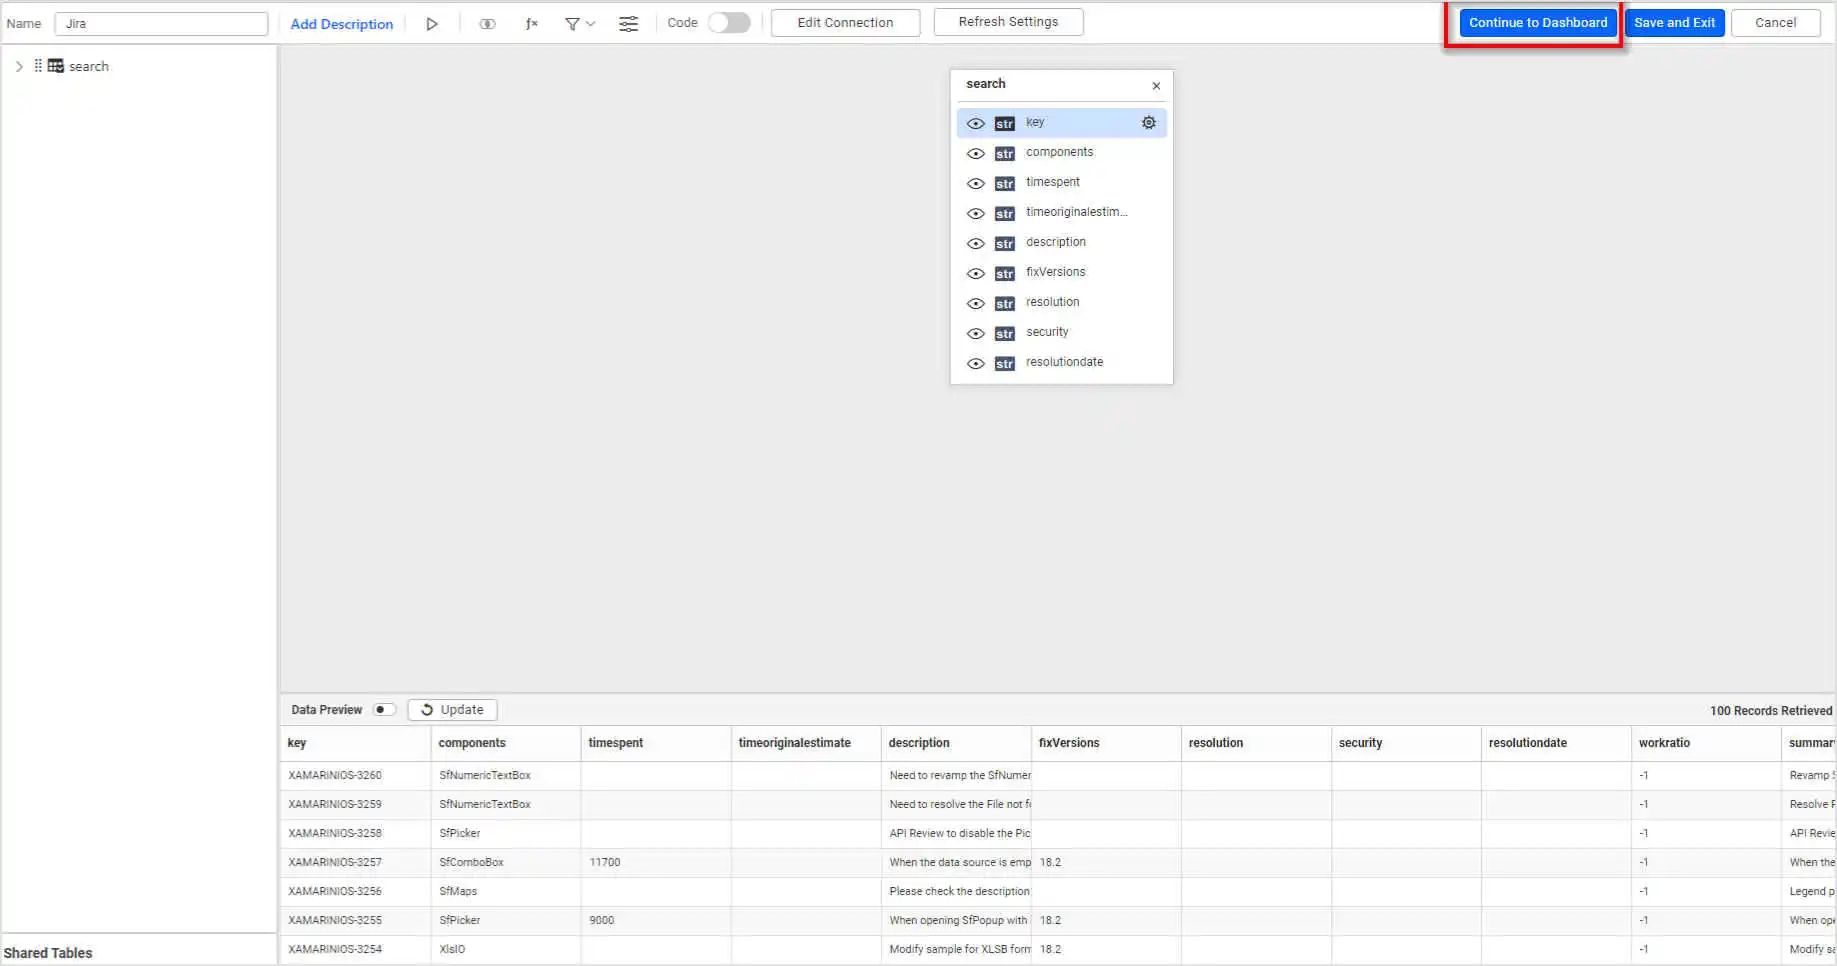
The designer page will load so you can proceed designing your new dashboard with this data source.
Starting with a blank dashboard and connecting to your Jira data
Navigate to the New Dashboard card on the home page and select the Add icon available in the left navigation bar.
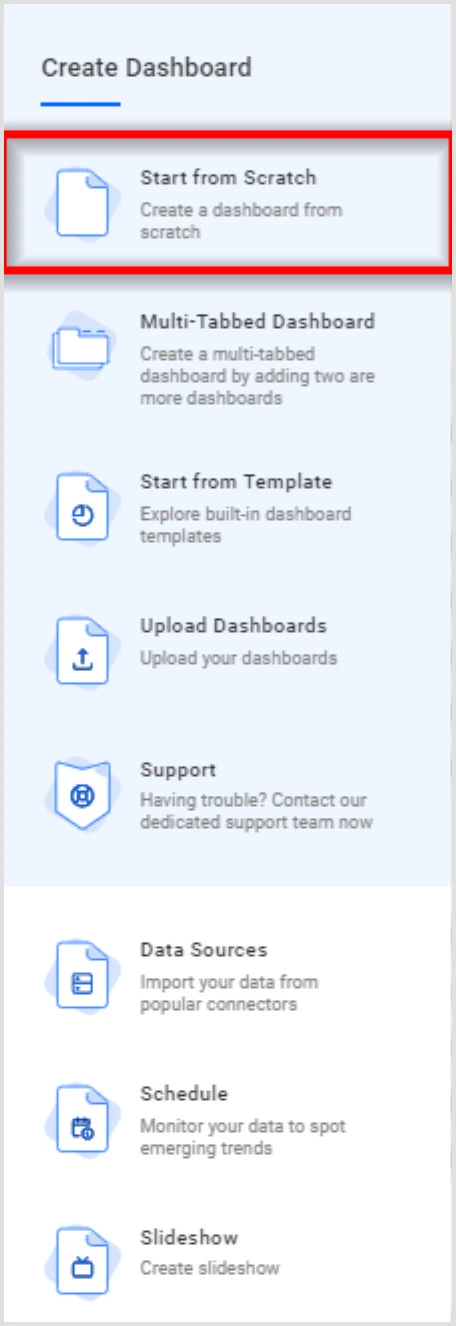
This opens a sliding panel with the following options for creating a dashboard. Click Start from Scratch.
The Start from Scratch window opens.
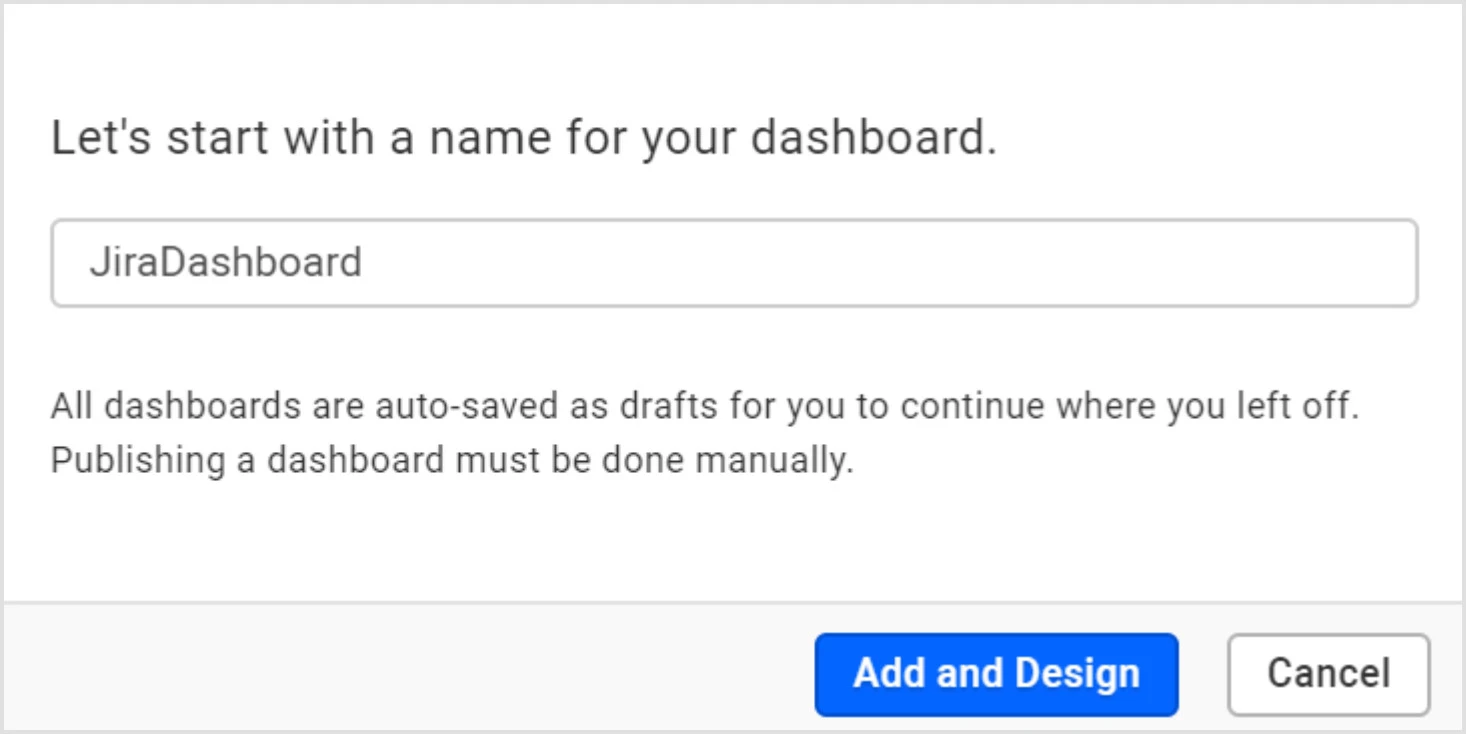
Enter a name and select Add and Design. The Dashboard Designer page opens with a new blank dashboard.
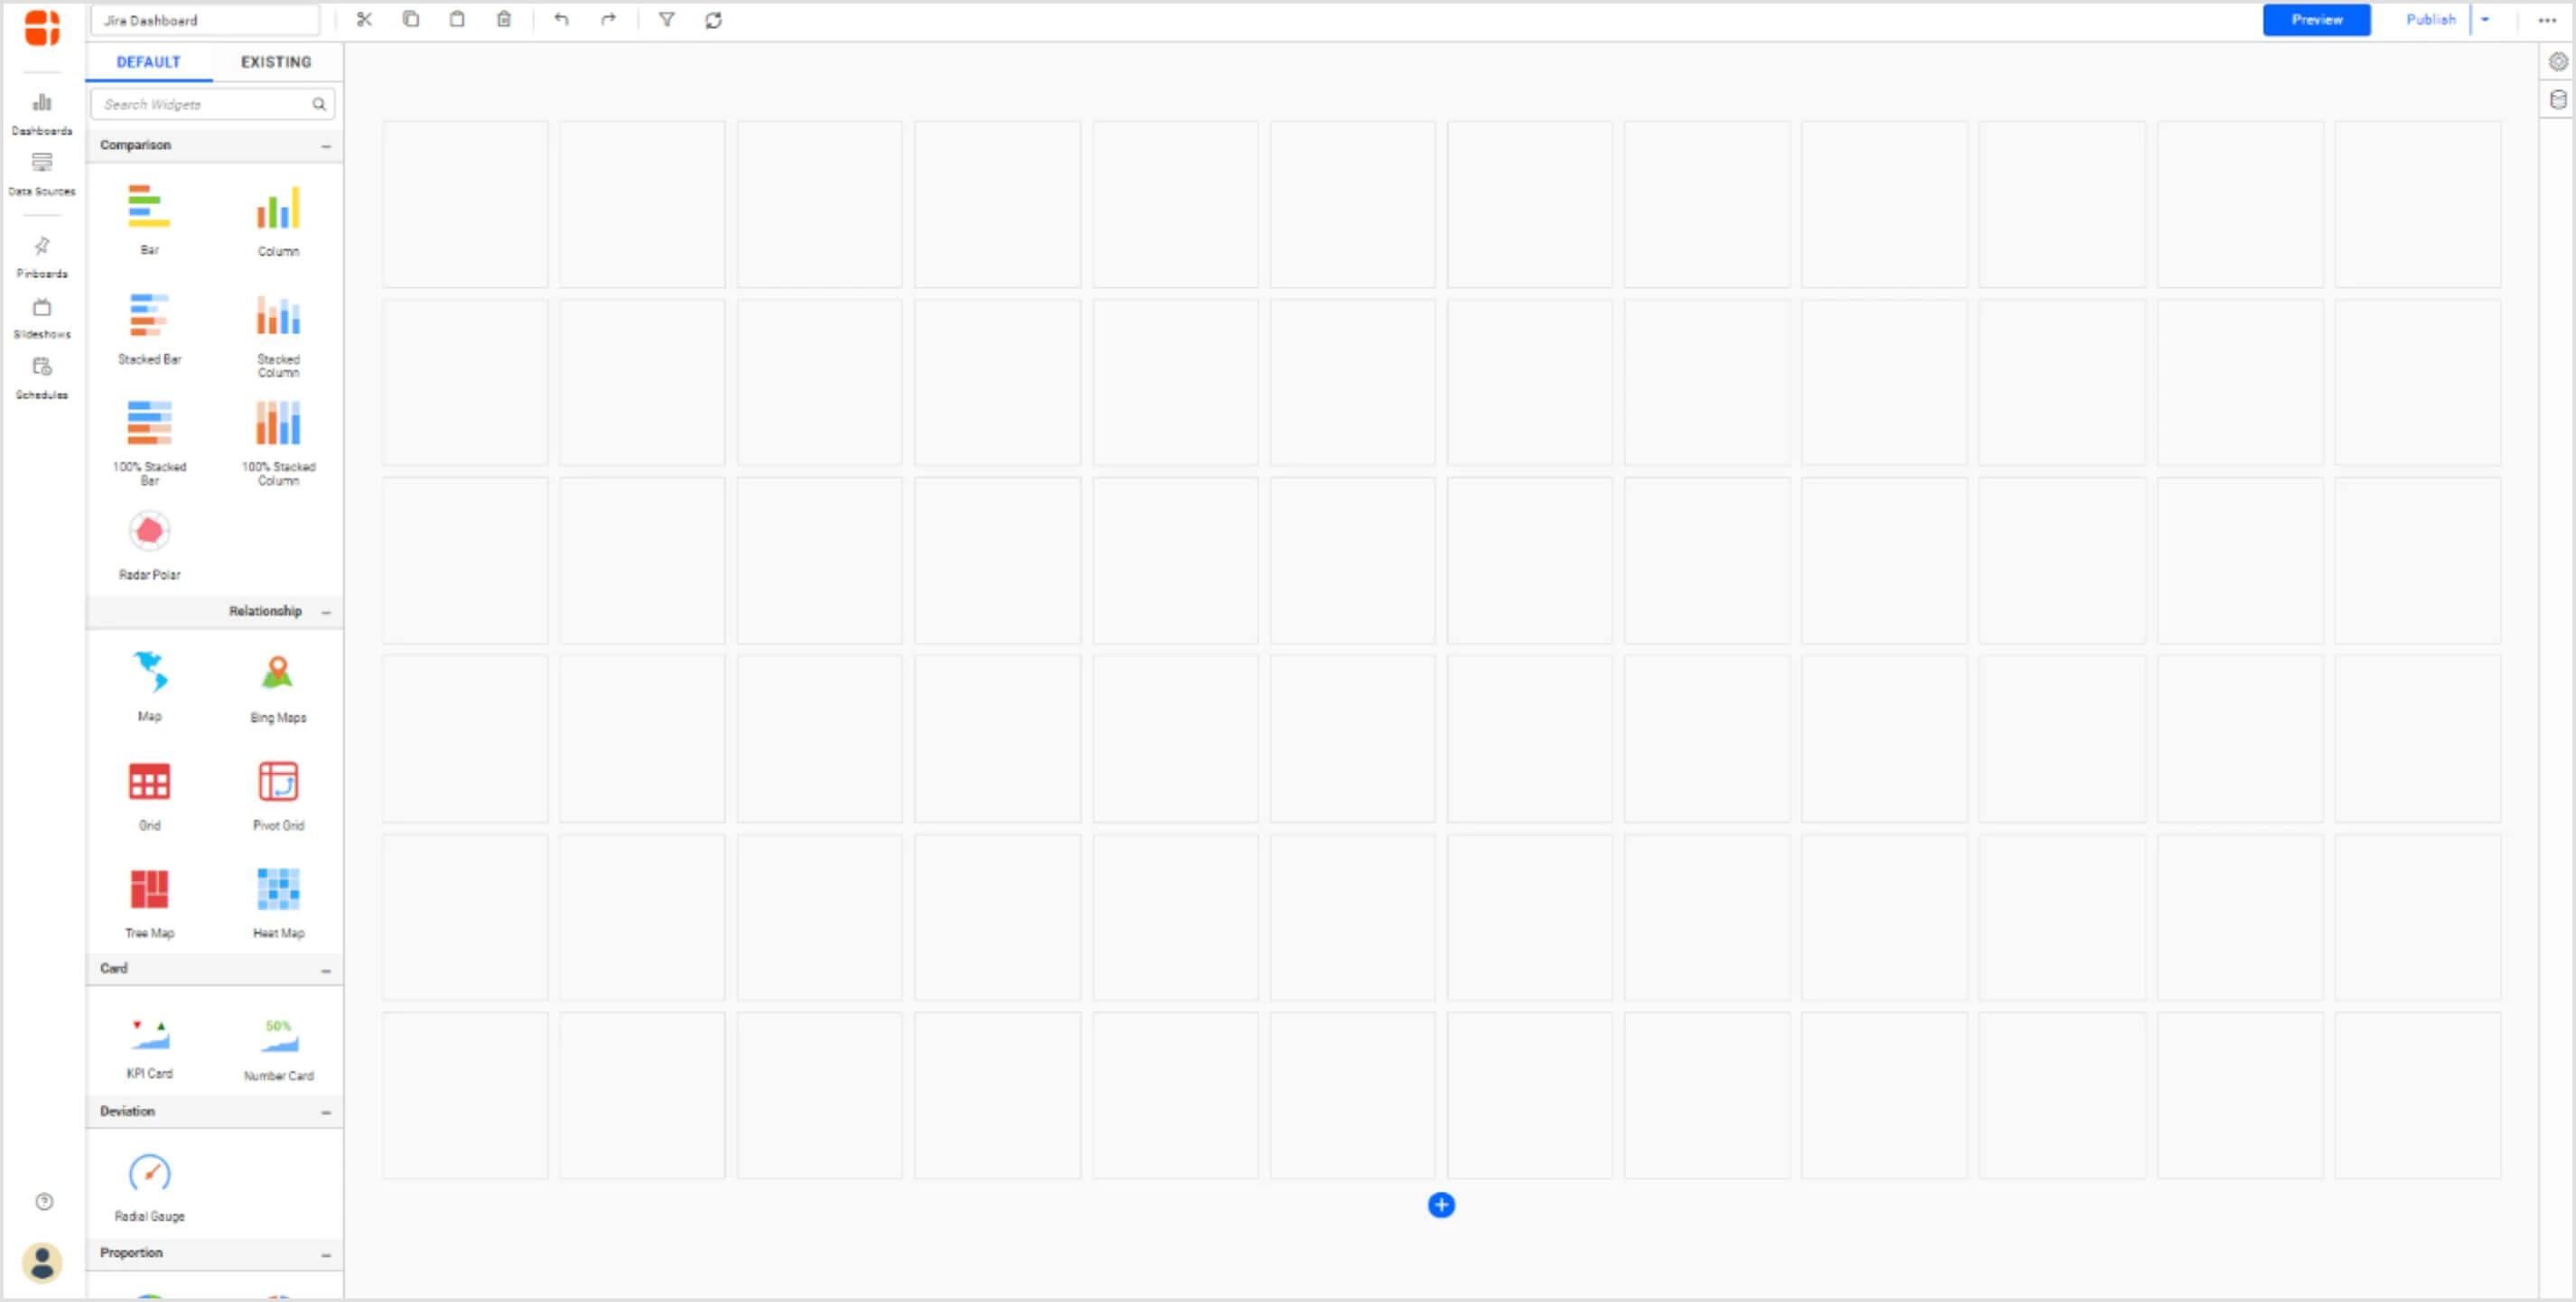
To create a new data source with a Jira data connection, select the data source icon on the right. Doing so will expand the data source panel.
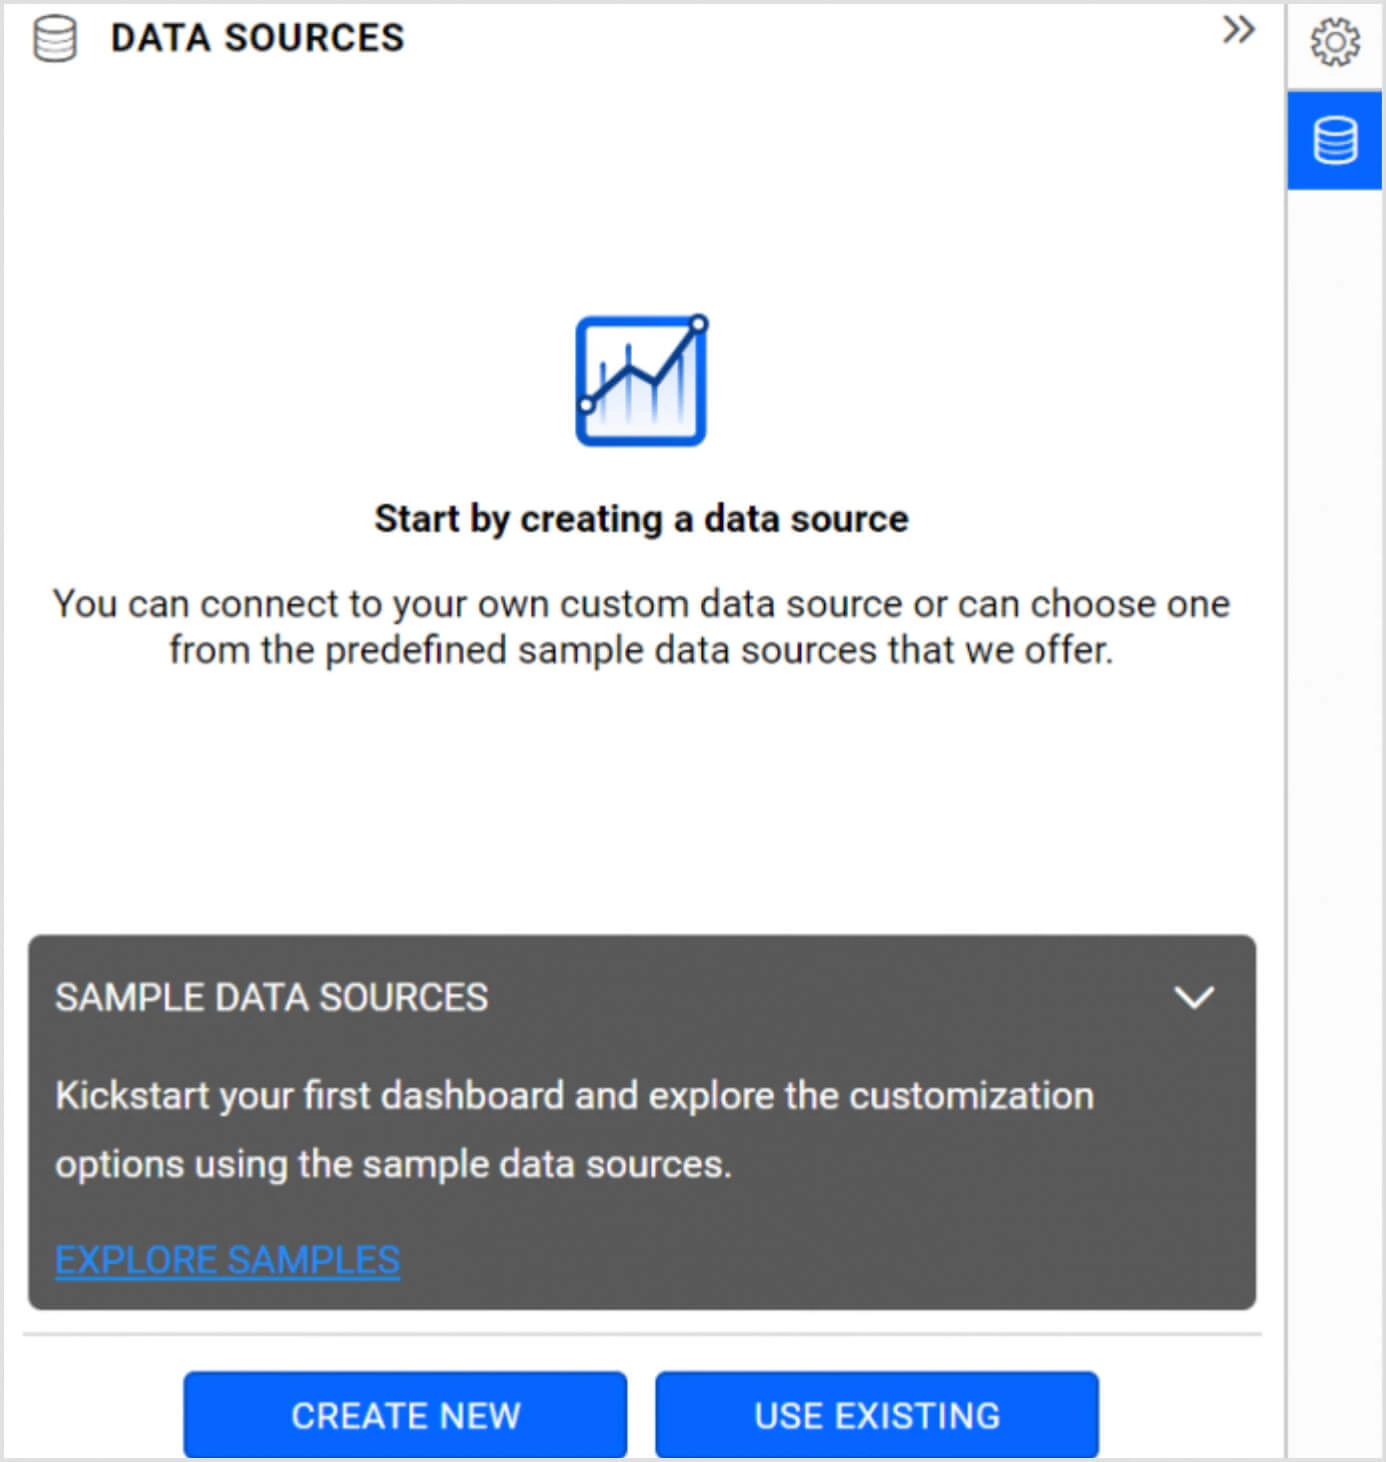
Create a data source through any one of the following ways:
Creating a new data source connection from scratch
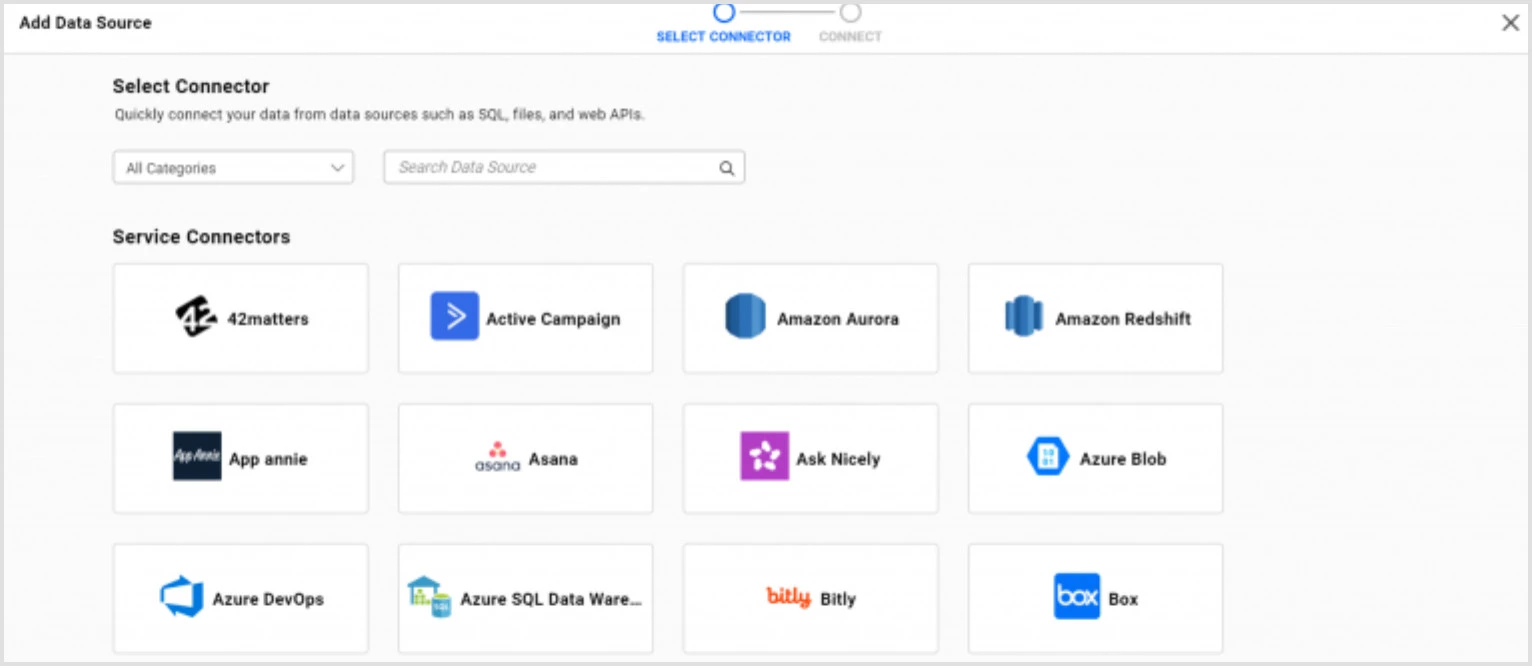
To create a new data source connection from scratch, select CREATE NEW in the panel. The DATA SOURCES panel lists the data connectors as shown in the following screenshot.
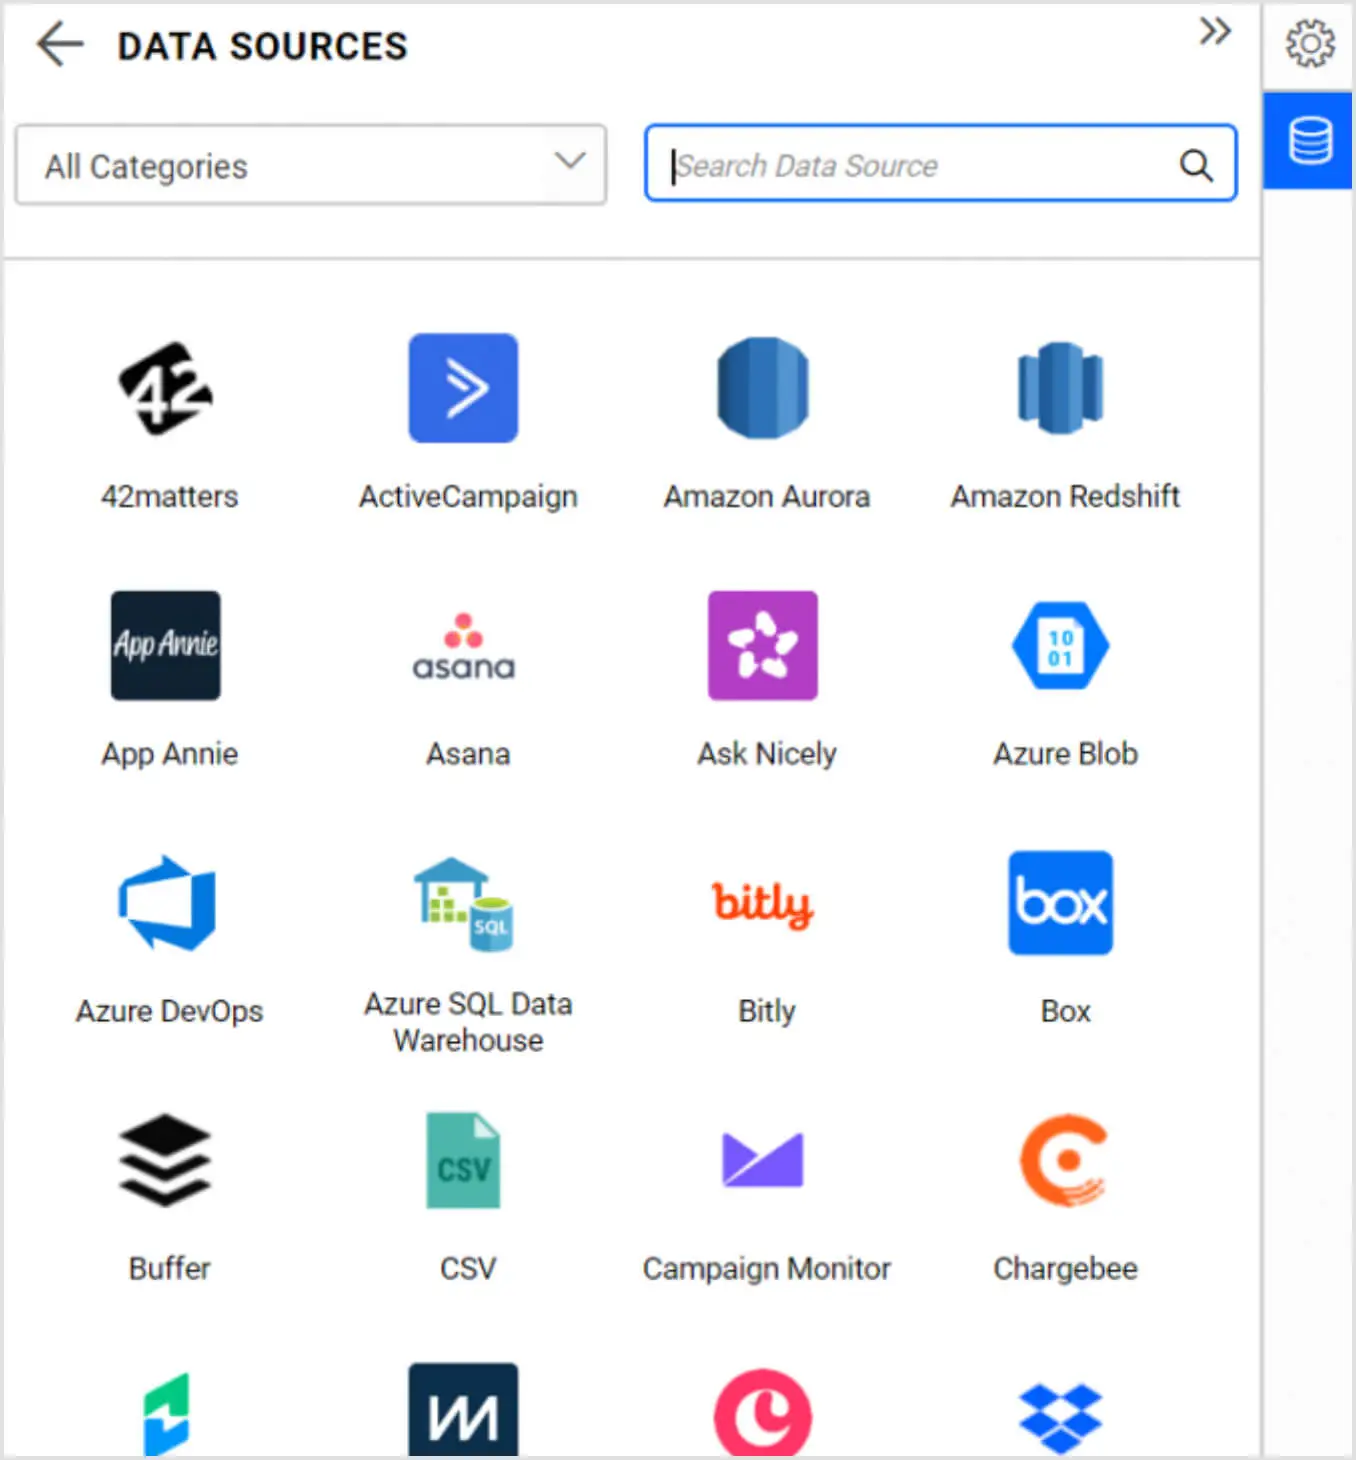
To more easily discover the Jira connectors in this list, choose the category Project Management.
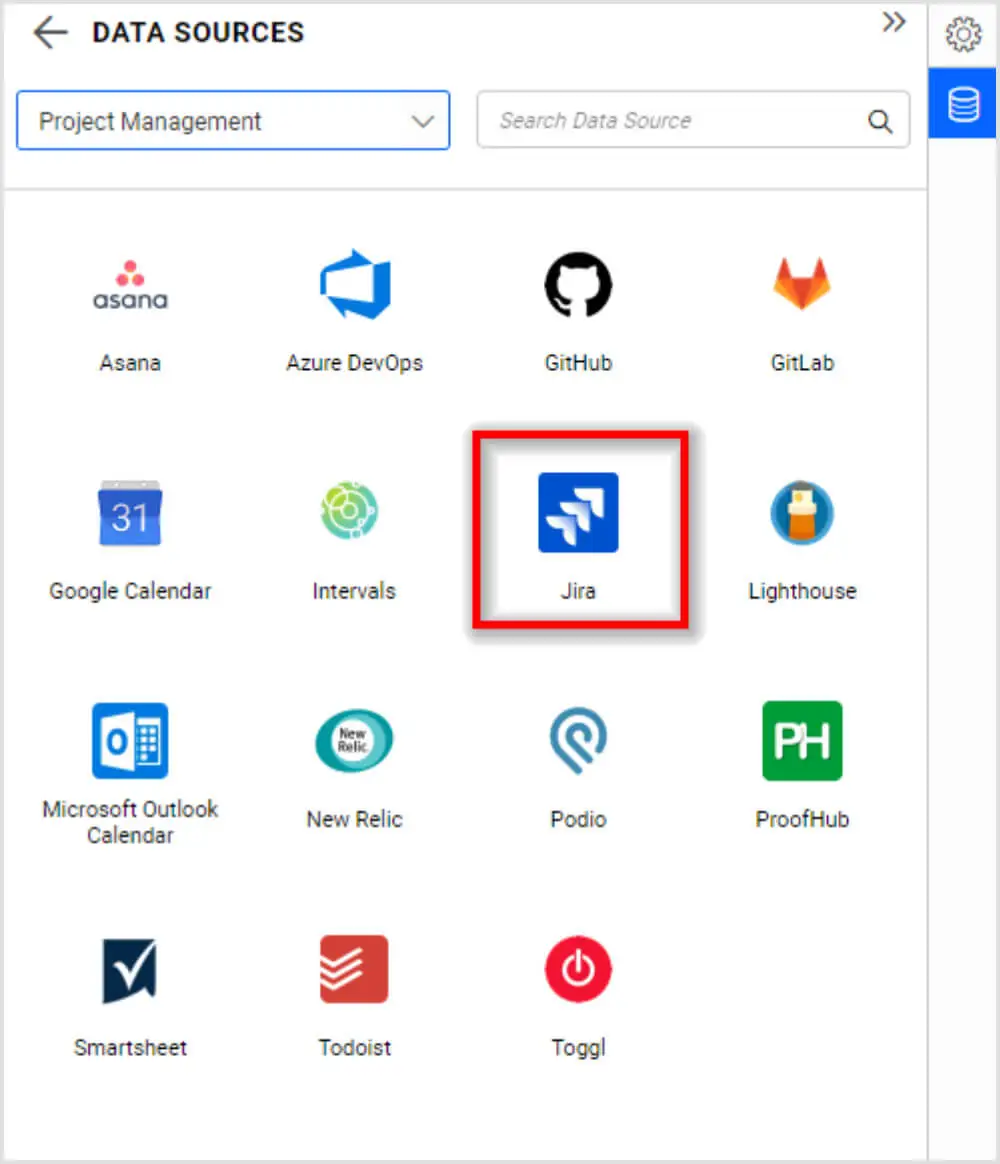
Choose the Jira connector. The Jira data connection window will be displayed.
Provide the required details as done earlier in the Jira connection window.
Select Preview & Connect to get a window listing the data results categorized into table columns.
Choose the needed columns and click Connect to create a data source with selected table and columns.

Drag and drop the table, perform data modeling operations like column type conversion, column renaming, and column hiding, and save the data source by selecting Save in the top-right corner menu.
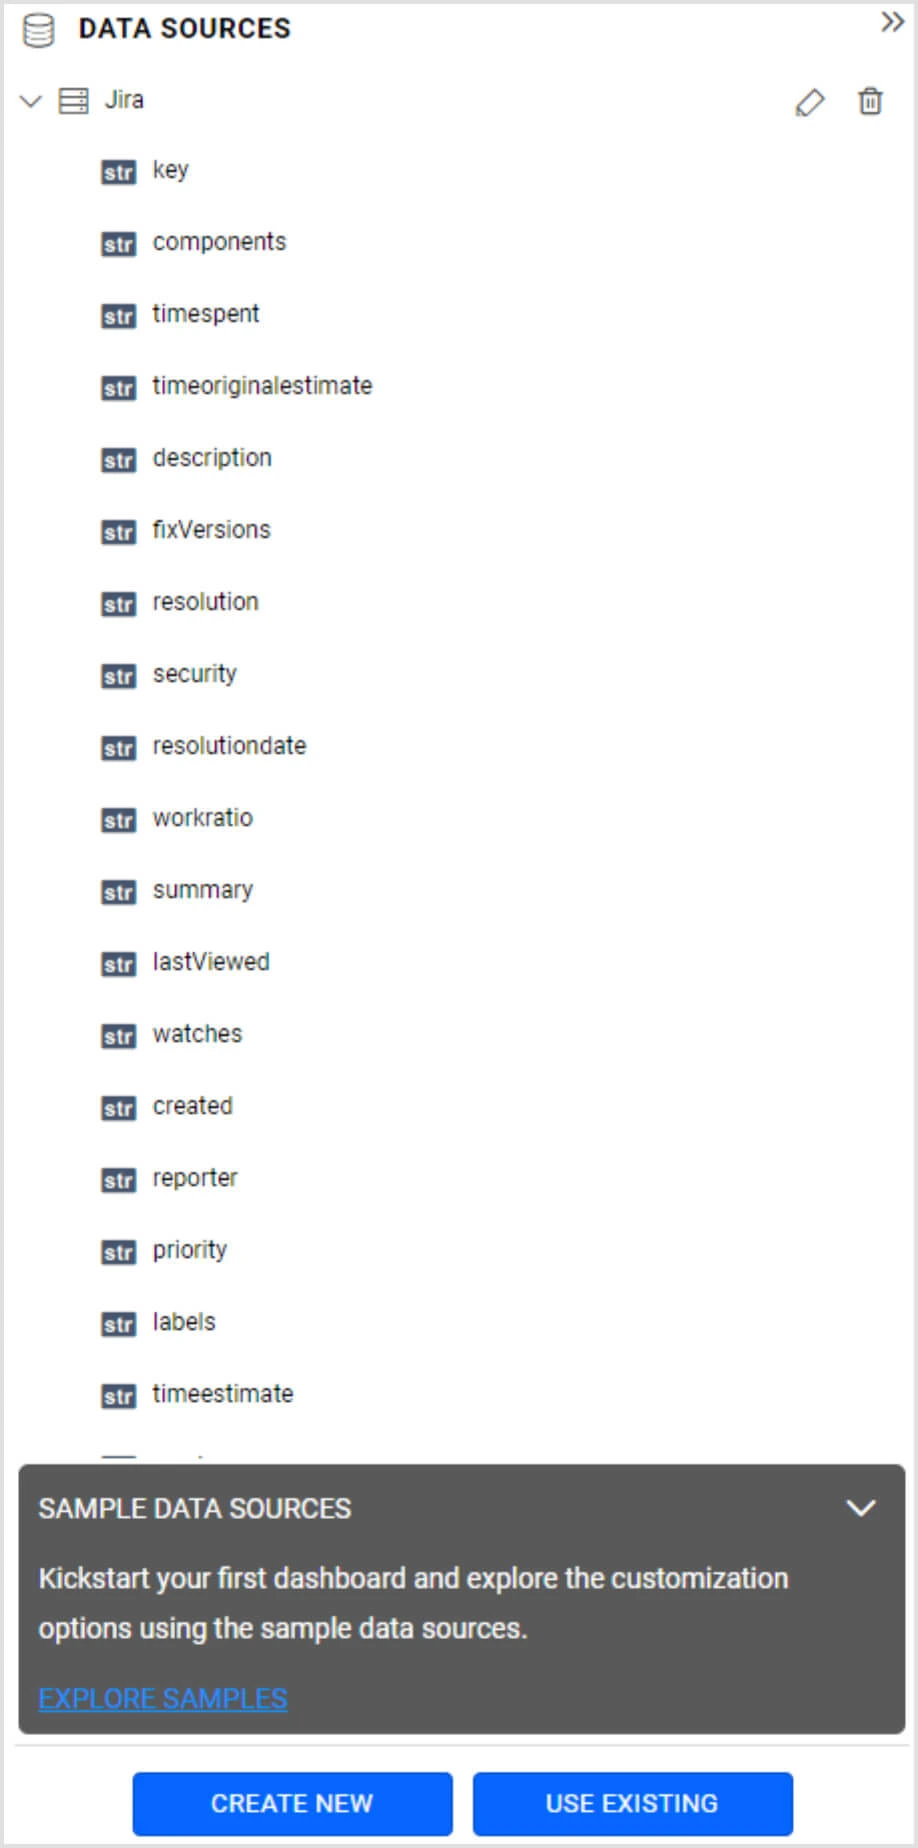
The Data Sources panel lists the created data source in the dashboard design view as shown in the following screenshot.
Creating new data source from existing or shared data sources
Find existing or shared data sources:
Navigating through the URL
With the URL, https://<your-site-name>>/bi/en-us/data-sources, you can access all shared or previously created data sources. You can also navigate to this page by selecting the Data Sources icon (highlighted below) in the left-side panel.
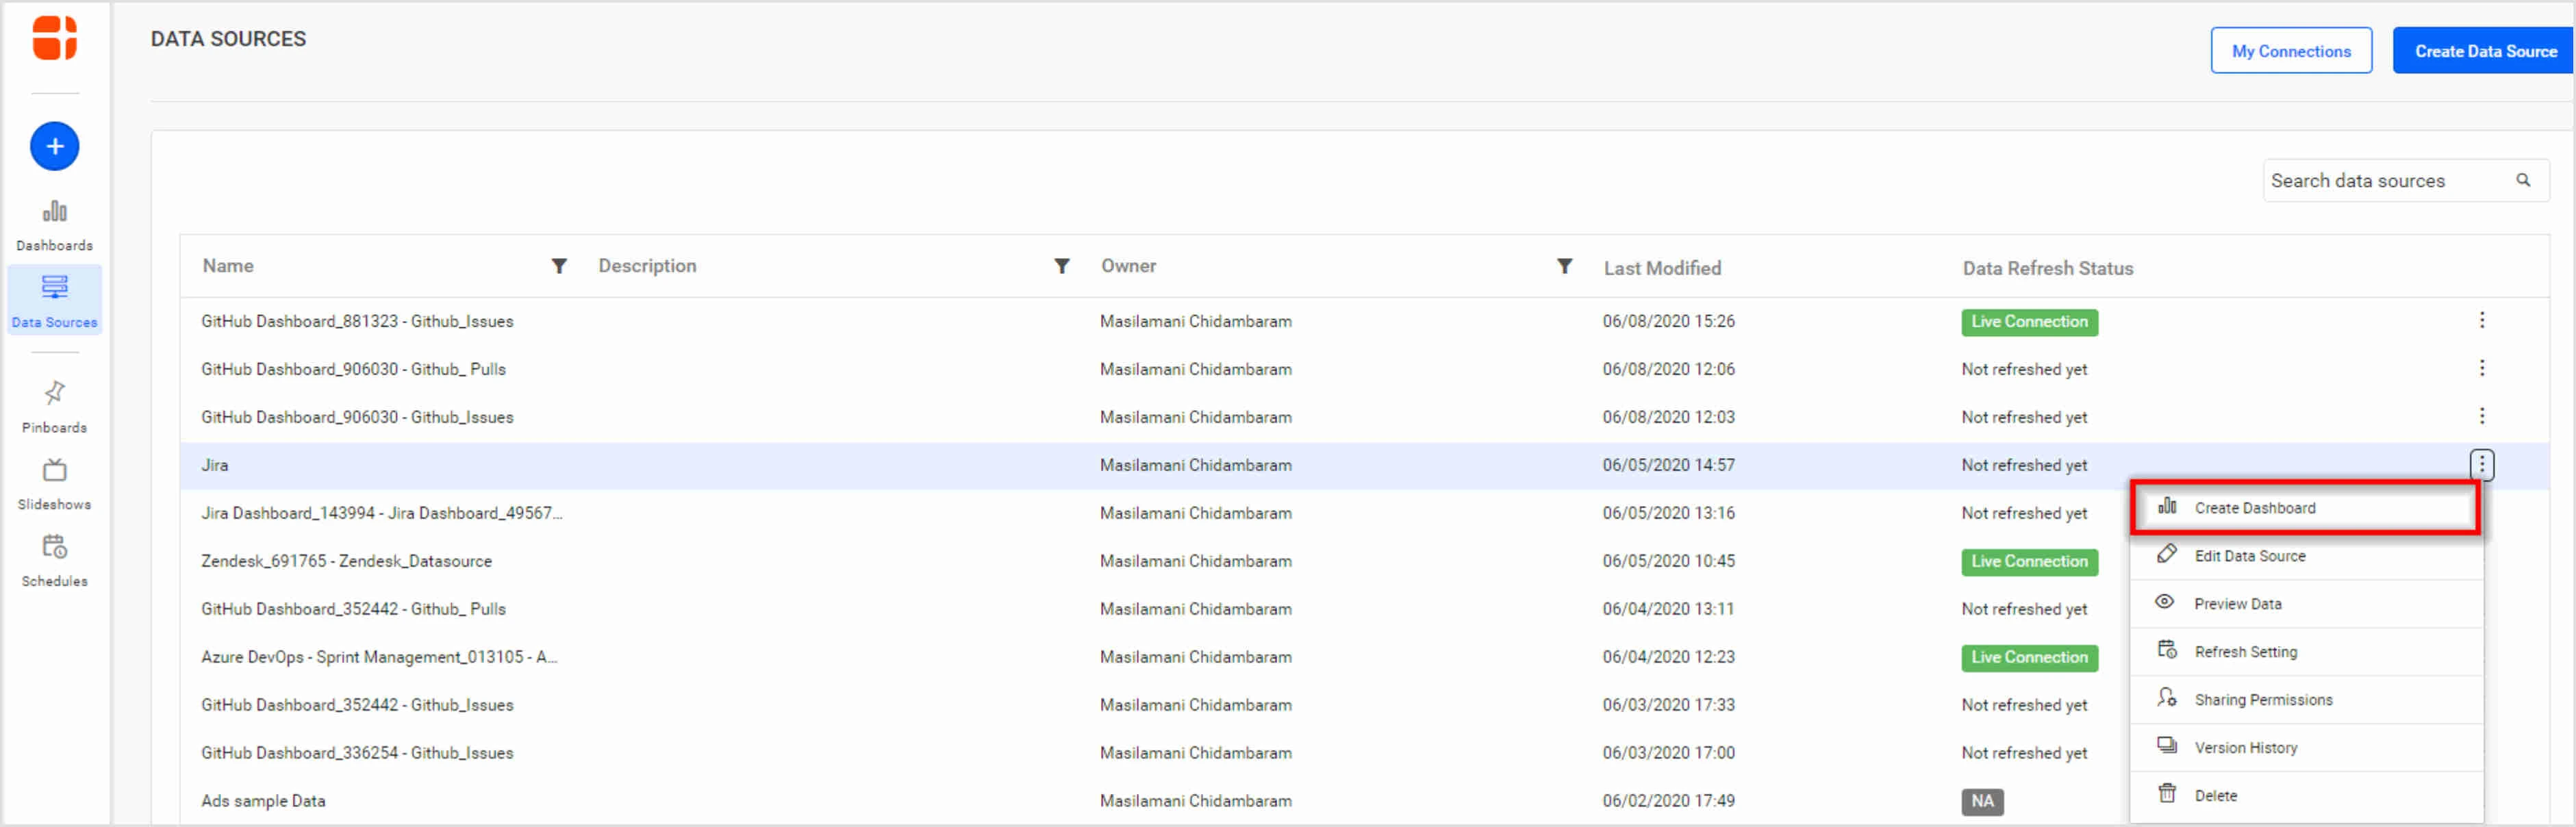
From this view, you can also create a new blank dashboard with a data source chosen through the menu option available.
Data sources listing
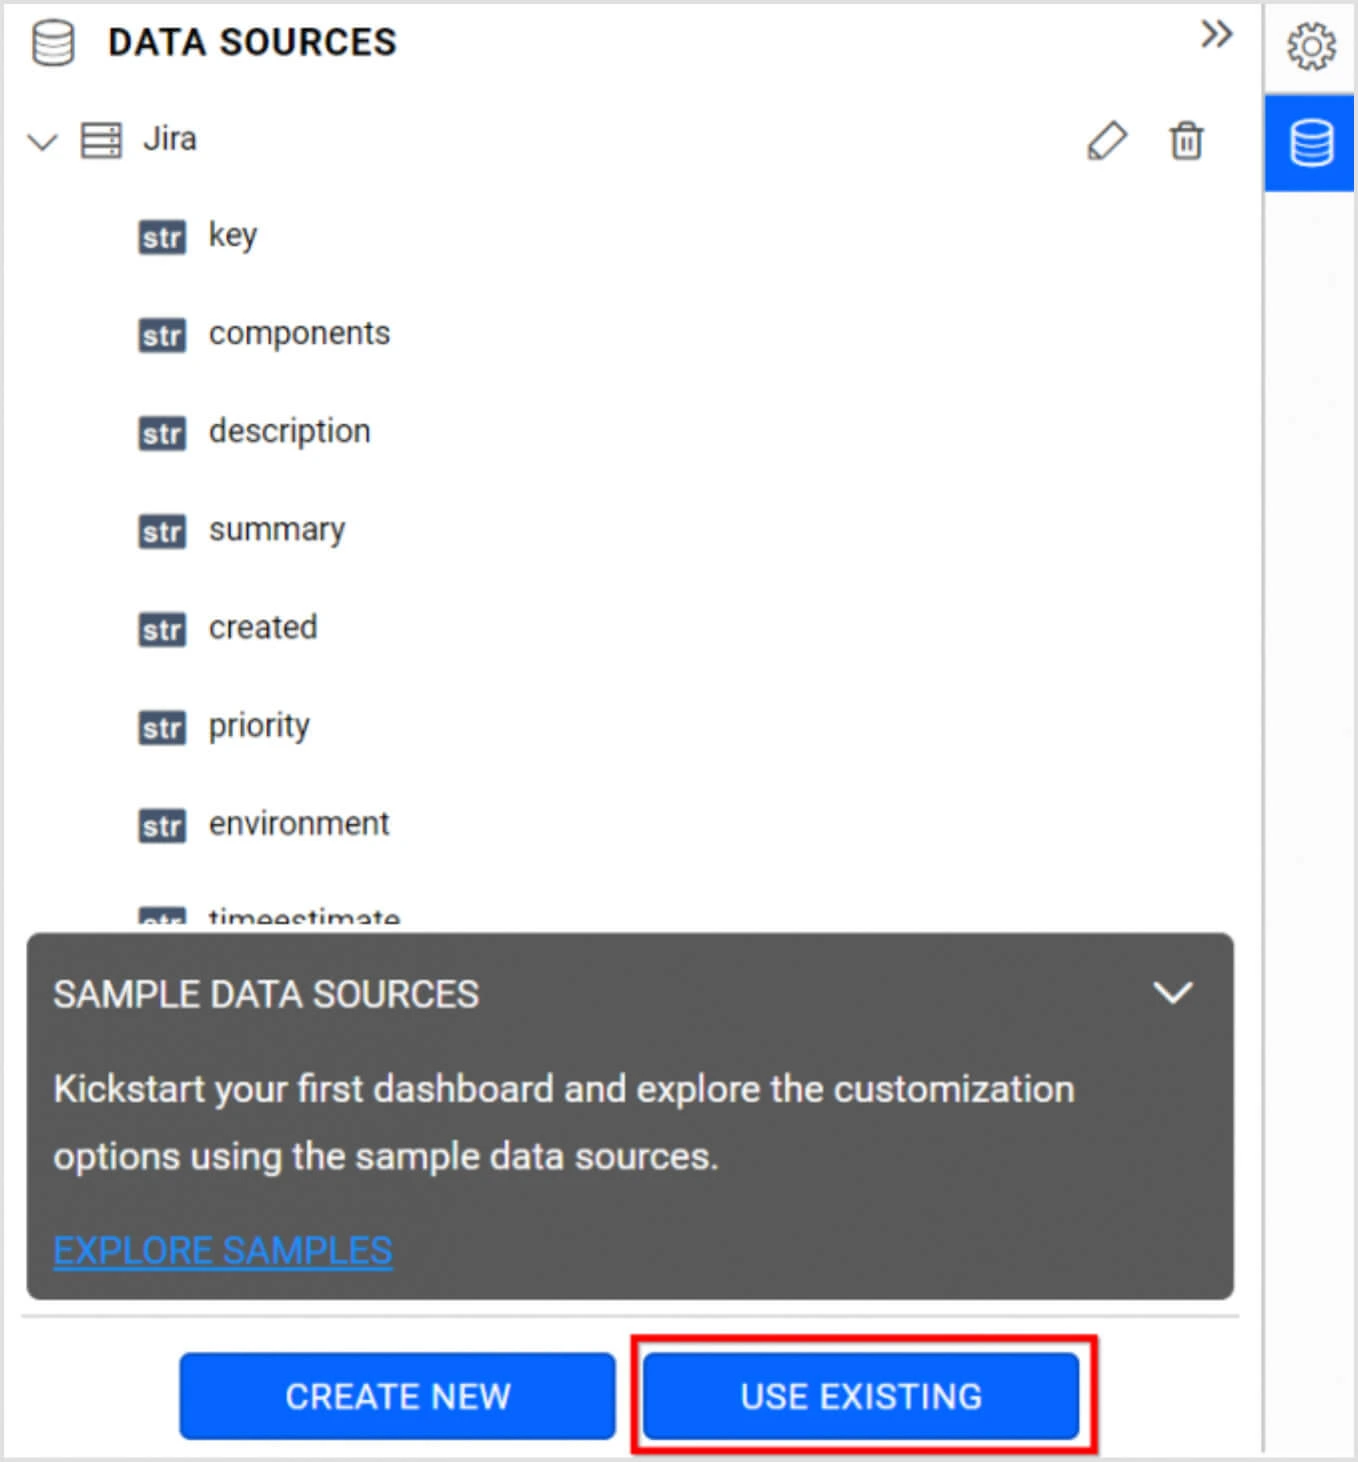
The data sources listing exists in the dashboard design page in the right-side panel. Select Use Existing at the bottom of this panel to navigate to the already-created or shared data sources.
The panel shows the existing data sources.
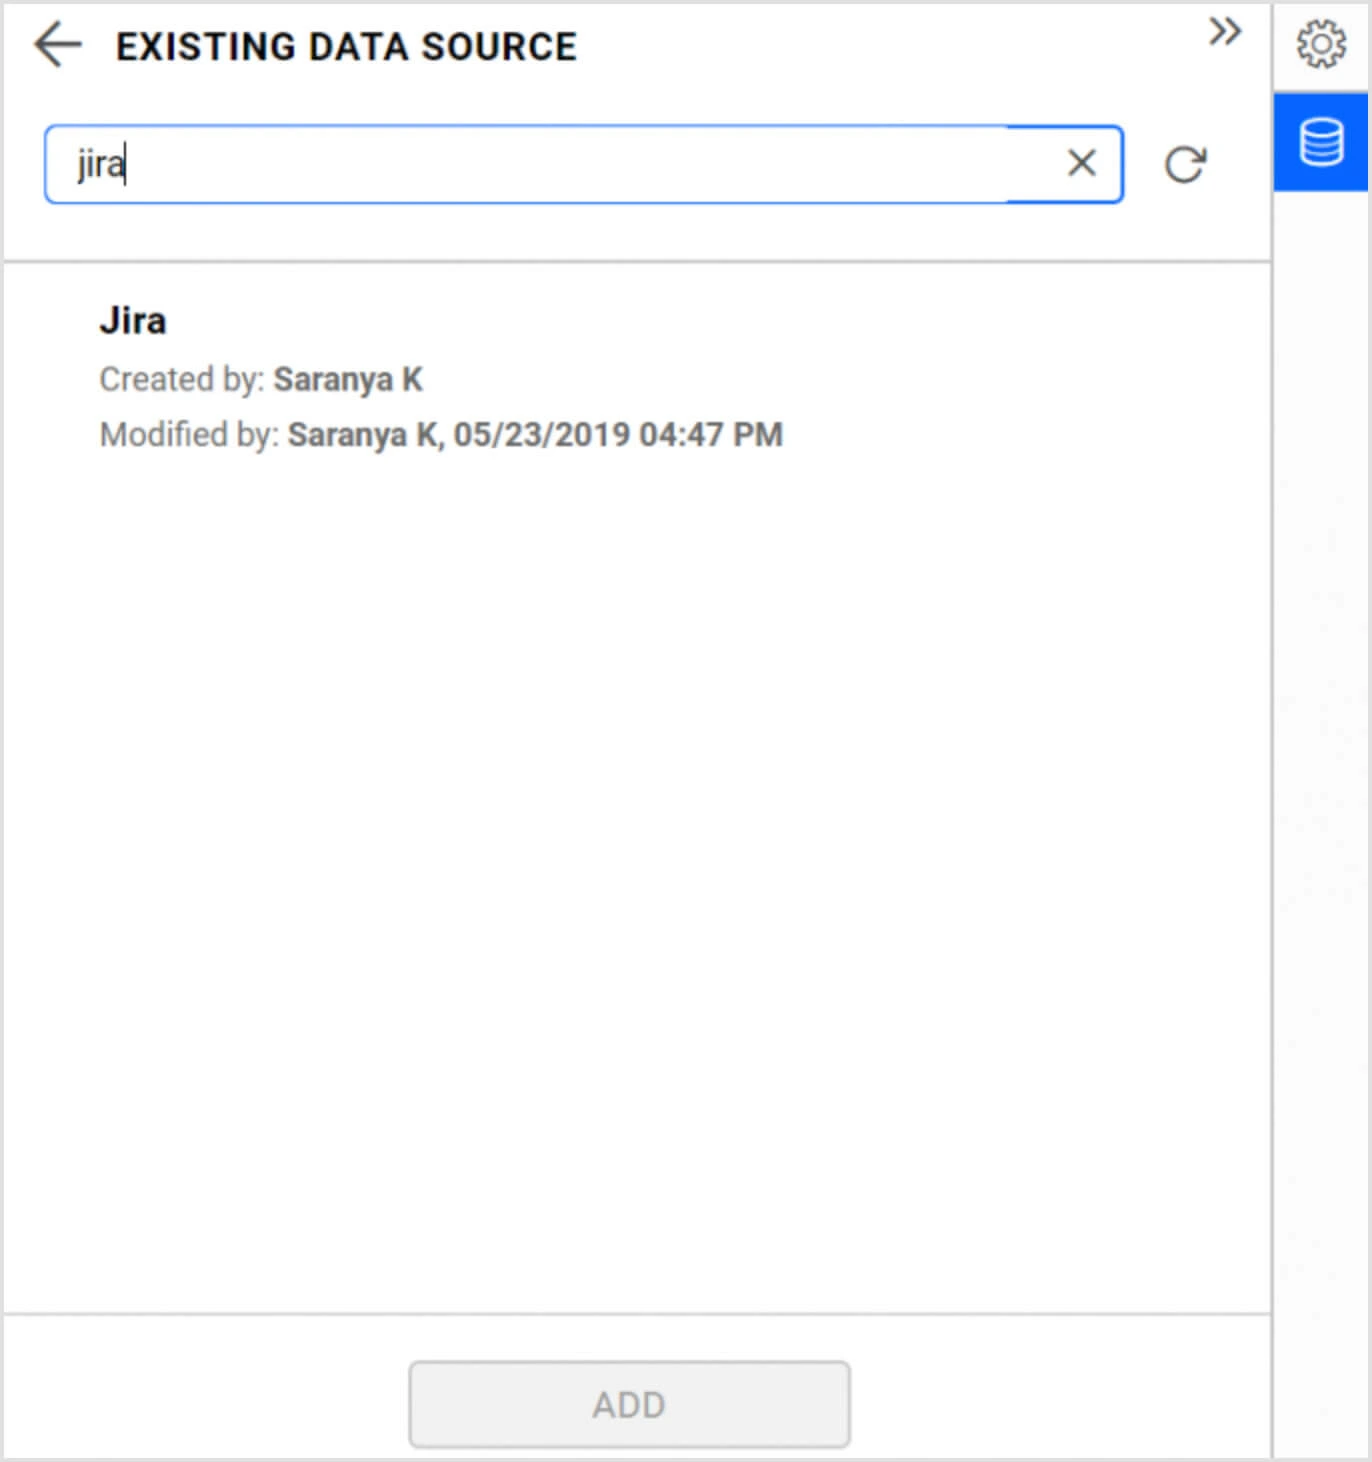
Above all, the search box helps to filter out specific items based on the owner or the data source name from a larger list.
Select the data source and select ADD at the bottom of the panel. As a result, the DATA SOURCES panel will now display the selected data source.
Built-in sample data sources
Built-in sample data sources are available for use by available widgets. This can help beginners understand the functionality of the widgets and learn how these widgets can display the information that is fed to them.
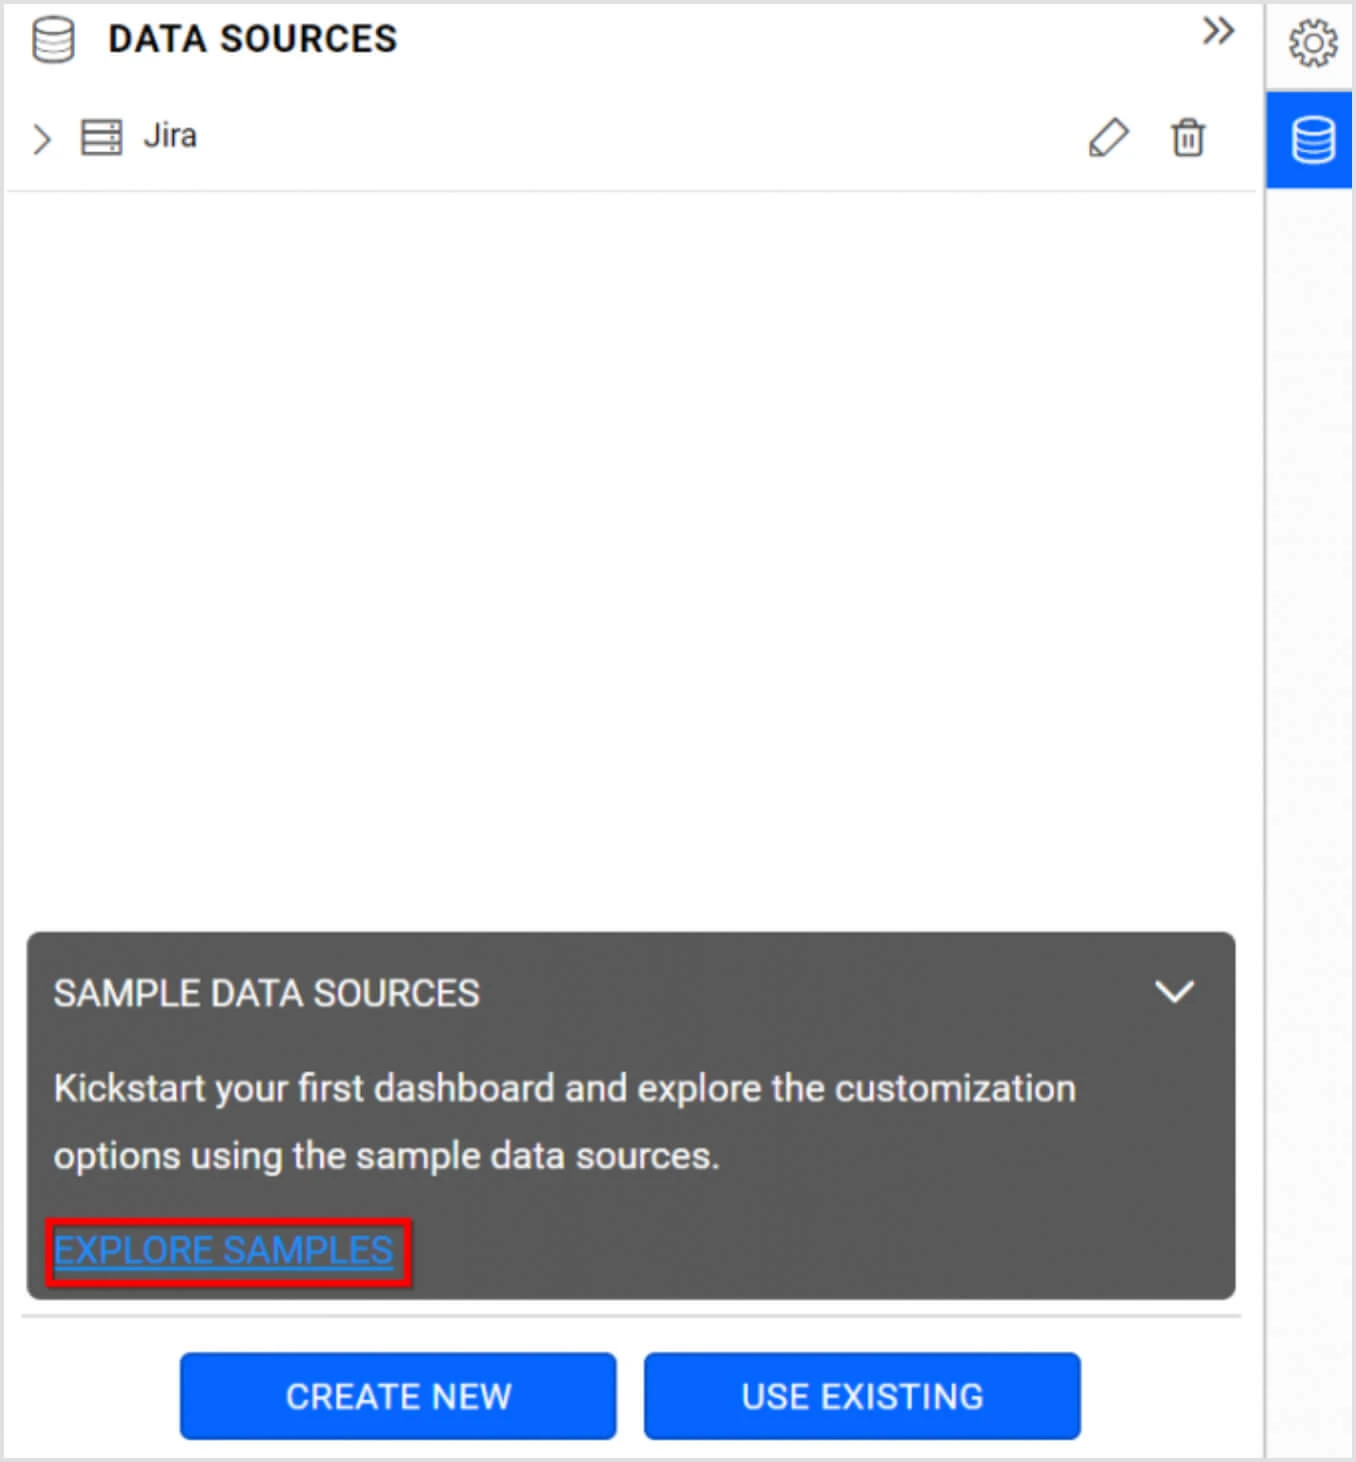
To explore sample data sources, select EXPLORE SAMPLES in the DATA SOURCES panel.
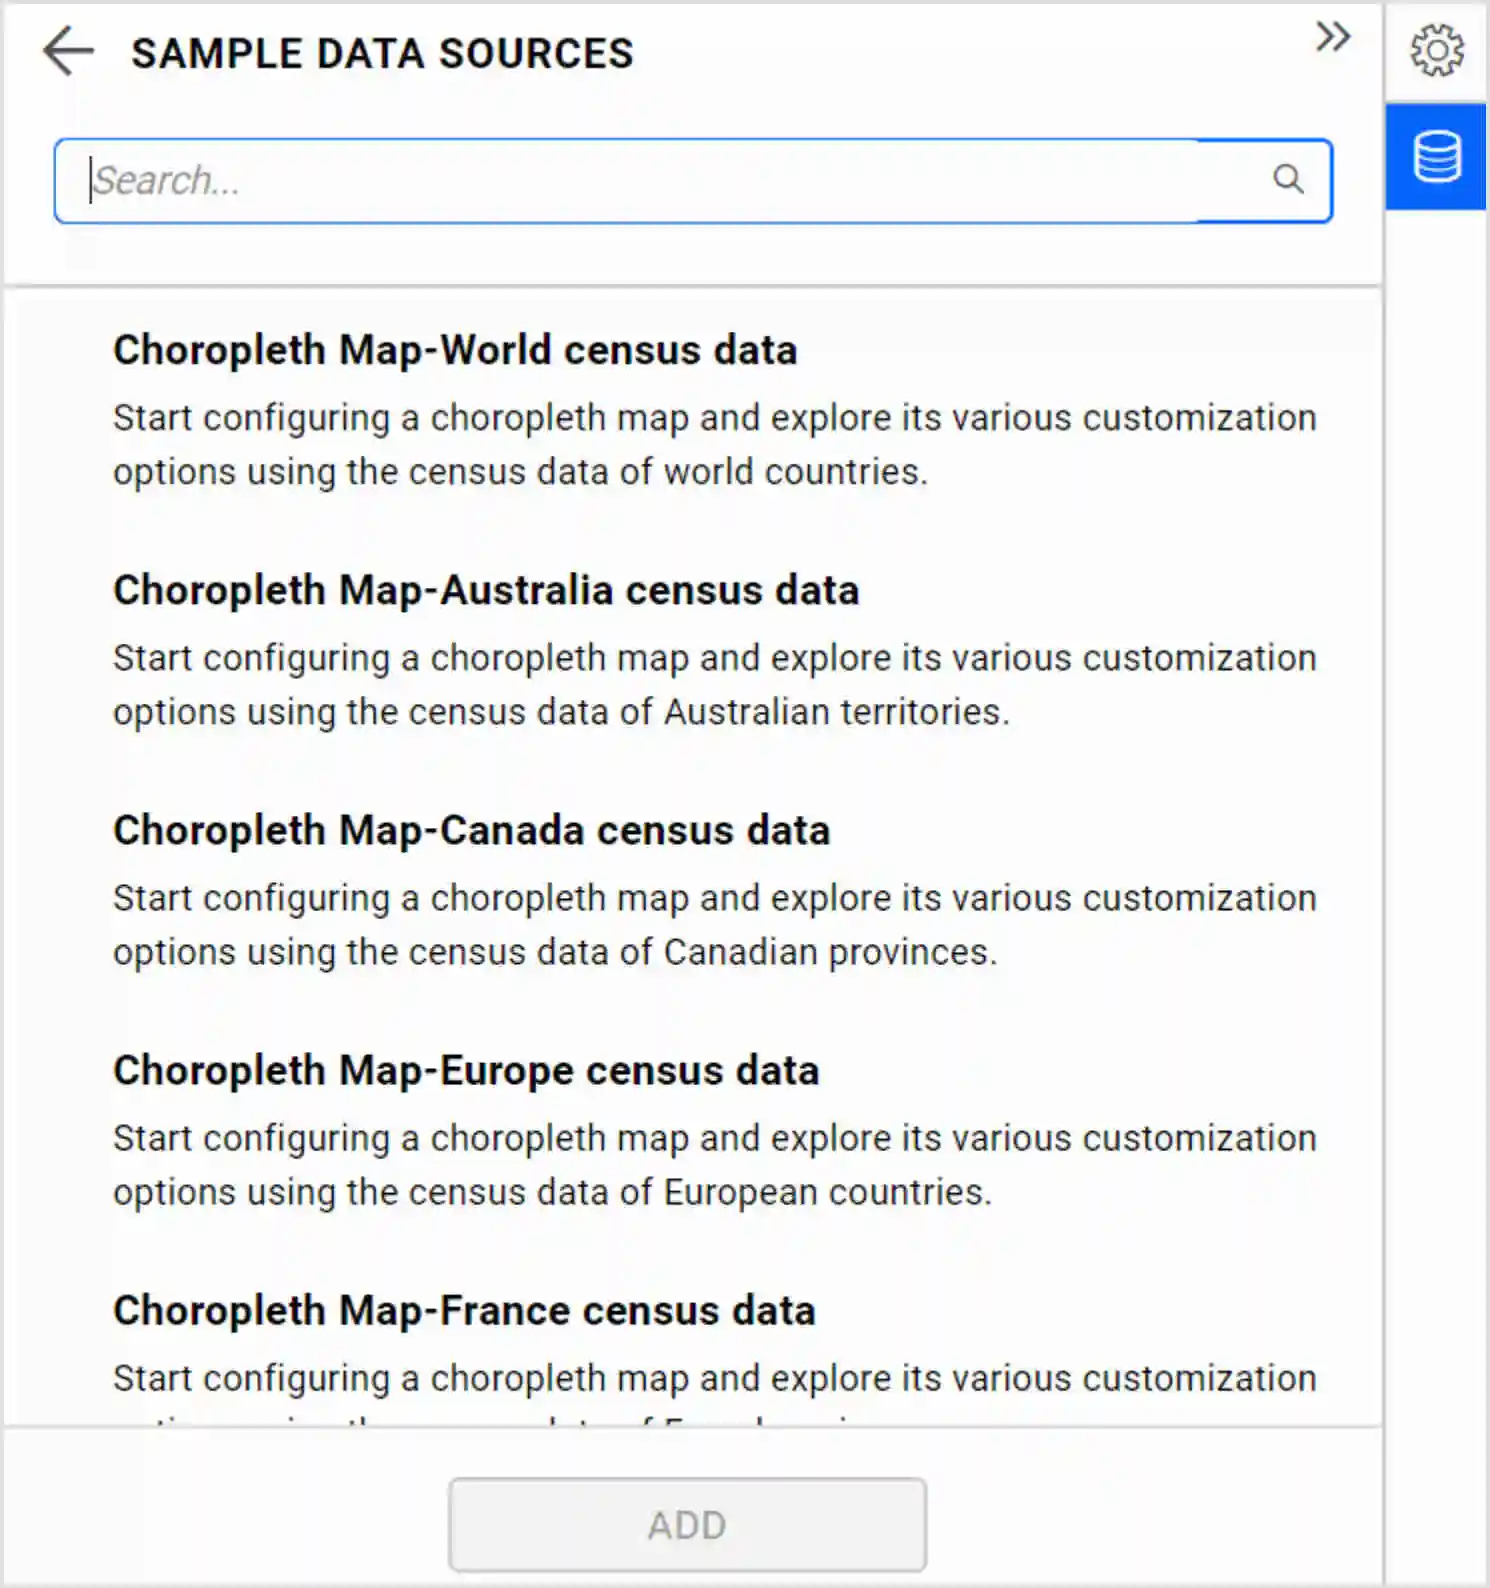
Choose a data source based on your needs and select ADD. The DATA SOURCES panel will display the selected data source.
You can build dashboards focusing on modules, such as Jira agile dashboards, to monitor activity streams, task assignments, milestones, sprint progress, and more. To further expand your dashboard, you can explore the following links.
- Creating dashboards
- Adding a widget to design view
- Assigning data to widgets
- Configuring properties for widgets
- Sharing dashboards
Conclusion
We hope this walk-through helps you connect your Jira data to Bold BI dashboards, build Jira dashboards, and visualize your project and team metrics. For more information about the features available in Bold BI dashboards, please read our blog post on the subject.
If you have any questions on this blog, please feel free to post them in the following comment section. Get started with Bold BI by signing up for a free 30-day trial and create more interactive business intelligence dashboards. You can also contact us by submitting your questions through the Bold BI website or, if you already have an account, you can log in to submit your support question.