Effectively Monitor Your Company’s Production Using Embedded Analytics

Introduction
Production is the central process behind all kinds of goods and services that results in something for others to consume. In processing and manufacturing industries, production leads to tangible objects. Monitoring production in these industries is tedious work but critical to ensure efficiency, performance, product quality, and more.
Embedded analytics in production monitoring helps you gain insight into the entire production process and identify issues as they occur. The use of embedded analytics can lead to improved product quality, performance, and overall equipment effectiveness. In this blog post, I am going to provide a comprehensive overview of embedded analytics, its benefits, production monitoring dashboards, and a summary of how to embed Bold BI® tools into production monitoring apps. Here are the topics I am going to discuss:
- What is embedded analytics?
- Benefits of embedded analytics in production monitoring.
- Bold BI’s Production Monitoring Dashboard.
- How to embed analytics tools in production monitoring.
What is embedded analytics?
Embedded analytics is the integration of analytical solutions and data visualization capabilities into a software application’s user interface to improve data comprehension and usability. Bold BI helps you easily embed an analytics solution into your everyday work applications using a JavaScript SDK and server application. It also enables non-technical people to monitor data sets with attractive dashboards and glean all the insights they need to improve organizational and workforce outcomes.
Benefits of embedded analytics in production monitoring
Embedding analytics in existing company software helps the manufacturing industry in the following ways:
- Improve production quality and target achievements.
- Manage time effectively.
- Improve financial flow.
- Improve project management.
Improve production quality and target achievements

Embedded analytics in production monitoring helps you understand every step of the manufacturing process, production targets, variations in production, and product quality. These help the production team identify areas that need improvement and make changes necessary to enhance the quality of products delivered to their customers. These improvements also lead to better company achievements overall. For example, in the production of phones, the team may find areas that could use upgrades, such as battery longevity, device portability, network strength, and more. Besides resulting in a better product, this also leads to more people choosing their product, increasing the company’s market share.
Effective time management

Time is a very important factor in measuring work. Embedded analytics helps the production team see trends in run time versus downtime hours on the production line, and also track employee working hours and overtime. Knowing this data can reduce the cost of the production process, and help managers implement overtime work strategically. Outside of production, this information also helps the team improve shipping and delivery processes, which in turn improves customer relationships and loyalty.
Improve financial flow

In any company, managing expenses can become a hefty load depending on the ability of the finance department to collect accurate statistics on how money is spent across supply, production, and delivery departments. Working with embedded analytics helps companies manage and track their expenses faster and gain insight into the financial flow of the company. It also outlines fluctuations in production over the course of the year, illuminates larger market trends of supply and demand, and helps forecast future business for the company. This helps management make important decisions on planning and budgeting faster. Embedded analytics also empowers managers to see how investments within the company are paying off, and where money could be saved on unwanted expenditures such as one-time productions and slow processes.
Improve project management

Project oversight is a demanding undertaking. Applying embedded analytics to oversight greatly eases the effort required by clearly presenting metrics about project milestones, plans, failures, reasons for failures, production targets, production variations, and so on. This helps the project manager obtain a clear picture a project and ensure that all aspects of a project are completed on time.
Bold BI’s Production Monitoring Dashboard
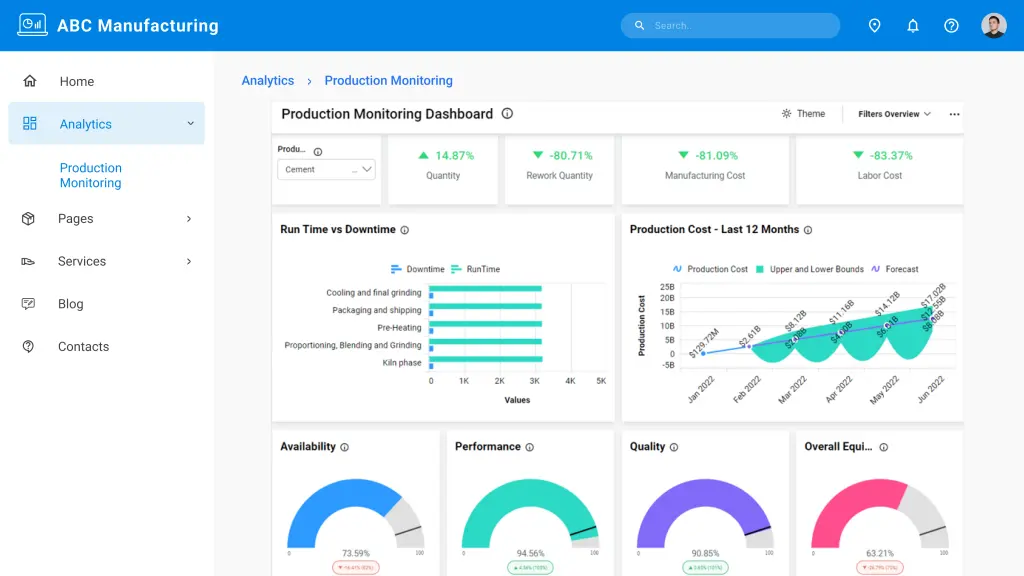
The Bold BI Production Monitoring Dashboard shows key metrics of a manufacturing company to help it improve the effectiveness of its processes. Showcased metrics include production quantity versus target quantity, rework quantity, manufacturing cost, labor cost, and run time versus downtime.
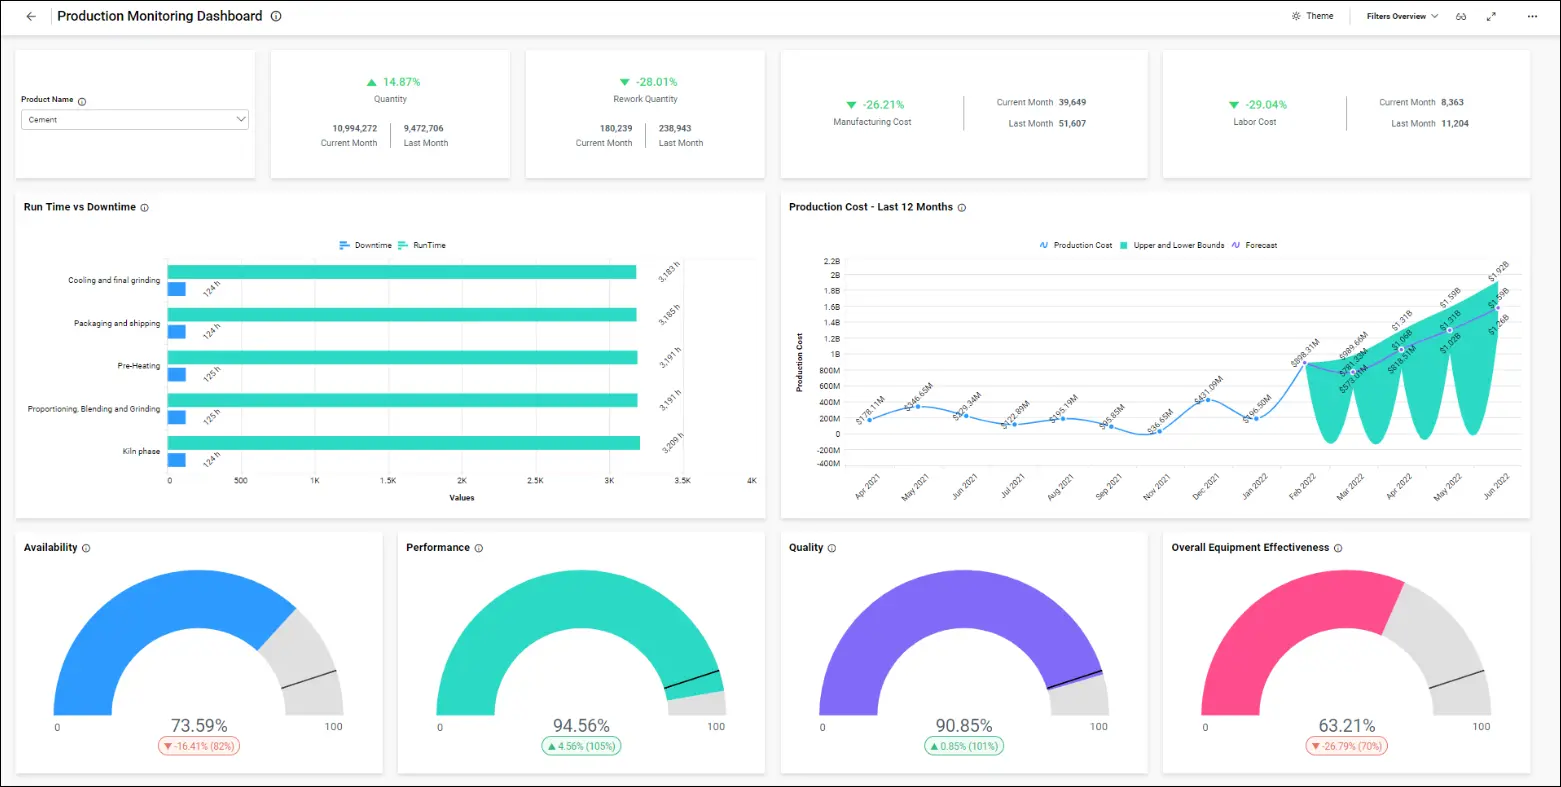
Using the Production Monitoring Dashboard, a company can track these key metrics and KPIs about its processes:
- Run time vs. downtime.
- Production costs over the last 12 months.
- Availability
- Performance
- Quality
- Overall equipment effectiveness.
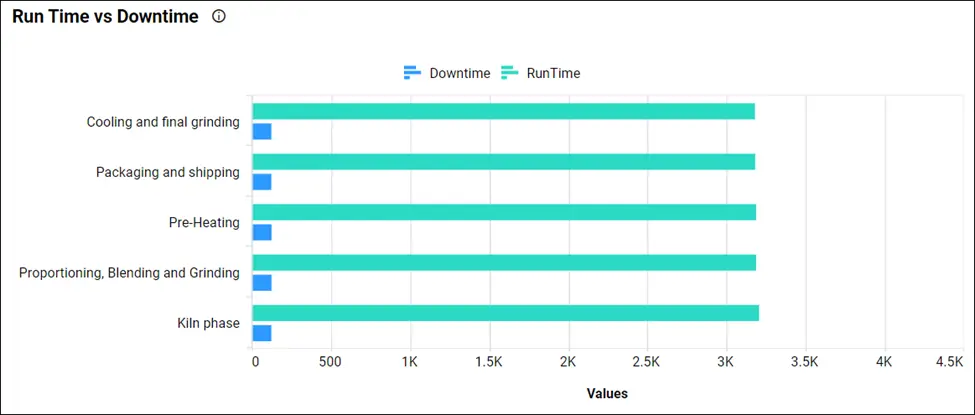
Run time vs. downtime
Downtime encompasses any unplanned event that causes the manufacturing process to stop. Run time is any time the manufacturing process is scheduled for production and is running. This bar chart compares these two values at different stages of the production process.
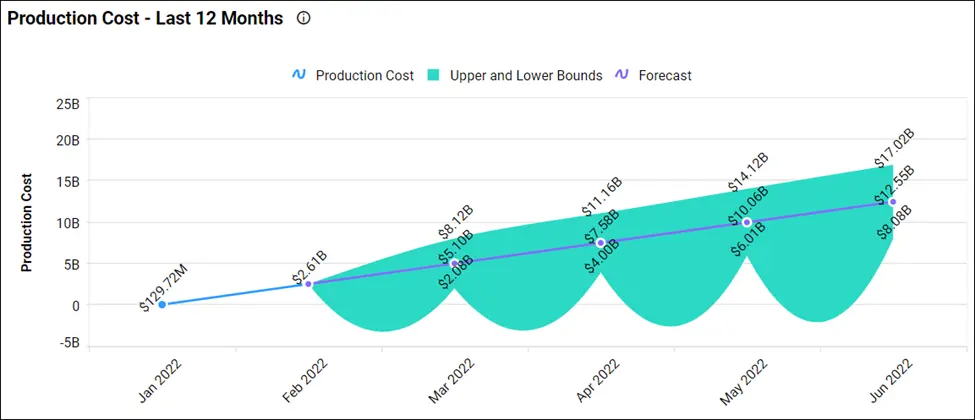
Production costs over the last 12 months
The production cost chart shows the monthly fluctuations in the company’s production costs. It is particularly useful for evaluating trends that may occur over the course of the year.
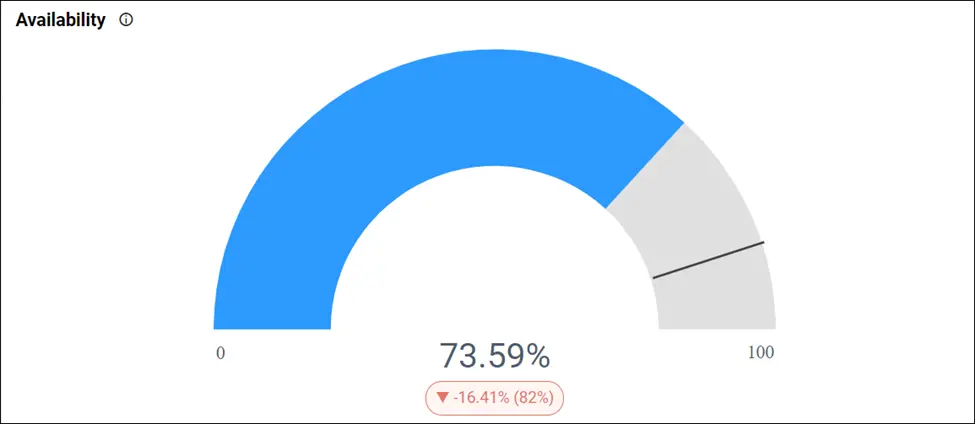
Availability
Availability takes into account any event that disrupts run time long enough to be noted. Managers can compare the availability goal set for production against the actual value.
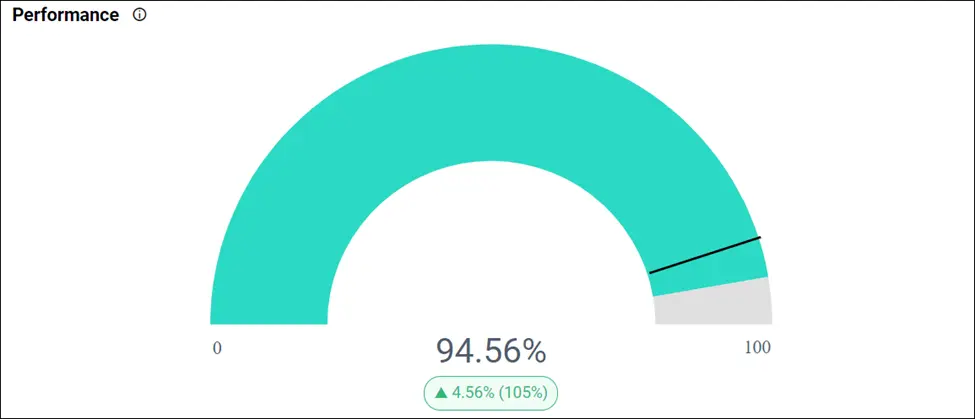
Performance
The performance gauge measures how much of the production process runs at maximum speed.
Quality
The quality gauge measures the proportion of products that meets or exceeds all requirements, standards, and specifications.

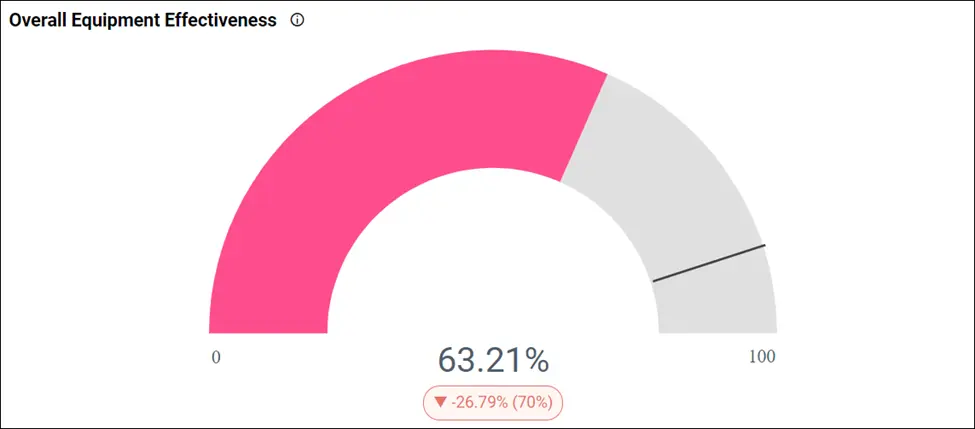
Overall equipment effectiveness
The overall equipment effectiveness gauge displays the overall effectiveness of an entire production line. It is a measurement derived from a combination of availability, performance, and quality.
To learn more about the metrics and KPIs used in this dashboard example, refer to the Production Monitoring Dashboard demo.
How to embed analytics tools into production monitoring
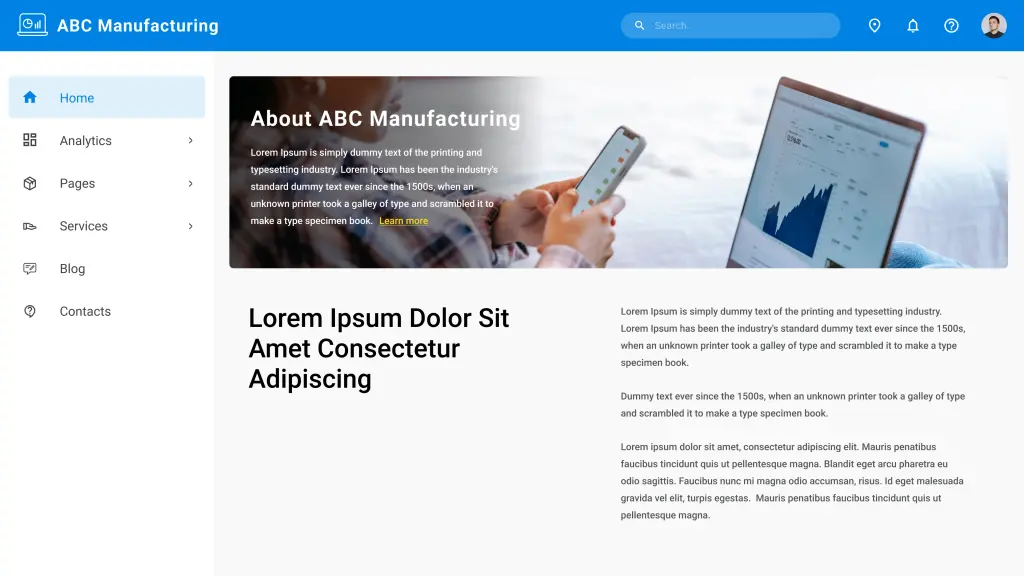
Let’s see how analytics can be embedded into your production monitoring web applications. Bold BI helps you embed your dashboards in more than 18 web platforms, including React with ASP.NET Core, React with Go, WinForms, Node.js, Vue with Go, Vue with ASP.NET Core, and more. In the rest of this blog, I am going to explain how to embed dashboards in your ASP.NET MVC applications. Consider a scenario in which your production monitoring department has a web app like the one shown in the following image.
You can embed dashboards easily using Bold BI and avoid building an analytics or BI solution yourself. Follow these steps to embed your dashboard successfully.
Prerequisites
Download and install the Bold BI server on your local machine and create an enterprise-grade dashboard. You can find the installation and deployment instructions here.
Step 1: Creating an ASP.NET MVC application.
First, create an ASP.NET MVC application. Open Microsoft Visual Studio and click New Project. Then choose ASP.NET MVC Web Application, enter the project name, and click OK.
Step 2: Configure embed properties.
After the ASP.NET MVC web application is created, you need to create a model class called EmbedProperties under Models and provide the dashboard RootURL, SiteIdentifier, Environment, UserEmail, and EmbedSecret.
| Properties | Property Value Descriptions |
| RootUrl | Bold BI dashboard server URL. For example: https://localhost:5000/bi, https://dashboard.syncfusion.com/bi. |
| SiteIdentifier | For Bold BI, it should be something like “site/site1”.For the Bold BI Cloud Analytics Server, it should be an empty string. |
| Environment | Your Bold BI application environment. If using Bold BI Cloud Analytics Server, you should use “cloud.” If using Bold BI, you should use “enterprise.” |
| UserEmail | The Bold BI server will use an email address to authorize the authorization server. |
Step 3: Generate embed secret.
You have to set the embed secret for authentication, and you can get it from the Bold BI server. Click the Settings icon in the left navigation bar and then click the Embed tab. Click Enable embed authentication and then click the Generate Secret button to generate the embed secret. On clicking the button, a secret key will be generated. Copy the secret key and paste it into the application. To learn how to do this in more detail, you can refer to this documentation link.
Note: Save the secret key, as it cannot be retrieved again. If you do not save it, you will have to generate a new one using the Reset Secret option.
Step 4: Create an authorization server.
You need to implement an authorization server in the ASP.NET MVC application to get authenticated before embedding the dashboard from the Bold BI server. You can also configure the single sign-on (SSO)-based authorization server, which is an authentication endpoint that enables users to securely authenticate multiple applications using unique embed secrets. This prevents the need for the user to log into different applications separately.
Step 5: Create a Bold BI instance.
Finally, create a Bold BI instance to load the dashboard using a JavaScript file. Reference the required script files and CSS files in the HTML pages.
Step 6: Run the application to embed the dashboard.
After creating the ASP.NET MVC application, you need to run it. It will be launched with the dashboard details. Finally, you can that see the dashboard created in the Bold BI server is embedded in your web application.

By following the previous steps, you can embed your dashboards into your ASP.MVC application.
To learn more about embedding dashboards into your applications, refer to this blog. You can also download the sample code from this blog in our documentation.
Conclusion
Bold BI® helps you integrate dashboards in your applications written in ASP.NET Core, ASP.NET MVC, Angular, ASP.NET, and Ruby on Rails. You can create a dashboard any way you like with Bold BI’s 35+ widgets and 150+ data sources. Bold BI will help you save time and prevent you from doing redundant work. Click this link to explore its features. To learn more about embedding dashboards in your application, refer to this blog and our documentation.
Get started with Bold BI by signing up for a free trial and create interactive business intelligence dashboards. You can contact us by submitting questions through the Bold BI website or, if you already have an account, you can log in to submit your support question.