

Manage and Visualize Your Forums Effectively with Embedded Analytics
Introduction
Forums can give companies a space for their customers to come together. Enthusiasts for your product or service form a community, building brand loyalty and giving forum moderators access to some of the first signs of any issues. Looking at what customers like, dislike, and want can help a company come up with new ideas and improvements. But managing multiple forums can leave a moderator with insight too narrow and vague to glean all possible benefits from the data accumulated in those forums. That’s where analytics crunching that data helps you step back and get a clearer look at the big picture.
Embedded analytics visualize your forums’ data all in one place within your software application. In this blog am going to discuss how embedded analytics will better your forums through the following subtopics:
- What is embedded analytics?
- Benefits of using embedded analytics in forum management.
- Bold BI’s Forum Management Dashboard example.
- How to embed analytical tools into forum management apps.
What is embedded analytics?
Embedded analytics is the collection of data from different locations simplified and analyzed in one existing application easily accessible to the user. Bold BI® helps you easily embed an analytics solution into your everyday work applications using a JavaScript SDK and server application. It also enables non-technical people to monitor data sets with attractive dashboards and glean all the insights they need to improve organizational and workforce outcomes. This helps the managers drive their forum wherever they are smoothly and run their business effectively.
Benefits of using embedded analytics in forum management
Embedded analytics in your existing software application enables you to manage your forums effectively, enhancing the growth of your business. I’m going to discuss some of the main benefits of using embedded analytics in your forum management strategy:
Improved communication

Communication is key when it comes to any relationship. It enables a better understanding of one another in the pursuit of common goals. Forums give companies an avenue to interact publicly with their customers, to encourage fans, let customers know where to find help for issues, and keep a finger on public perception of their brand. Using embedded analytics in forum management gives forum moderators insight into key metrics about posts, threads, feedback, etc. Moderators can keep an eye on the rate of complaints in general and on specific issues, letting the rest of the company know when, for example, an issue is common enough to warrant help information being added to a website or an adjustment made to a product. On the more positive side, they can also spot when specific features are repeatedly lauded and notify the marketing department of possible topics for promotion. This communication between a company and its customers is invaluable for the improvement of a company’s offerings and reputation, and analytics makes it easier to get an overall picture of what is being communicated in a company’s or product’s forum.
Better engagement

Forum engagement is important for companies. Forums help customers feel like brands are listening to them, fomenting brand loyalty. Well managed forums develop communities of loyal users, who in turn bring in more customers. Using embedded analytics lets you track the threads with the most posts, total replies, total users, and more. Knowing which topics are hot enables the moderator to better engage with users and create more spaces for them to share issues and ideas.
Easier monitoring of forum traffic

Monitoring an organization’s workflow gives managers a good idea of its performance and how to improve it. Likewise, monitoring the traffic of your forum over a longer period of time makes clear any issues the functionality or accessibility of the forum itself might have. You can also observe what help topics for your products are being searched most often. Thus, you can improve both. Embedded analytics give your moderators a view of their forum traffic, looking at thread post summaries and their monthly and yearly traffic. This view is in the form of easy-to-understand graphs and charts with adjustable time ranges and real-time updates.
Bold BI’s Forum Management Dashboard example
The Forum Management Dashboard example shows some key metrics that help moderators effectively manage and maintain their forums.
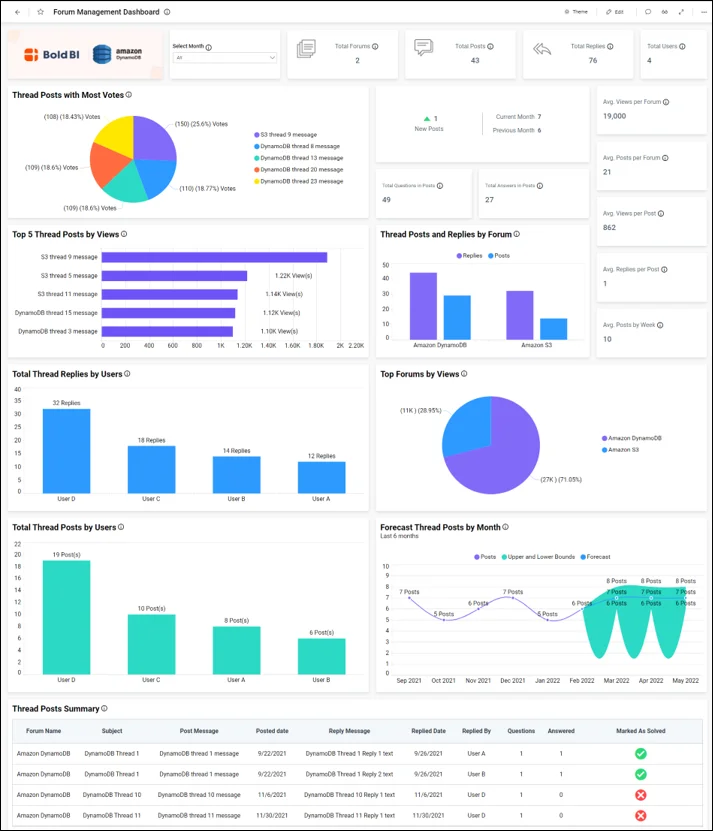
The Forum Management Dashboard tracks the following key metrics and KPIs:
- Total forums
- Total posts
- Total replies
- Total users
- Thread posts with most votes
- Average views per forum
- Average posts per forum
- Total questions in posts
- Total answers in posts
- Average views per post
- Top 5 thread posts by views
- Thread posts and replies by forum
- Average replies per post
- Average posts by week
- Total thread replies
- Top forums by views
- Total thread posts by users
- Forecast thread posts by month
- Thread posts summary
Total forums

This card widget shows the total number of forums managed by the moderator for the selected month.
Total posts

This card widget shows the total posts in the forums for the selected month.
Total replies

This card widget shows the total replies received for posts for the selected month.
Total users

This card widget shows the total users who have been involved in posts and replies for the selected month.
Thread posts with the most votes

This pie chart shows the posts with the most votes from users for the selected date range.
Average views per forum
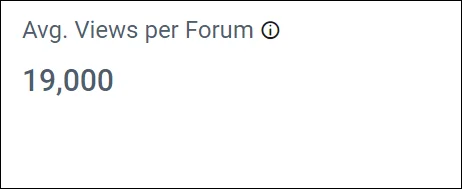
This card widget shows the average number of views by people on each forum for the selected date range.
Average posts per forum
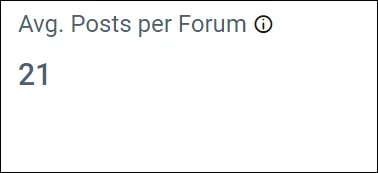
This card widget shows the average number of posts posted on each forum for the selected date range.
Total questions in posts
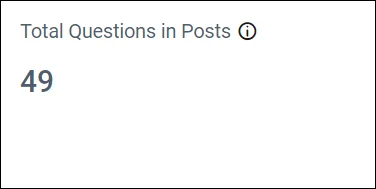
This card widget shows the total questions asked in posts for the selected date range.
Total answers in posts
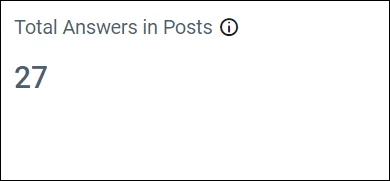
This card widget shows the total answers posted to questions asked for the selected date range.
Average views per post
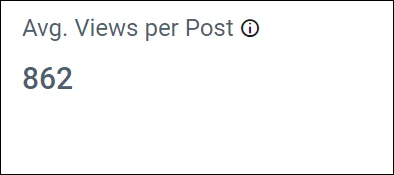
This card widget shows the average number of views per post for the selected date range.
Top 5 thread posts by views
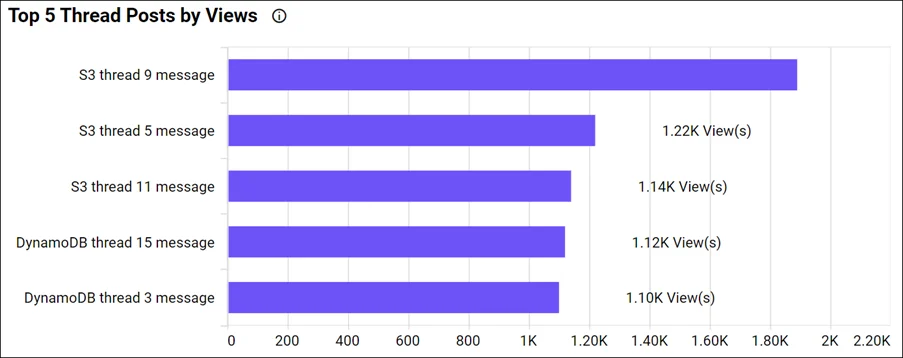
This bar chart shows the most viewed posts for the selected date range.
Thread posts and replies by forum
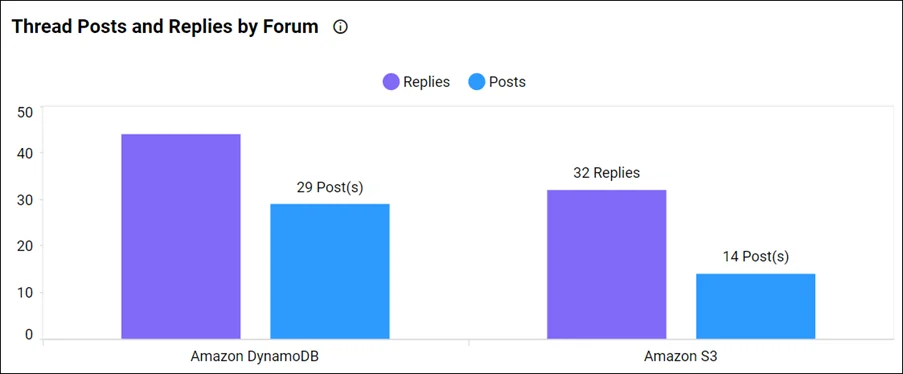
This column chart showcases the number of posts and replies in each forum for the selected date range.
Average replies per post

This card widget shows the average number of replies by users on posts for the selected date range.
Average posts by week
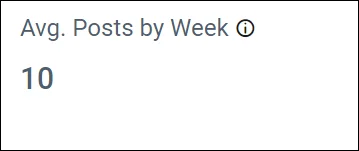
This card widget shows the average number of posts added to forums each week for the selected date range.
Total thread replies by users
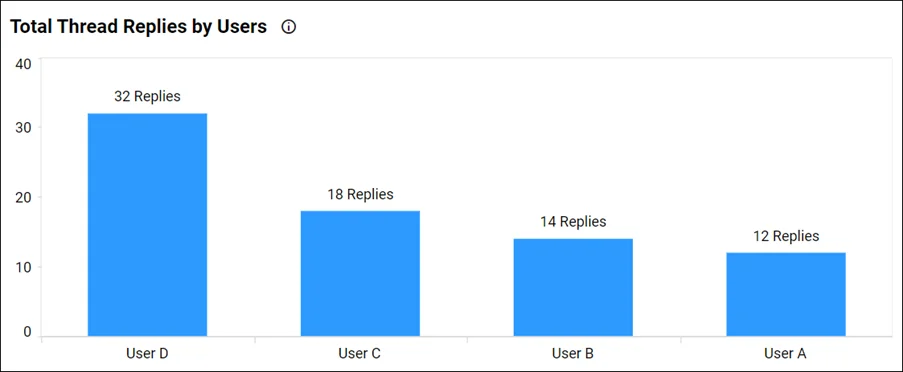
This column chart shows the total replies to posts by specific users for the selected date range.
Top forums by views
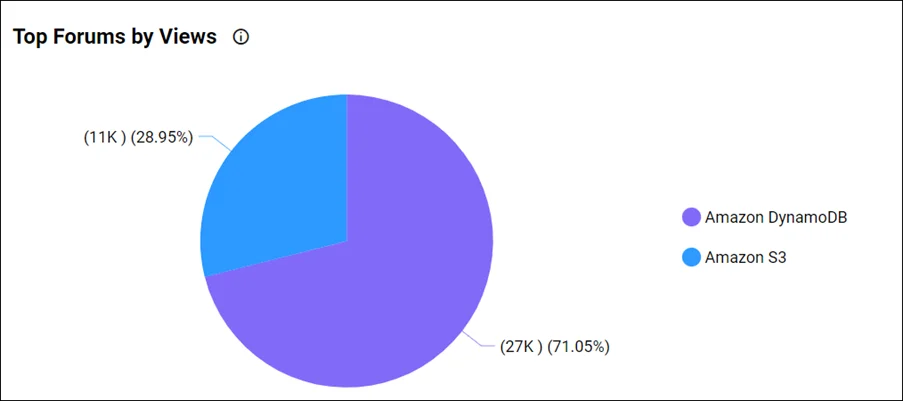
This pie chart shows what percentage of the total views each forum received.
Total thread posts by users
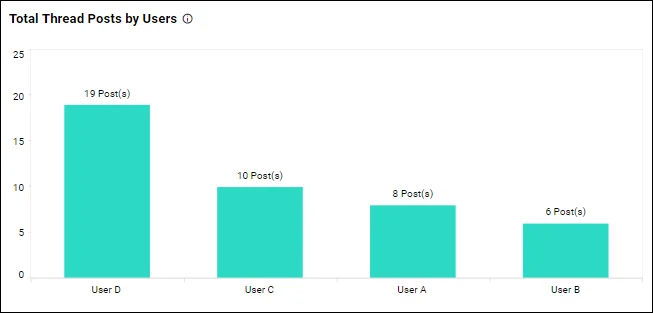
This column chart shows the total number of thread posts on the forum by specific users for the selected date range.
Thread posts forecast by month
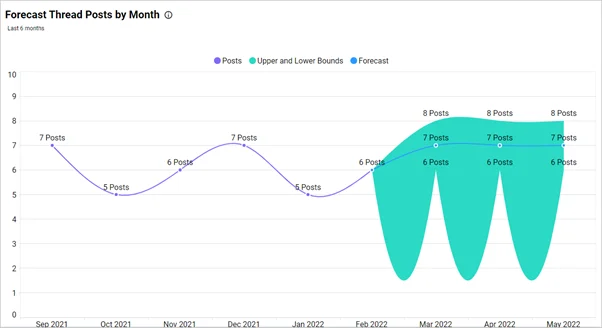
This spline chart showcases the forecast statistics for the next 3 months of posts based on the previous months’ posts.
Thread posts summary
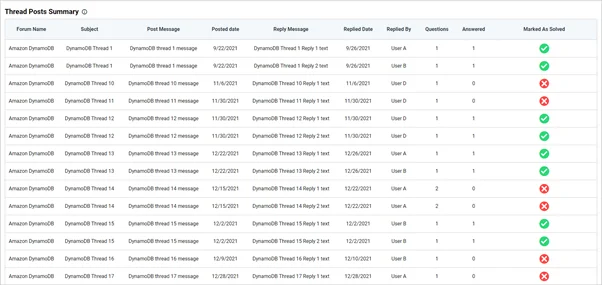
This grid shows the forum name, post details, reply details, and posting dates for the selected date range, summarizing forum performance.
To learn more about the metrics and KPIs used in this dashboard example, refer to the Forum Management Dashboard demo.
How to embed analytical tools into forum management dashboard apps
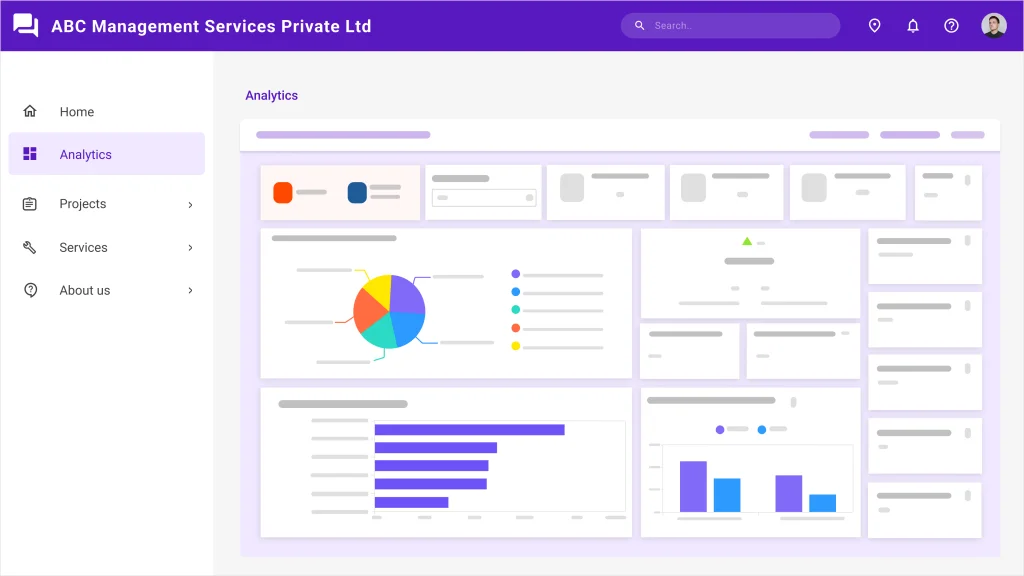
Let’s see how analytics can be embedded into forum management web applications. Bold BI helps you embed your dashboards in 18 web app platforms, including ASP.NET Core, ASP.NET MVC, Angular, ASP.NET, and Ruby on Rails. In the remainder of this blog, I am going to explain how to embed dashboards into your Angular applications. Consider a scenario where your company has a website like the one shown in the following image.

You can embed dashboards easily using Bold BI and avoid building an analytics or BI solution yourself. Follow these steps to embed your dashboards successfully.
Prerequisites
Download and install the Bold BI server in your local machine and create an enterprise-grade dashboard. You can find the installation and deployment steps here.
Step 1: Create an Angular application.
To successfully embed a dashboard in your application, you need to create an Angular application. First, you need to create a new Angular project in Visual Studio Code and add the necessary TS files to the project as shown in the following image.
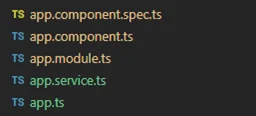
For more guidance, refer to the sample code in the Bold BI documentation.
In this demonstration, the Angular application acts as a client, and an ASP.NET Core application acts as a server. You need to add several properties in the app.component.ts file as shown in the following table and screenshot.
| Properties | Property Value Descriptions |
| RootUrl | Bold BI dashboard server URL. For Example: https://localhost:58094/bi, https://dashboard.syncfusion.com/bi. |
| SiteIdentifier | For Bold BI Enterprise, it should follow the format `site/site1`. For Bold BI Cloud, it should be an empty string. |
| Environment | Your Bold BI application environment. If using Bold BI Cloud Analytics Server, you should use “cloud.” If using Bold BI Enterprise, you should use “enterprise.” |
| UserEmail | The Bold BI server will use an email address to authorize the authorization server. |
import { Component, Injectable } from '@angular/core';
import { Router, ActivatedRoute } from '@angular/router';
import { appService } from './app.service';
import { Item } from './app';

@Component({
    selector: 'app-root',
    templateUrl: './app.component.html',
    styleUrls: ['./app.component.css'],
    providers: [appService]
})

@Injectable()

export class AppComponent {

    //ASP.NET Core application would be run on http://localhost:61777/, which needs to be set as "apiHost"
    public apiHost = "http://localhost:5000";

    //Dashboard Server BI URL (ex: http://localhost:5000/, https://demo.boldbi.com/bi/)
    public rootUrl = "http://localhost:5000/bi";

    //For Bold BI Enterprise edition, it should be like 'site/site'. For Bold BI Cloud, it should be empty string.
    public siteIdentifier = "site/site1";

    //Url of the GetDetails action in ValuesController of the ASP.NET Core application
    public authorizationUrl = "/api/home/getdetails";

    //Url of the GetDashboards action in ValuesController of the ASP.NET Core application
    public getDashboardUrl = "/api/home/getdashboards";
    public baseUrl = "";
    public dashboardServerApiUrl = "";
    public dashboards: Item[];
    constructor(private _app: appService) {
    }
    ngOnInit() {
    }
}
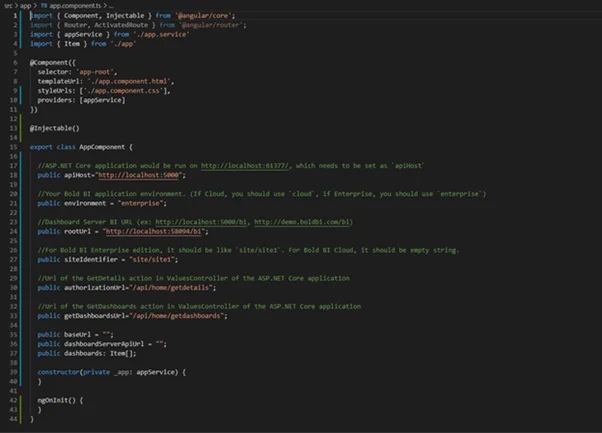
After adding these properties, we need to create the Bold BI instance.
Step 2: Create a Bold BI instance.
We create a Bold BI instance to help us communicate between the server side (any web application) and the client side (the new Angular application), which allows us to embed a Bold BI dashboard in the Angular application.
Step 3: Create an authorization server to authenticate the Bold BI server.
Every application that embeds a Bold BI dashboard or widget must be authorized with the Bold BI server. This authentication step requires sending confidential information to the Bold BI server, such as user email, group data, and embed signature. So, in your server application, implement this authentication flow and provide the URL for connecting to your server in the Bold BI instance.
Step 4: Run the Angular application to view the embedded dashboard.
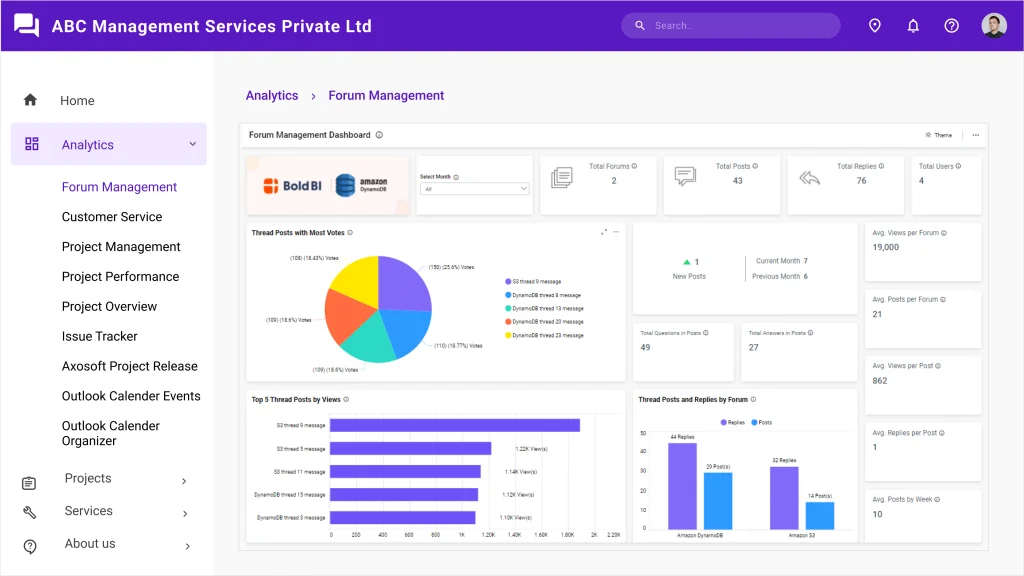
In the Angular application, update the authorization URL and dashboard URL that were defined in the ASP.NET Core application. Finally, you can see that the dashboard created in the Bold BI server is embedded in your web application.
By following the previous steps, you can successfully embed your dashboards into your Angular application.
To learn more about embedding dashboards into your Angular applications, refer to this blog. You can also download the sample code used in the previous steps from our documentation.
Conclusion
Bold BI® helps you to integrate dashboards in your applications written in, ASP.NET Core, ASP.NET MVC, Angular, ASP.NET, and Ruby on Rails. It will help you save time and prevent you from doing redundant work. Click this link to explore its features. To learn more about embedding dashboards into your application, refer to this blog and our help documentation.
I hope you now have a better understanding of Bold BI and how it will help with forum management. You can create a dashboard as you like with Bold BI’s 35+ widgets and 150+ data sources.
Get started with Bold BI by signing up for a free trial and create more interactive business intelligence dashboards. You can contact us by submitting questions through the Bold BI website or, if you already have an account, you can log in to submit your support question.





