Spotting Sales Opportunities with Line Chart Visualization

Sales opportunity spotting is a crucial skill in business, involving identifying revenue sources from client relationships, market trends, or industry niches. It requires understanding customer behavior and a proactive mindset. This skill maximizes revenue, strengthens client relationships, and keeps businesses ahead in a constantly evolving market.
Challenges affecting business’ ability to identify sales opportunities
When a sales team struggles to identify sales opportunities, it fails to meet revenue goals, resulting in financial shortfalls that ripple throughout the rest of the company. Some of the challenges teams face in opportunity identification include:
Increased competition
In a competitive market, sales departments may struggle to identify new opportunities, often prioritizing short-term goals over long-term ones that require more time and resources.
Lack of customer understanding
Due to a shallow or complete lack of understanding of customer needs, preferences, and behaviors, sales teams encounter difficulties in identifying new opportunities that align with customers’ evolving demands.
Limited data analysis
Sales departments may lack the tools or resources to analyze customer data effectively. This makes it difficult to spot trends and patterns that indicate new opportunities.
Inflexible sales strategies
Sales teams may resist change or be limited by rigid sales strategies that do not allow for experimentation or innovation. This can make identifying new opportunities that require a different approach difficult.
Lack of cross-functional collaboration
Sales departments may work in silos and not integrate well with other teams, such as marketing or product development. This can limit their ability to spot new opportunities when a more holistic approach would be effective.
Benefits of spotting sales opportunities using line charts
The following benefits are associated with finding sales opportunities through line charts:
Making the right decision
Businesses can make the right choices when using line charts to determine sales opportunities, especially in product development, marketing, and sales processes, because they have data to back up decisions instead of intuition or outright guesses.
Enhanced forecasting
Line charts can help sales managers predict future trends and patterns in products and customer preferences with greater accuracy, allowing them to adjust their sales strategies accordingly.
Increased revenue
Identifying sales opportunities through line charts can increase revenue, as the organization can align its efforts on products, services, or customer segments that are most likely to generate sales.
Better resource allocation
By spotting opportunities for sales growth, businesses can allocate resources more effectively to capitalize on those opportunities.
Improved competitiveness
By using line charts to identify sales opportunities, sales teams can stay ahead of their competitors by spotting trends and patterns others may not know.
Better customer understanding
Line charts help the sales department better understand its customers by visualizing how products, services, and customer preferences change over time. This aids businesses in customizing their offerings to meet customer needs and preferences.
There are a few factors to consider when using a line chart to spot sales opportunities.
Factors to consider when using a line chart to spot sales opportunities
The following are factors to consider when using a line chart to spot sales opportunities:
- Choose the right period: Select the appropriate period for examining your sales cycle and individual opportunities, such as weekly or monthly for short-term prospects, or quarterly or annual for long-term ones.
- Plot the right data: Choose the data most pertinent to your sales goals, like revenue, units sold, or customer count.
- Look for trends and patterns: Identify trends and patterns in your data, such as sales revenue fluctuations, seasonal fluctuations, and changes between specific months or quarters of the year.
- Identify outliers: Outliers are data points that deviate significantly from the trend, often resulting from factors like new product launches or economic events, aiding in identifying new sales opportunities or potential issues.
How business intelligence influences the process of spotting sales opportunities
Here is how business intelligence (BI) influences the process of spotting sales opportunities:
- Data analysis: BI helps businesses analyze enormous amounts of data, such as consumer behavior, sales trends, and market insights, to identify sales opportunities.
- Real-time monitoring: Business intelligence offers real-time sales performance monitoring, enabling businesses to adapt to market changes swiftly.
- Predictive analytics: BI employs predictive analytics to identify potential sales opportunities based on customer behavior and past purchase history, including upsell and cross-sell.
- Reporting: BI generates reports that provide insights into sales performance, such as revenue growth, customer retention rates, and sales trends.
- Data visualization: BI creates data visualizations, such as line charts, that make it easier to identify sales opportunities and trends.
- Collaboration: BI aids in coordinating sales, marketing, and product development departments to identify sales opportunities and devise effective strategies.
- Automation: BI automates sales opportunity identification by utilizing machine learning algorithms to analyze data and identify patterns.
With the help of a BI tool, the ability to identify sales opportunities is significantly enhanced.
How to use line charts to identify sales opportunities
A line chart visually represents data points connected by line segments. When it comes to sales, a line chart can be a tool for finding new opportunities in the following ways:
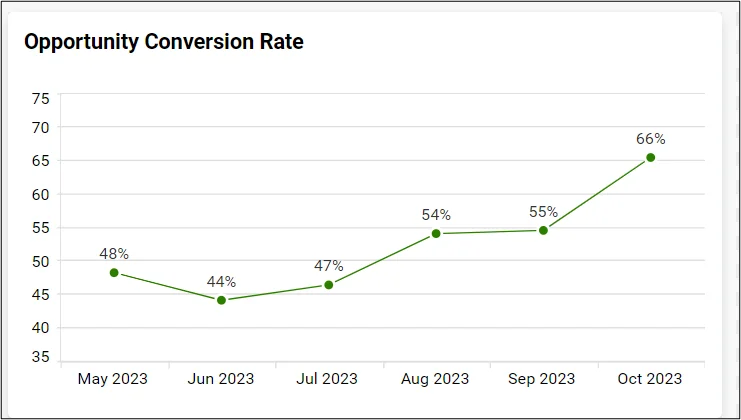
Trend analysis
Line charts provide a clear, time-based view of sales progress, visualizing trends and enabling timely adjustments to focus resources on high-potential opportunities.
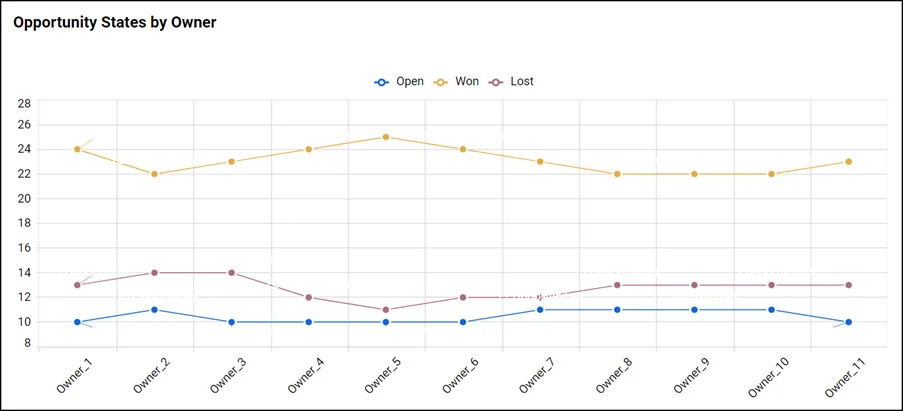
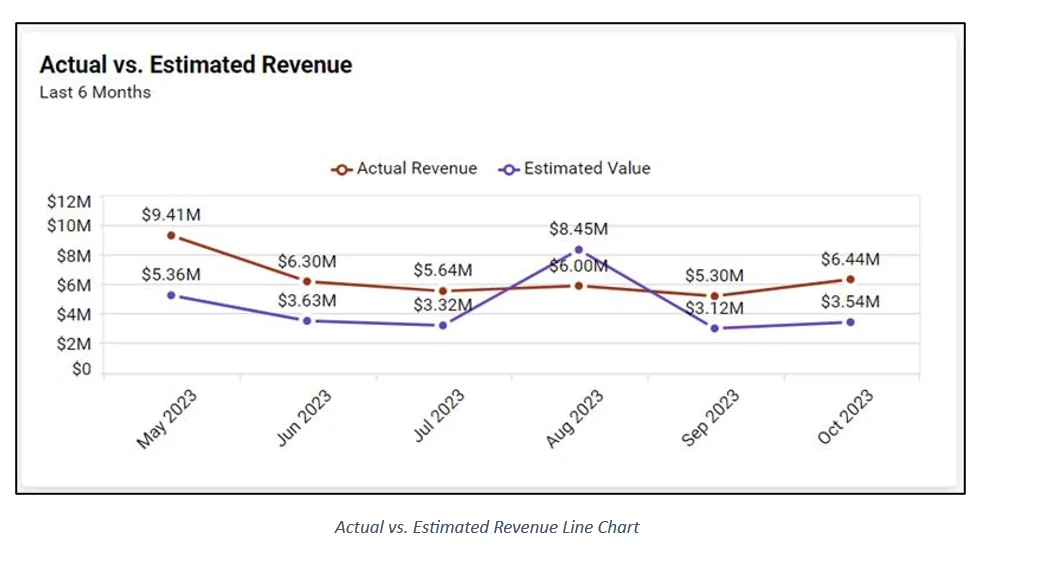
Comparison
Comparisons help businesses identify market gaps by comparing competitor offerings, identifying areas where they can provide superior value and potentially generate sales opportunities.
Visual representation
Line charts provide a clear visual representation of data, which can be easier to understand than raw data. For example, sales leaders can easily comprehend trends in revenue sources and identify which sources may have sales opportunities remaining.
Performance tracking
Line charts can be used to track the performance of sales campaigns or initiatives over time, allowing to see what’s working and what’s not and adjust strategies accordingly to maximize sales opportunities.
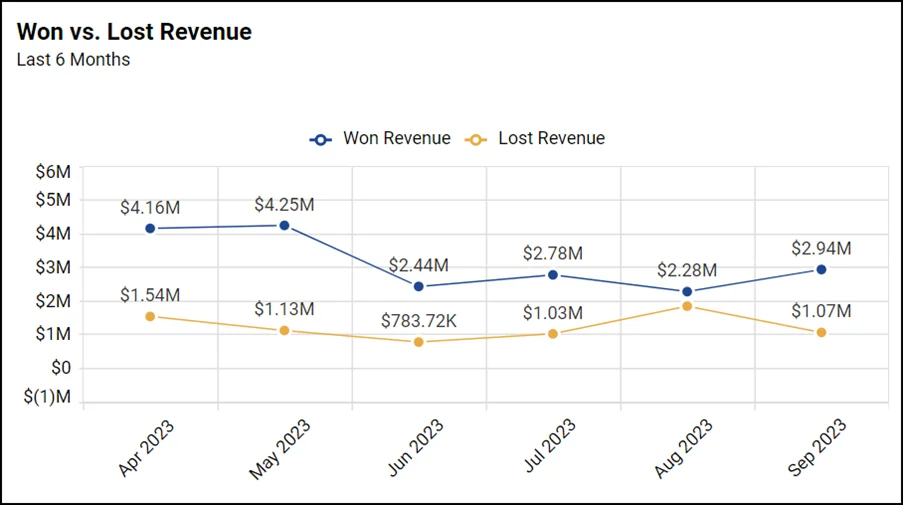
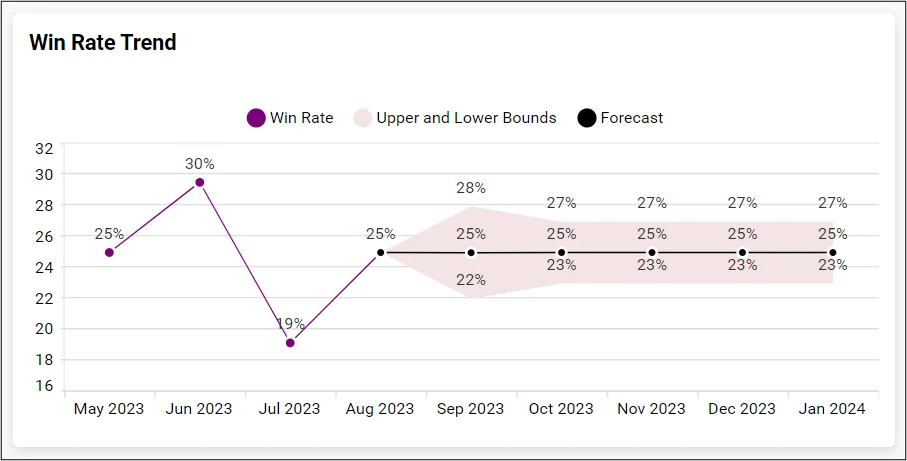
Forecasting
Historical sales trends help businesses make informed decisions, adjust strategies, allocate resources effectively, and capitalize on opportunities, ultimately driving higher sales through targeted and data-driven approaches. For example, if revenue from business-to-business transactions is increasing, sales leaders can use that information to target new businesses for more sales opportunities.
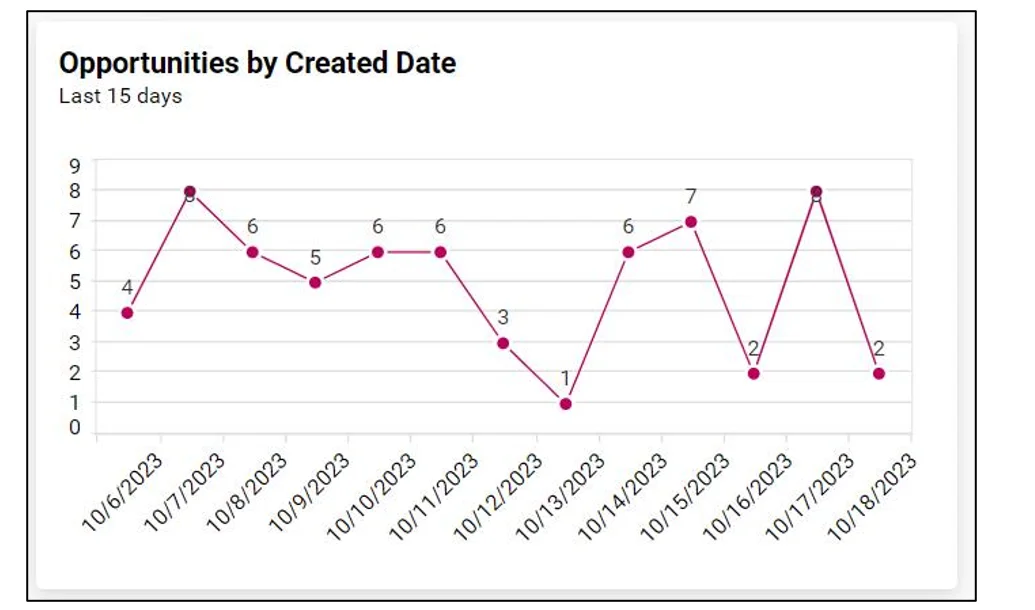
Identifying seasonality
Line charts can help identify seasonal trends in sales data, which can be used to anticipate and prepare for peak sales periods. Resources can then be allocated to capitalize on the most fruitful sales periods.
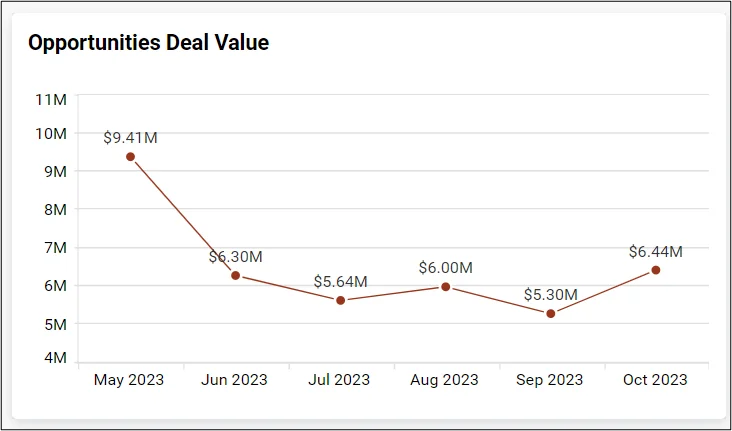
Highlighting anomalies
Any sudden spikes or drops in sales can be easily identified in a line chart, which can prompt further investigation into potential problems or opportunities.
All the previous visuals were made in Bold BI®. With Bold BI, line charts offer predictive insights, enabling users to anticipate future data points and make decisions based on trends and projections, enhancing their utility in data analysis.
Bold BI® aids in improving sales by providing easy-to-use data analytics, visualizations, and customizable dashboards to track sales opportunities. This data-driven approach allows companies understand customer behavior, identify trends, and make informed plans to boost sales.
Wrapping up, utilizing line chart representations to their full potential is key in spotting and taking advantage of sales possibilities. Businesses can optimize their sales strategies, spur revenue development, and eventually achieve sustainable success in the constantly changing world of commerce by strategically analyzing their data through line charts.
Get started with Bold BI by signing up for a free trial and create more interactive business intelligence dashboards. You can also contact us by submitting your questions through the Bold BI website or, if you already have an account, you can log in to submit your support question.