
Bold BI for Time Series Analysis
Turn Time-Based Data into Clear Trends, Patterns, and Decisions.
Time-based data exists across every business function, from sales and revenue to operations, costs, and product usage. But raw time-stamped data alone doesn’t help unless teams can clearly identify trends, recurring patterns, and changes over time.
Category
Category
Department
Industry
Data Analytics
Time series analysis
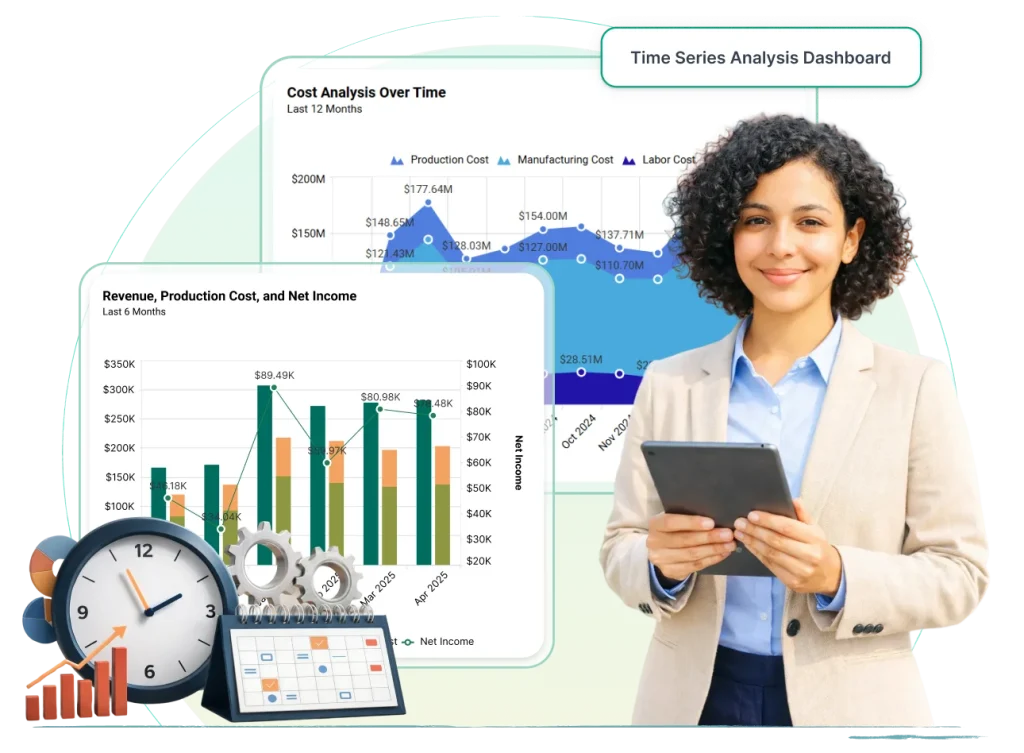
Bold BI makes time series analysis simple and actionable by visualizing historical data clearly helping teams analyze past performance, understand seasonality, and make decisions based on trends rather than assumptions.
Forecasting in Bold BI
Now, you can use Bold BI® to predict trends in your data. Our exponential smoothing model uses the weighted average of past data points to forecast future outcomes.
Also, you can add a trendline to your data series to easily perform regression analysis. We offer Linear, Exponential, Logarithmic, Power, and Polynomial trendlines to suit all your needs.
Any AI or ML use case goes through such a life cycle. Using Syncfusion’s Data Integration Platform, the ETL process to extract data from a source, transform/process it by running python machine learning scripts as scheduled and export the resultant data to the SQL server can be done with ease. This helps visualize data into meaningful insights in Bold BI.
Time Series Analysis in Industries
Energy consumption
With seasonal changes in temperature, consumer travel, and more, energy consumption and production costs can vary greatly. Time series analysis can help your team ensure you’re prepared to adapt to customers’ changing needs and meet … Learn more
Production Cost
In the manufacturing industry, you need to meet production goals while reducing rework, repairs, and labor costs. Use time series analysis to predict your plant’s equipment and personnel needs, reducing production and overtime costs by ensuring you’re prepared to meet customers’ needs. Learn more
Website User Interactivity Metrics
Marketing teams need to track various KPIs, including metrics relating to website user interactivity and seasonal variations in user activity. With time series analysis, marketing professionals can create action plans to reduce bounce and dormancy rates and increase their search engine rankings. Learn more
Seasonality Time Series
As retail sales fluctuate throughout the year, companies need to produce accurate sales forecasts to ensure they can meet consumer demand. For instance, as this graph illustrates, sales typically peak in the fourth quarter of each year, sparked by holiday discounts. Learn more
Cab Booking
Accurately forecasting customer demand is critical in the transportation industry. For example, time series analysis can help companies plan taxicab and driver availability. Plus, with Bold BI’s drill-down feature, you can view even more detailed breakdowns of your data with a simple click.
Time Series Analysis in Departments
Profit & Loss Summary
For financial professionals, tracking profits and losses is critical, this data is the basis for all the decisions a company makes. With time series analysis, you can analyze multiple financial data points by month, empowering your team to make data-driven decisions. Learn more
Project Monthly Expenses
In the information technology industry, it is crucial for each department to track project costs. For example, with a stacked view widget such as a bar chart, you can easily compare monthly expenses such as administrative, development, infrastructure, maintenance, and support costs. Learn more
Claim Amount Analysis
In the insurance industry, seasonal variations in the weather, travel habits, and more can cause significant changes to the claims that customers file. Use time series analysis to analyze claim amounts, determine when certain claims are likely to be filed, and track costs. Learn more
Why Teams Use Bold BI for Time Series Analysis
Time series data often spans months or years and comes from multiple sources, making analysis difficult with spreadsheets or static reports.
Bold BI helps by providing:
- Clear visibility into time-based trends: Analyze how metrics evolve over days, months, or years.
- Easy pattern & seasonality detection: Spot recurring cycles, peaks, and slow periods quickly.
- Interactive visual analysis: Explore trends using dynamic charts instead of manual calculations.
- Flexible analysis across use cases: Apply time series analysis to operational, financial, or performance data.
- Scalable dashboards for business users: Designed for analysts, managers, and decision-makers, not just data.
What You’ll Track
- Historical trends over time: Track how key metrics such as sales, production, costs, or usage change across days, months, or years.
- Seasonal patterns & recurring cycles: Identify predictable peaks and dips driven by seasonality, demand shifts, or external factors.
- Growth and decline patterns: Understand whether performance is improving, stabilizing, or declining over time.
- Short-term vs long-term performance: Compare recent performance against historical averages or long-term trends.
- Anomalies and unusual variations: Spot unusual spikes or drops early, before they impact performance.
All dashboards are fully customizable so you can add KPIs or metrics as needed.
Bold BI for Time Series Analysis – Common Metrics
With fully customizable dashboards, teams can analyze time-based KPIs such as:
- Revenue, expenses, and profit trends
- Demand, usage, and consumption patterns
- Seasonal peaks and off-cycle dips
- Forecasted values and growth projections
- Performance comparisons across time periods
- Variance between actuals and forecasts
Dashboards can be tailored for analysts, department heads, leadership teams, and operational users.
Analytics that Wins Awards and Users.
Recognized by G2, TrustRadius and Visual Studio Magazine for delivering standout performance and value.
I appreciate Bold BI for making it easier to provide reporting for our customers, allowing both our analysts and customers to easily build and publish reports. The ability to build dashboards and modify queries for specific outcomes is very user-friendly. I value the mobile readiness of the app and its integration capabilities with API structures. The addition of AI features is impressive. The economic pricing model and the effective partnership, which includes consistent and helpful support, make it an invaluable tool for our OEM model.
Ravi S.

The support from Bold is unmatched. They do not charge extra for support and it is excellent anyway. All our tickets and questions are quickly answered with authoritative and precise guidance. This is important at the product is complex, powerful and mature. To get the most out of the tool, the level of support they provide is essential.
Murph M.
It was easy to implement data visualizations into our product. The standard widgets allowed us to build professional looking dashboards, and a robust API provided excellent control of the development and runtime process from within our application.
Scott Y.
Users Love Us
Visual Studio Reader's Choice - 2025
Leader - Fall 2025
High Performer - Fall 2025 EMEA
Regional Leader - Fall 2025 AMERICAS
TrustRadius Tech Cares
Capterra - 4.9/5
G2- 4.4/5
GetApp - 4.9/5
Software Advice - 4.9/5
Frequently Asked Questions
More Articles About Time Series Analysis Dashboard Examples
- What is Time Series Analysis? Why You Need It & Use Cases
This blog explains the fundamentals of time series analysis, including identifying trends, seasonality, and patterns in historical data to support better forecasting and decision-making.
- How Data Dashboards Simplify Business Decisions
This blog covers the basics of data dashboards, including filters and embedding techniques, with examples that enable seamless interactivity for tracking trends in any business context.
- BI Unleashed: Data-Driven Solutions for Business Growth
Discover how business intelligence (BI) can optimize sales strategies, enhance customer segmentation, track marketing ROI, streamline supply chain operations, improve inventory management, and elevate customer experiences for sustainable business growth.
Start your 30-day free trial instantly
Easy integration, AI-Powered Dashboards and 24x5 real-time support.