Bold BI 2025 Recap: Key Highlights, Awards & Success Stories

TL;DR: 2025 was a big year for Bold BI®—both in what we shipped and in how customers used it to deliver embedded analytics at scale. This Bold BI 2025 recap highlights the year’s biggest platform improvements, AI-driven capabilities, connectivity and deployment upgrades, customer recognition, and success stories that validated its impact. If you’re building analytics into an application, you’ll see what changed in 2025, why it matters, and what it enables for 2026.
Introduction
Shipping embedded analytics isn’t just about visualizing data—it’s about delivering an experience that’s fast to build, easy to understand, and reliable at scale. In 2025, Bold BI focused on removing the friction that slows teams down, from insight interpretation and AI context loss to performance bottlenecks and complex infrastructure requirements. The year brought meaningful platform improvements alongside real customer adoption and recognition.
Here’s is a look at Bold BI’s key 2025 year-end recap highlights, followed by what customers shared about their experience, the industry recognition earned during the year, and a brief look at the goals shaping what comes next in 2026. Let’s get started.
Bold BI’s Top Analytics Highlights in 2025
In this recap, we summarize how the platform evolved to help teams build, embed, and scale analytics more effectively—by improving insight discovery, platform performance, data connectivity, and deployment reliability.
1. Faster insights with AI that stays in context
Embedded analytics slows down when users keep asking “what does this mean?” and AI sessions don’t carry context forward. In 2025, Bold BI made AI more usable for product teams, developers, and stakeholders by keeping conversations connected and bringing AI help into embedded experiences—so people can get answers faster with less back-and-forth.
Updates include unified AI chat history, SDK-embedded AI Assistant, Bring-Your-Own-Key (BYOK) model, and AI Agent (beta) enhancements like dashboard summary, automatic dashboard creation, and widget insights to speed up interpretation and decision-making.
2. Faster, more reliable performance at scale
As dashboards and usage grow, performance issues quickly become product issues. Bold BI’s 2025 platform improvements help teams keep embedded dashboards responsive and stable under heavy workloads and higher concurrency.
Bold BI upgraded core services from .NET 6.0 to .NET 8.0, improving execution speed, efficiency, and stability—especially for complex dashboards and production-scale usage.
3. Richer dashboards with modern visuals and stronger data modeling
Dashboards are only effective when they communicate clearly and reflect real data relationships. In 2025, Bold BI improved dashboard expressiveness and modeling so teams can build cleaner datasets and more understandable reports with less manual effort.
This includes 12 new V2 chart types and support for one-to-many and many-to-many relationships, helping teams reduce workarounds and scale dashboards as data complexity grows.
4. Expanded data connectivity with unified connector support
Analytics projects stall when teams rely on exports, manual refresh steps, or custom integrations to access key systems. In 2025, Bold BI expanded connectivity so teams can bring more enterprise and modern data sources into dashboards with less integration effort.
New additions include NetSuite, Trino (Presto category), Microsoft Fabric, DB Atlas SQL (ODBC Mongo), Neo4j (ODBC), Salesforce Reports (Data Hub), plus Data Hub destinations like IBM DB2, Teradata, SAP HANA Cloud, and Firebolt.
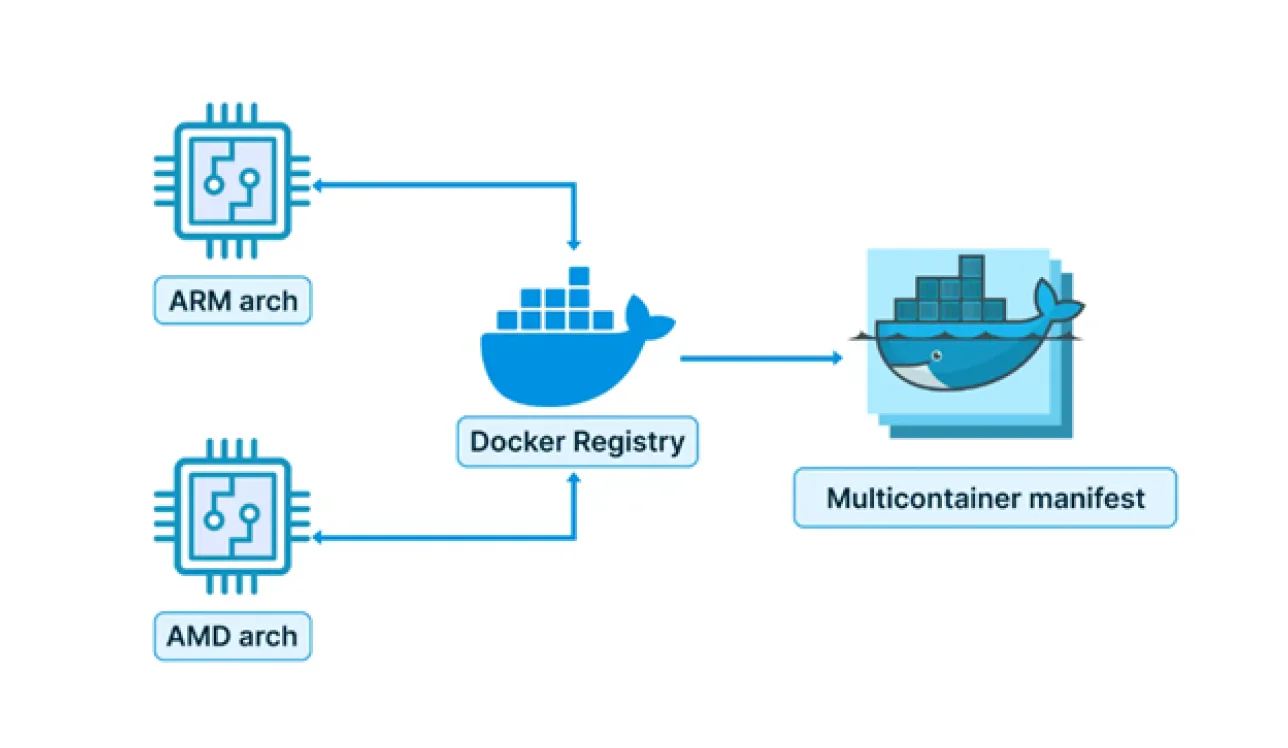
5. Simplified deployment and operations across modern infrastructure
Even great dashboards fail if deployments are hard to standardize across environments. In 2025, Bold BI reduced operational friction for DevOps and enterprise teams running Kubernetes, mixed AMD/ARM infrastructure, and cloud storage setups.
Key improvements include multicontainer manifest support for AMD and ARM, RPM-based deployment, Amazon S3, Oracle File Storage support, and Oracle database su
6. Low-friction embedded access without compromising control
Customer portals often need “no-login” analytics, but teams still need permission control. In 2025, Bold BI improved embedded sharing so organizations can reduce access friction without opening up data. Anonymous embedding is now supported based on group permissions, making it easier to deliver external dashboards while still enforcing governed visibility.
Now that you’ve seen Bold BI’s key analytics advancements in 2025, let’s explore how customers put these updates into action—and the real-world impact they delivered across industries and deployments.
What Customers Said About Bold BI in 2025
Product updates matter most when they solve real problems in real time. In 2025, customers consistently highlighted how Bold BI helped them deliver embedded analytics faster, integrate with diverse data sources, and scale dashboards reliably—supported by responsive documentation and support. Here is a sample review received in Bold BI:
To explore more verified customer reviews and experiences, visit the Bold BI case study website.
In addition to these case studies, we have also received customer recognition that reflects our commitment to delivering exceptional service. Here are some examples of the positive feedback shared by our customers.
Powerful, Flexible Analytics Platform with Intuitive Design and Excellent Support!
“Bold BI provides a powerful and flexible analytics platform that is easy to implement and integrate with various data sources. The dashboard designer is intuitive, allowing both technical and non-technical users to build meaningful visualizations quickly. Its ability to connect directly to databases, APIs, and web services makes it highly suitable for enterprise-level reporting. I also appreciate the strong customization options, embedding capabilities, and the overall performance when handling large datasets. Customer support has also been responsive and helpful whenever assistance is needed.”
By Mohamed Zulfadli A. Source G2
Another user described Bold BI as an “incredible platform to build needed dashboards,” highlighting its ease of use and flexibility for connecting to diverse data sources. This reinforces Bold BI’s commitment to simplifying analytics for businesses of all sizes.
Embedded analytics that’s fast, secure, and easy to ship!
“We use Bold BI for embedded analytics inside our HR/payroll portals. The drag-and-drop dashboard designer, strong row-level security, and straightforward embedding SDKs let us ship customer-facing dashboards quickly. Native connectors (databases + REST), parameters/filters, scheduled refresh, and export to PDF/Excel cover most stakeholder needs. White-labeling and SSO (OAuth/SAML) made the UX feel truly “ours,” and support has been responsive when we needed help. Overall, it strikes a great balance between speed and value, as well as enterprise controls.”
By Nirbhay K. Source G2
To explore more customers reviews, visit the Bold BI G2 review.
Now, let’s explore external recognition. Here are the major awards and badges Bold BI earned in 2025.
Bold BI Recognition In 2025
In 2025, Bold BI was celebrated by industry experts and customers worldwide for its AI-powered analytics, dependable embedded BI experiences, and enterprise-ready performance—earning recognition across major awards programs and user review platforms. These recognitions include:

- Gold winner in “AI/Cognitive Services & Machine Learning” at the 2025 Visual Studio Magazine Reader’s Choice Awards — Bold BI.
- Bronze winner in “BI, Business Desktop Deployment (BDD) & BI Development Studio” at the 2025 Visual Studio Magazine Reader’s Choice Awards — Bold BI.
- G2 Spring 2025 (5 badges): High Performer (EMEA), High Performer (Enterprise), High Performer (overall), High Performer (Small Business), and Easiest Admin (Small Business) — Bold BI.
- G2 Summer 2025 (5 badges): Grid Leader, High Performer (EMEA & Asia), High Performer (Small Business), High Performer Americas Region (Small Business), and Analytics Platforms High Performer (Enterprise) — Bold BI.
- G2 Fall 2025 (10 badges): High Performer (Analytics Platforms – EMEA), High Performer (Analytics Platforms – Small Business EMEA), Leader (Business Intelligence), Leader (Business Intelligence – Mid-Market), Leader (Business Intelligence – Small Business), Leader (Embedded BI – Americas), Leader (Embedded BI – EMEA), Leader (Embedded BI – overall), Leader (Embedded BI – Small Business Americas), and Leader (Embedded BI – Small Business) — Bold BI.
This shows our commitment to building analytics that teams can trust—delivering AI-powered analytics capabilities, reliable embedded experiences, and enterprise-ready performance that consistently earns recognition from both industry experts and real users. To explore more verified customer reviews and experiences, visit Bold BI reviews on G2.
With a strong year behind us, the next question is what we’re building toward. Here’s a quick look at Bold BI goals for 2026.
Bold BI Goals for 2026
Looking ahead, Bold BI’s 2026 roadmap focuses on making analytics more automated, AI more transparent and adaptable, and platform operations easier to manage at scale. Key highlights include language support for AI Assistant, column-level security support, gateway API support for Kubernetes deployment, headless ETL architecture, synonym mapping for domain terminology, and more. Together, these efforts aim to help teams deploy, migrate, and operate embedded analytics with greater confidence, flexibility, and long-term stability.
To explore these new features and enhancements in detail, visit the Bold BI roadmap website.
What Should You Do Next?
I hope this Bold BI® 2025 year-end recap provides a clear, practical look into the key highlights you need to know to plan your next analytics release with confidence. Whether you’re evaluating Bold BI or already using it, here are practical next steps to get value from the Bold BI 2025 recap:
- Try AI-driven dashboard creation to generate a first draft faster, then refine it into a production-ready dashboard.
- Enable Smart Summaries and AI Assistant so stakeholders can understand dashboards quickly and explore insights using natural language.
- Validate performance with your real workload after the .NET 8 upgrade—test dashboard load time, rendering speed, and concurrency with larger datasets.
- Optimize your data pipeline with the Extract Engine and choose a preferred extraction engine in the data source settings to tune ingestion for your environment.
- Confirm your deployment approach if you use containers—multicontainer manifest support helps standardize deployments across AMD and ARM.
- Review your data model and access setup by using complex relationships (one-to-many/many-to-many) and anonymous access options with audit logging where needed.
Ready to explore these updates in action? Start a free trial to build and embed a sample dashboard with your own data, or contact our team for guidance on the best setup for your application and deployment environment.
Frequently Asked Questions
- 1.
What were Bold BI’s major achievements in 2025?
Bold BI introduced AI-powered analytics features like AI Assistant, Smart Summaries, and automatic dashboard creation. It also expanded data integrations, added new data connectors, and improved performance with .NET 8 migration.
- 2.
What new AI features were introduced in 2025?
Key AI features include natural language responses via AI Assistant, AI text summarization, automatic dashboard creation using NLP, and a unified AI agent for consistent workflows.
- 3.
How does Bold BI support embedded analytics?
Bold BI offers seamless embedding with white-labeling options, supports major frameworks like React, Angular, Vue, and Blazor, and provides over 120 data connectors for real-time dashboards.
- 4.
What deployment options are available for Bold BI?
You can deploy Bold BI on Windows, Linux, Docker, Kubernetes, or cloud environments like Azure and AWS, ensuring flexibility for different IT infrastructures.