Protect Margins, Improve Safety, and Control Projects in Real Time.
Construction leaders manage large volumes of projects, safety, and cost data every day. Beyond revenue, cost, and profit, teams must closely monitor work quality, safety incidents, material availability, equipment usage, and workforce performance. Managing all this alongside daily job site demands quickly become overwhelming.
Bold BI simplifies construction analytics by bringing all critical project, operational, and financial KPIs into one interactive dashboard, making it easier to monitor performance in real time and act quickly when issues arise.
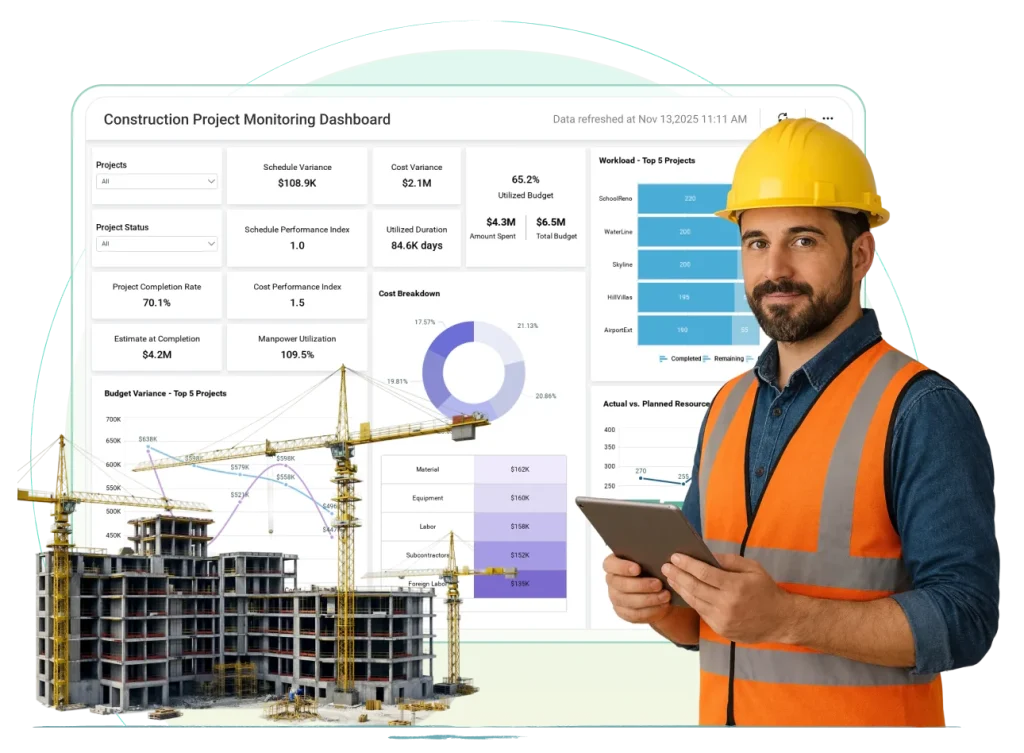
Construction Project Monitoring
Track project statuses and stages, budget details, and more.
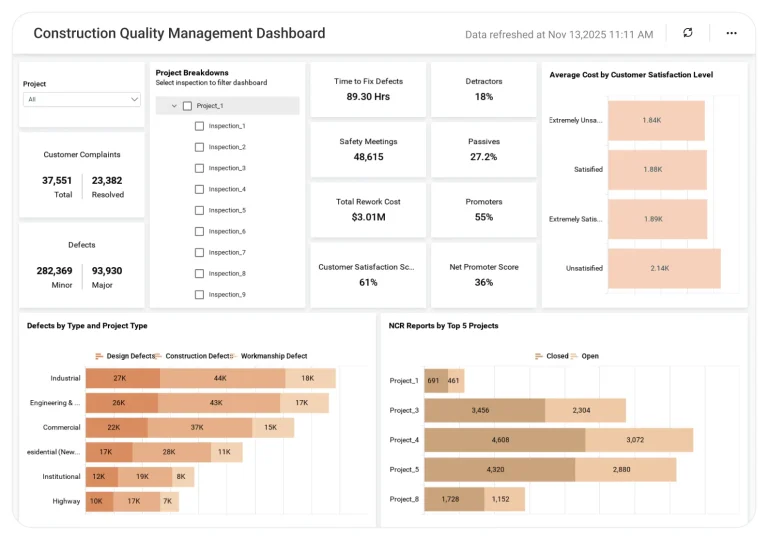
Construction Quality Management
Track safety meetings, defect details, customer satisfaction, and more.
Why Construction Teams Choose Bold BI
Construction data often comes from multiple sources such as project management tools, ERP systems, safety logs, spreadsheets, and site reports, making it hard to get a clear, unified view.
Bold BI solves this by delivering:
Unified project visibility: Track cost, progress, safety, quality, and resources in one place.
Real-time job site insights: Monitor site-level metrics as they update, without manual reporting.
All dashboards are fully customizable, allowing you to add KPIs or metrics as needed.
Bold BI for the Construction Industry – Common Metrics
With Bold BI’s user-friendly, fully customizable, interactive dashboards, you can track all the key performance indicators construction experts depend on:
Incident rate
Number of defects
Rework costs
Project stages
Budget details
Workload statuses
How It Works (Quick Setup)
Connect data from project management tools, ERP systems, Excel, SQL, or Web APIs.
Use pre-built construction dashboard templates or create custom dashboards.
Blend project, safety, quality, and financial data.
Share dashboards securely with project teams and leadership.
Set alerts for safety incidents, cost overruns, or schedule delays.
Trusted & recognized
Analytics that Wins Awards and Users.
Recognized by G2, TrustRadius and Visual Studio Magazine for delivering standout performance and value.
I appreciate Bold BI for making it easier to provide reporting for our customers, allowing both our analysts and customers to easily build and publish reports. The ability to build dashboards and modify queries for specific outcomes is very user-friendly. I value the mobile readiness of the app and its integration capabilities with API structures. The addition of AI features is impressive. The economic pricing model and the effective partnership, which includes consistent and helpful support, make it an invaluable tool for our OEM model.
Ravi S.
The support from Bold is unmatched. They do not charge extra for support and it is excellent anyway. All our tickets and questions are quickly answered with authoritative and precise guidance. This is important at the product is complex, powerful and mature. To get the most out of the tool, the level of support they provide is essential.
Murph M.
It was easy to implement data visualizations into our product. The standard widgets allowed us to build professional looking dashboards, and a robust API provided excellent control of the development and runtime process from within our application.
Scott Y.
RECOGNITION
Users Love Us
Visual Studio Reader's Choice - 2025
Leader - Fall 2025
High Performer - Fall 2025 EMEA
Regional Leader - Fall 2025 AMERICAS
TrustRadius Tech Cares
Capterra - 4.9/5
G2- 4.4/5
GetApp - 4.9/5
Software Advice - 4.9/5
Frequently Asked Questions
Yes. Bold BI supports near real-time data updates, allowing teams to monitor job site performance as it happens.
Absolutely. Dashboards can be filtered and drilled down by project, site, location, or crew.
By tracking defect trends, root causes, and time-to-fix metrics, teams can address quality issues early.
Yes. Bold BI enables tracking safety meetings, incident rates, and long-term safety trends.
This blog explains how construction analytics dashboards help teams monitor defects, rework, safety metrics, and quality indicators to improve overall project outcomes.
This blog shows how embedded analytics enables construction teams to access project, safety, and cost insights directly within their operational systems for faster decision-making.
Discover how business intelligence (BI) can optimize sales strategies, enhance customer segmentation, track marketing ROI, streamline supply chain operations, improve inventory management, and elevate customer experiences for sustainable business growth.
Ready to Get Started?
Start your 30-day free trial instantly
Easy integration, AI-Powered Dashboards and 24x5 real-time support.