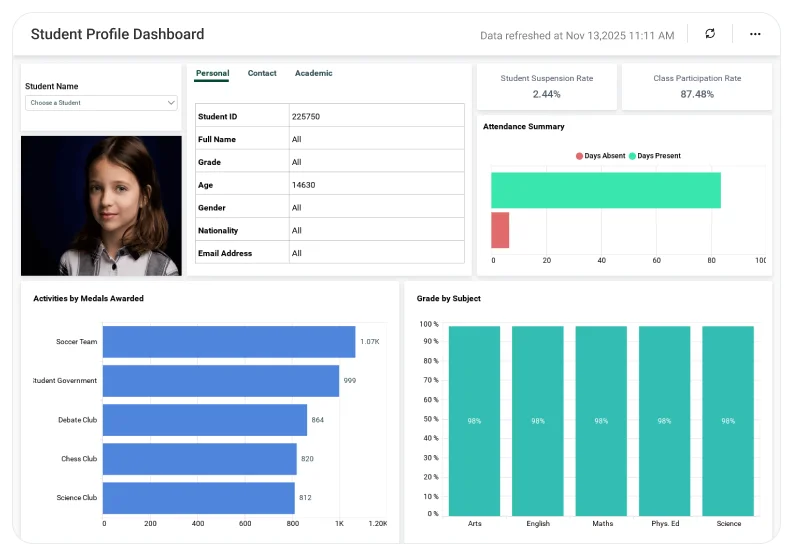
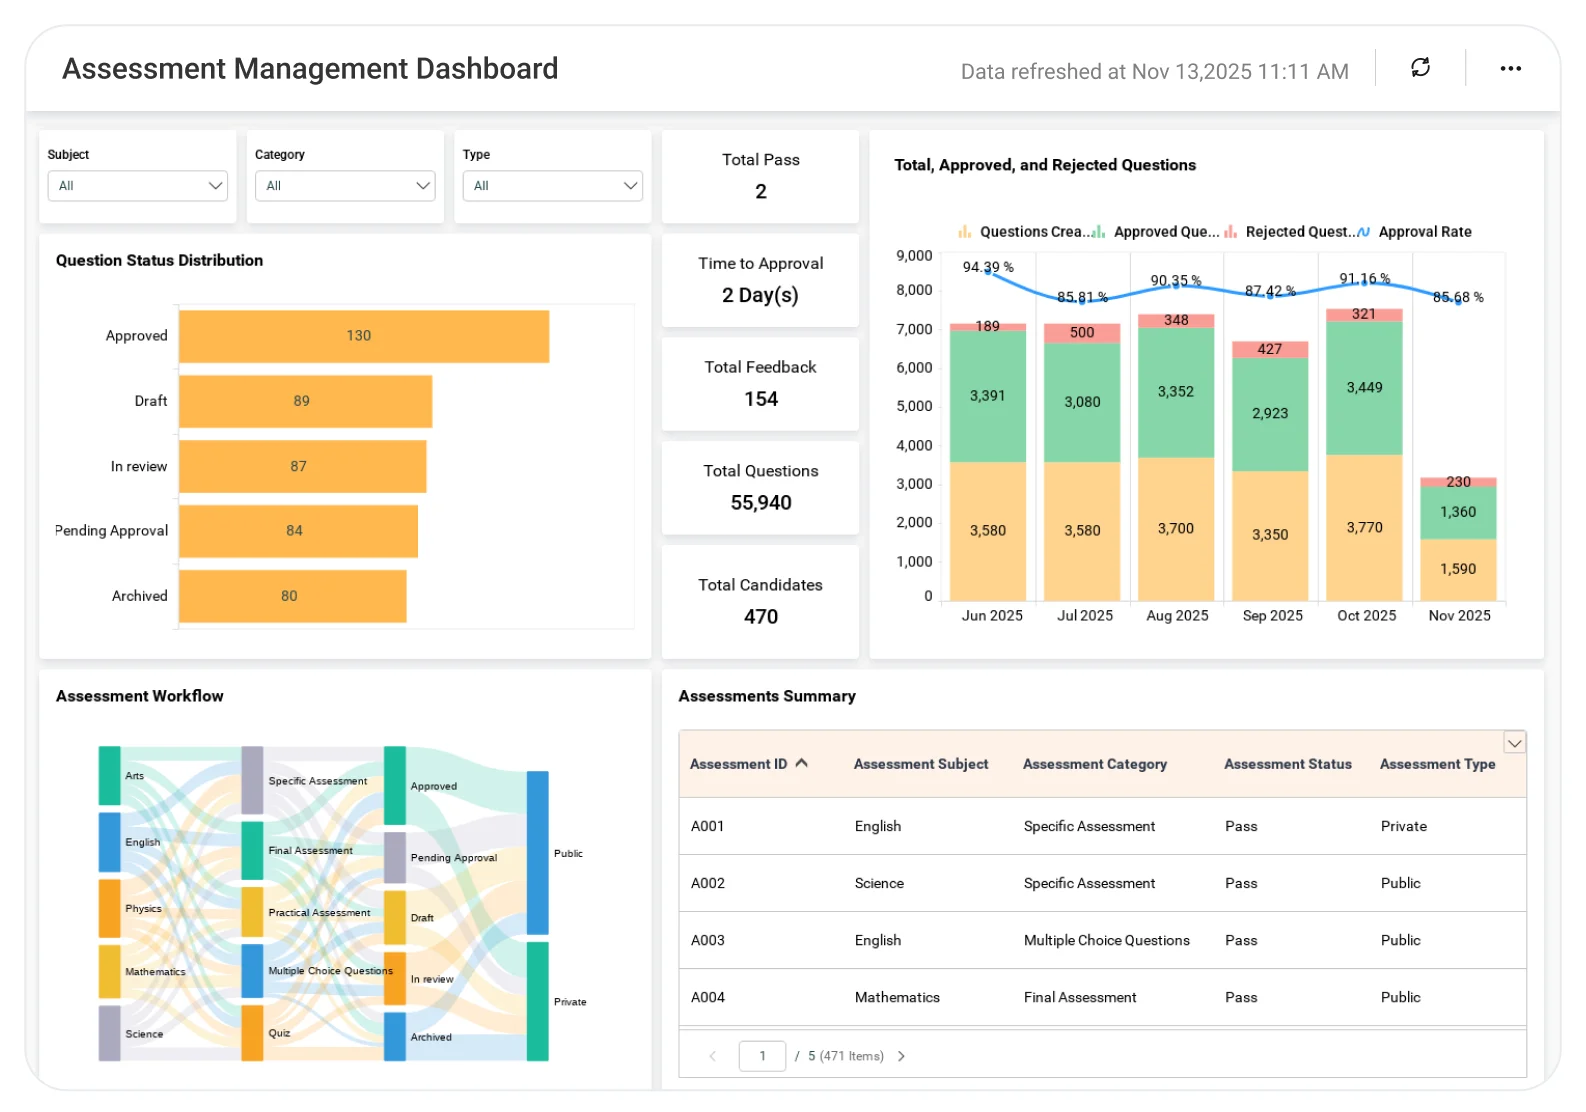
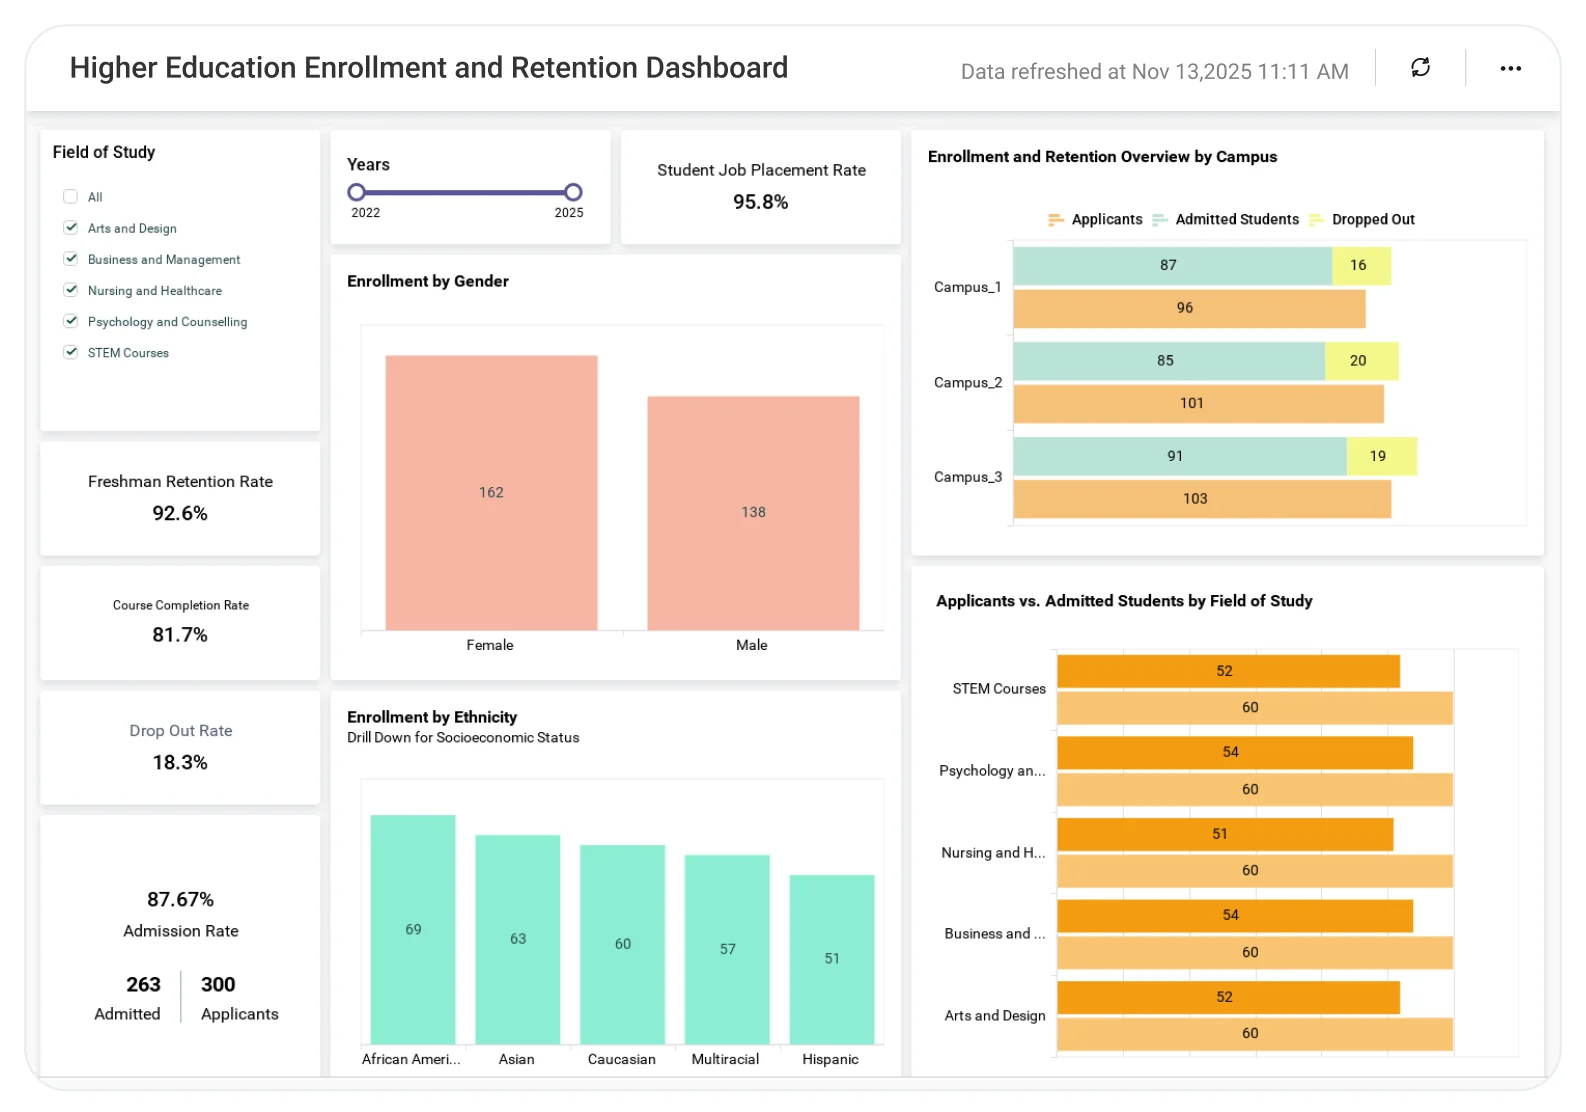
Student success depends on timely, accurate data. Administrators, teachers, and district leaders need clear visibility into enrollment, attendance, academic performance, and program outcomes to make informed decisions. Bold BI helps education teams track critical KPIs in one place, turning data from multiple systems into insights that support better planning and improved student outcomes.
Bold BI helps education teams track critical KPIs in one place, turning data from multiple systems into actionable insights that support better planning and improved student outcomes.
Unified Student Visibility: Track performance, attendance, and behavior over time to gain a holistic view of student progress.
Operational Clarity: Understand enrollment trends, staffing needs, and resource allocation for smoother academic operations.
Academic Accountability: Measure test scores, graduation rates, and assessment outcomes to ensure institutional success.
Data-Driven Interventions: Identify learning gaps early and provide targeted support to improve student outcomes.
Secure Analytics: Protect sensitive data with role-based access, self-hosted options, and regulation-ready deployment.
What You’ll Track
Bold BI’s customizable dashboards put the education KPIs you depend on at your fingertips, making it easy to improve transparency, efficiency, and student success.
Student Performance: Track overall academic progress by monitoring grades, GPA trends, attendance rates, and assessment results to identify areas where students need additional support and ensure consistent performance across subjects.
Faculty Productivity: Measure teaching efficiency by analyzing planned versus actual teaching hours, syllabus completion, and student-to-teacher ratios to optimize faculty workload and maintain high-quality instruction.
Operational Metrics: Improve resource utilization by tracking classroom occupancy, library usage, and participation in extracurricular activities, ensuring that facilities and programs are effectively supporting student engagement.
Financial Metrics: Gain insights into institutional finances by monitoring tuition revenue, scholarship allocations, and operational expenses to maintain financial health and allocate resources strategically.
Student Experience: Enhance satisfaction by visualizing feedback scores, tracking counseling and academic support requests, and measuring participation in campus events to create a positive and engaging learning environment.
Bold BI for Education – Common Metrics
With Bold BI’s customizable dashboards, you can keep an eye on the indicators that matter most for student and school success, including:
Attendance rates
Enrollment trends by grade or school
Exam scores and subject performance
Rates of graduation and retention
Teacher-to-student ratios
Course completion and LMS engagement
Districtwide academic comparisons
How It Works
Connect Your Data Sources: Seamlessly integrate LMS, assessment data, Excel files, SQL databases, or cloud storage.
Pick or Customize Dashboards: Start with ready-made education dashboard samples or design your own tailored views.
Blend Key Insights: Combine academic, operational, and behavioral data to answer critical questions such as:
How are students performing by grade or subject?
Which schools or classrooms need extra support?
Are enrollment and attendance trends improving?
Collaborate Securely: Share dashboards with teachers, principals, and district leaders using role-based access.
Stay Proactive: Set up alerts for declining performance, attendance issues, or operational risks.
Trusted & recognized
Analytics that wins awards and users
Recognized by G2, TrustRadius, and Visual Studio Magazine for delivering standout performance and value.
I appreciate Bold BI for making it easier to provide reporting for our customers, allowing both our analysts and customers to easily build and publish reports. The ability to build dashboards and modify queries for specific outcomes is very user-friendly. I value the mobile readiness of the app and its integration capabilities with API structures. The addition of AI features is impressive. The economic pricing model and the effective partnership, which includes consistent and helpful support, make it an invaluable tool for our OEM model.
Ravi S.
The support from Bold is unmatched. They do not charge extra for support and it is excellent anyway. All our tickets and questions are quickly answered with authoritative and precise guidance. This is important at the product is complex, powerful and mature. To get the most out of the tool, the level of support they provide is essential.
Murph M.
It was easy to implement data visualizations into our product. The standard widgets allowed us to build professional looking dashboards, and a robust API provided excellent control of the development and runtime process from within our application.
Scott Y.
RECOGNITION
Users Love Us
Visual Studio Reader's Choice - 2025
Leader - Fall 2025
High Performer - Fall 2025 EMEA
Regional Leader - Fall 2025 AMERICAS
TrustRadius Tech Cares
Capterra - 4.9/5
G2- 4.4/5
GetApp - 4.9/5
Software Advice - 4.9/5
Frequently Asked Questions
Bold BI consolidates LMS and assessment data into a single dashboard, making it easier to identify learning gaps and take action.
Yes! Bold BI connects with LMS platforms, assessment databases, and any system that supports API or data export.
Absolutely. Role-based access ensures everyone sees only the KPIs relevant to their role.
Yes. Bold BI supports secure on-premises deployment for institutions that need full control over their data.
Many schools can start visualizing core KPIs quickly, depending on data sources and setup complexity.