Monitor your investments and business performance with financial dashboards. Track key balance sheet figures like income, assets, and equity.
Finance teams play a critical role in maintaining profitability, controlling costs, and guiding strategic business decisions. For example, you may need to analyze accounts receivable and accounts payable reports. At the same time, you may also need to track balance sheet figures like assets, liabilities, and equity.
Bold BI brings all financial data into one unified analytics platform, helping finance teams move from static reports to proactive budgeting, forecasting, and cost management.
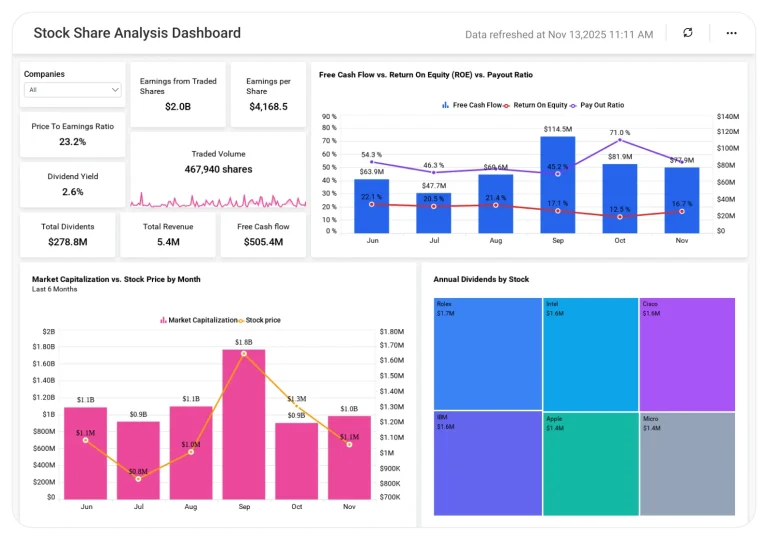
Stock Share Analysis Dashboard
Monitor stock performance in real-time, analyze market trends, and evaluate investment opportunities efficiently.
Harvest Financial and Invoicing Insights Dashboard
Track budgeted versus tracked hours, project progress, tracked hours by assignee, and more.
QuickBooks Cash Flow Dashboard
Analyze cash inflows, outflows, and balances for advanced financial decision-making.
Online Accounting Dashboard
Track profits, expenses, invoice statuses, and more.
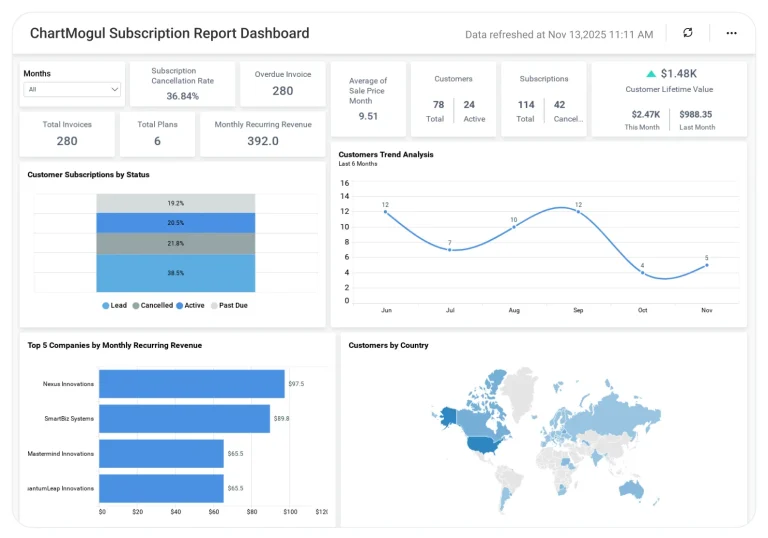
Subscription Management Dashboard
Track revenue, AR numbers, subscription details, and more.
Profit and Loss Dashboard
Track profit margin, revenue and expense details, and customer growth.
Analyze every dimension of subscription revenue, including transaction counts, customers, cancellation rate, and monthly recurring revenue trends.
Financial Management Dashboard
Track AR and AP numbers, net working capital, current ratio, and more.
Balance Sheet Dashboard
Track key financial metrics to ensure your company’s long-term success.
Budget vs Actual Dashboard
Track income and expenses by category to manage your company’s finances.
Why Finance Departments Choose Bold BI
Financial data often resides across multiple systems such as, ERPs, accounting platforms, budgeting tools, Excel files, and databases, making consolidation slow, manual, and prone to errors.
Bold BI solves this by delivering:
Unified financial visibility: Combine budgets, actuals, forecasts, revenue, and expenses into a single source of truth.
Faster access to financial insights: Instantly identify variances, trends, and risks without manual spreadsheet work.
Improved cost control: Track spending patterns and detect cost overruns before they impact profitability.
Stronger planning & forecasting: Use historical trends and variance analysis to improve future budget accuracy.
Enterprise-grade security: Governed access with role-based permissions, row-level security, and secure deployment options.
What You’ll Track
Budget vs. actual performance: Compare planned budgets with real income and expenses to catch variances early.
I appreciate Bold BI for making it easier to provide reporting for our customers, allowing both our analysts and customers to easily build and publish reports. The ability to build dashboards and modify queries for specific outcomes is very user-friendly. I value the mobile readiness of the app and its integration capabilities with API structures. The addition of AI features is impressive. The economic pricing model and the effective partnership, which includes consistent and helpful support, make it an invaluable tool for our OEM model.
The support from Bold is unmatched. They do not charge extra for support and it is excellent anyway. All our tickets and questions are quickly answered with authoritative and precise guidance. This is important at the product is complex, powerful and mature. To get the most out of the tool, the level of support they provide is essential.
It was easy to implement data visualizations into our product. The standard widgets allowed us to build professional looking dashboards, and a robust API provided excellent control of the development and runtime process from within our application.
I was looking for an solution for internal dashboarding, BoldBI was priced well, easy to understand, and well documented. I mean really well documented. Great deployment options, a JS SDK, and did i mention the documentation?
BoldBI was just right for what i needed, not too complicated, not too simple. I can train users on dashboards, or write my own custom controls. Best of both worlds.
Frequently Asked Questions
Yes. Bold BI supports department-wise, cost-center-wise, and entity-level reporting, allowing both consolidated and individual financial analysis.
Absolutely. Bold BI scales easily, from growing finance teams managing budgets to large enterprises handling complex financial operations.
Yes. Finance teams can drill from high-level dashboards down to monthly, category-level, or transaction-level details.
By analyzing historical trends, recurring variances, and cost drivers, finance teams can create more realistic, data-backed budgets.
This blog explains how embedded analytics helps finance teams gain real-time visibility into budgets, expenses, and financial performance directly within their financial systems.
Discover how business intelligence (BI) can optimize sales strategies, enhance customer segmentation, track marketing ROI, streamline supply chain operations, improve inventory management, and elevate customer experiences for sustainable business growth.
Start your 30-day free trial instantly
Easy integration, AI-Powered Dashboards and 24x5 real-time support.