15 Essential KPI Dashboard Examples for Your Business

Introduction
As companies keep adopting new technologies, making decisions based on data is more important than ever. One helpful tool for this is a KPI dashboard, which allows businesses to monitor key metrics and assess their performance effectively. By using KPI dashboards, companies can get real-time information, make better choices, and stay updated on market trends. In this blog, we’ll look at 15 best KPI dashboards examples that can help different industries succeed. These dashboards will assist you in improving your strategies and keeping your business on track for steady growth.
15 Best KPI Dashboard Examples for Your Business
KPI dashboards help businesses in all industries see the story that lives behind their data by presenting it graphically. Let’s take a closer look at these KPI dashboard examples every business should embed in their application.
1. Construction Dashboard Example
Construction project monitoring
Embedding a construction project monitoring dashboard will help you display KPIs such as project stages, budget details, and resource allocation in your application to enable managers to monitor project statuses for various locations, track KPI performance, and act on insights to improve growth.
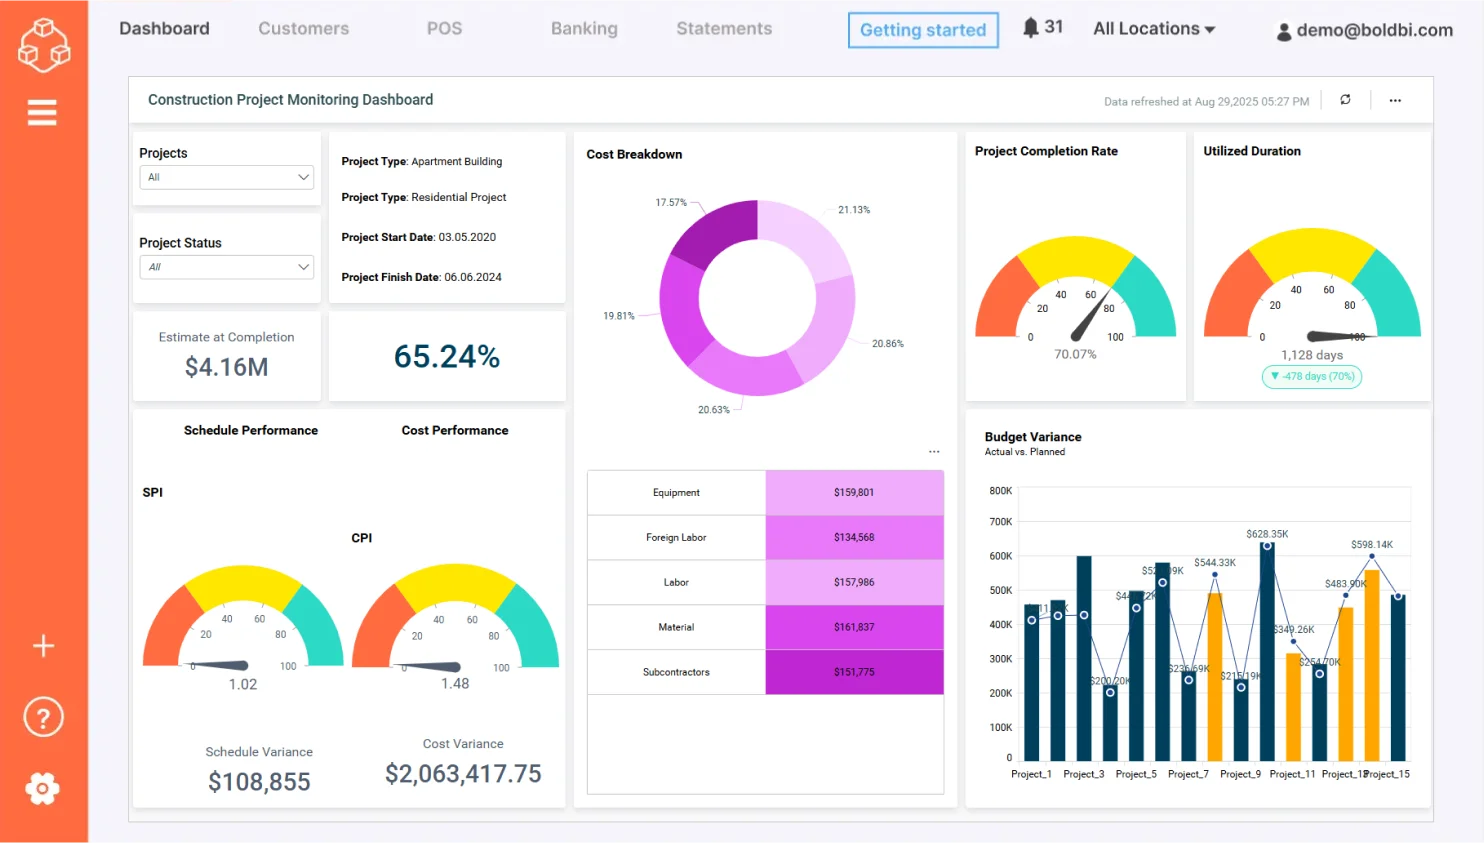
With the dashboard, you can track:
- Project Stages: Displays the current phase of each construction project (e.g., planning, execution, completion).
- Budget Details: Monitors budget allocation, usage, and variances across projects.
- Resource Allocation: Tracks the distribution and usage of labor, equipment, and materials.
- Timeline Adherence: Highlights delays or progress against planned schedules.
Check out more of our interactive dashboard solutions for government.
2. Education Dashboard Example
Higher education enrollment and retention
Embedding the higher education enrollment and retention dashboard will help you track enrollment trends, advanced coursework data, and budget details in the same application, allowing administrators to visualize important KPIs related to student enrollment at your college based on ethnicity, courses, gender, and age.
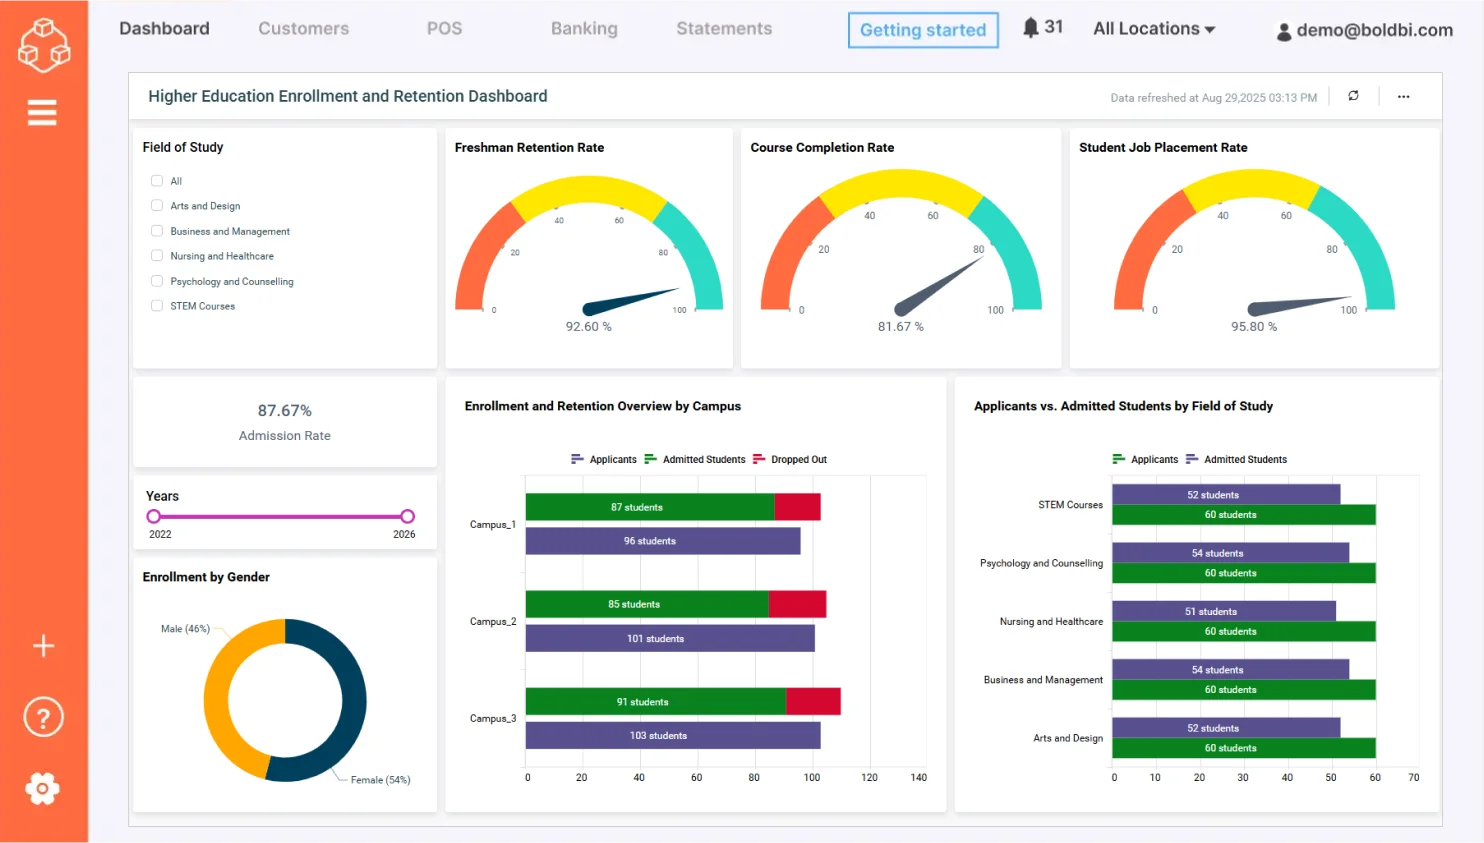
This dashboard helps you track:
- Student attendance percentage: Shows the percentage of overall student attendance.
- Course completion rate: Shows the percentage of students who successfully completed their courses.
- Freshman retention rate: Shows the percentage of students who were retained by the same institution.
- Teacher-to-student ratio: Shows the number of students assigned to a teacher in an institution.
Check out more of our interactive dashboard solutions for education.
3. Energy Dashboard Example
Power plant monitoring
Having the power plant monitoring dashboard embedded into your application helps you monitor live production data for a power plant. Total capacity, running capacity, and details of other various parameters—such as ambient temperature, humidity, frequency—can be monitored in order to identify problems and take appropriate action.
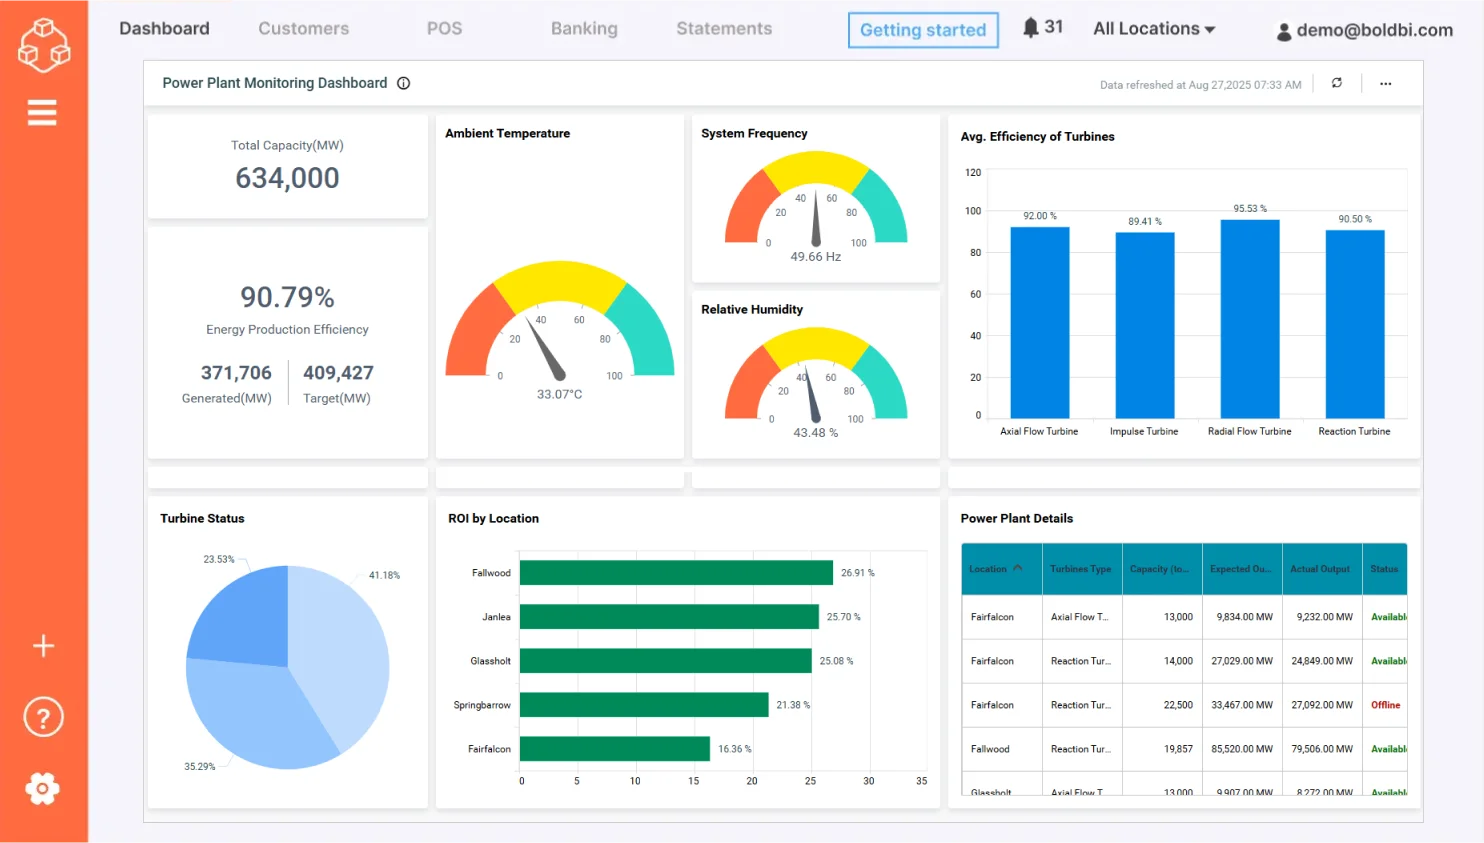
With the dashboard, you can track:
- Total capacity: Shows the total capacity of the power plant to produce energy.
- Energy generated: Shows the energy generated by the power plant.
- Return on investment (ROI): Shows the percentage revenue earned on investments.
- Average efficiency of turbines: Measures the performance of each type of turbine.
Check out more of our interactive dashboards for the energy sector.
4. Government Dashboard Example
Motor vehicle crash analysis
Embedding the motor vehicle crash analysis dashboard into your application makes it easier for you to get insight into motor vehicle crashes that happened in multiple states of the U.S. along with primary and secondary contributing factors, which in turn enables you to take precautionary measures to prevent such accidents.
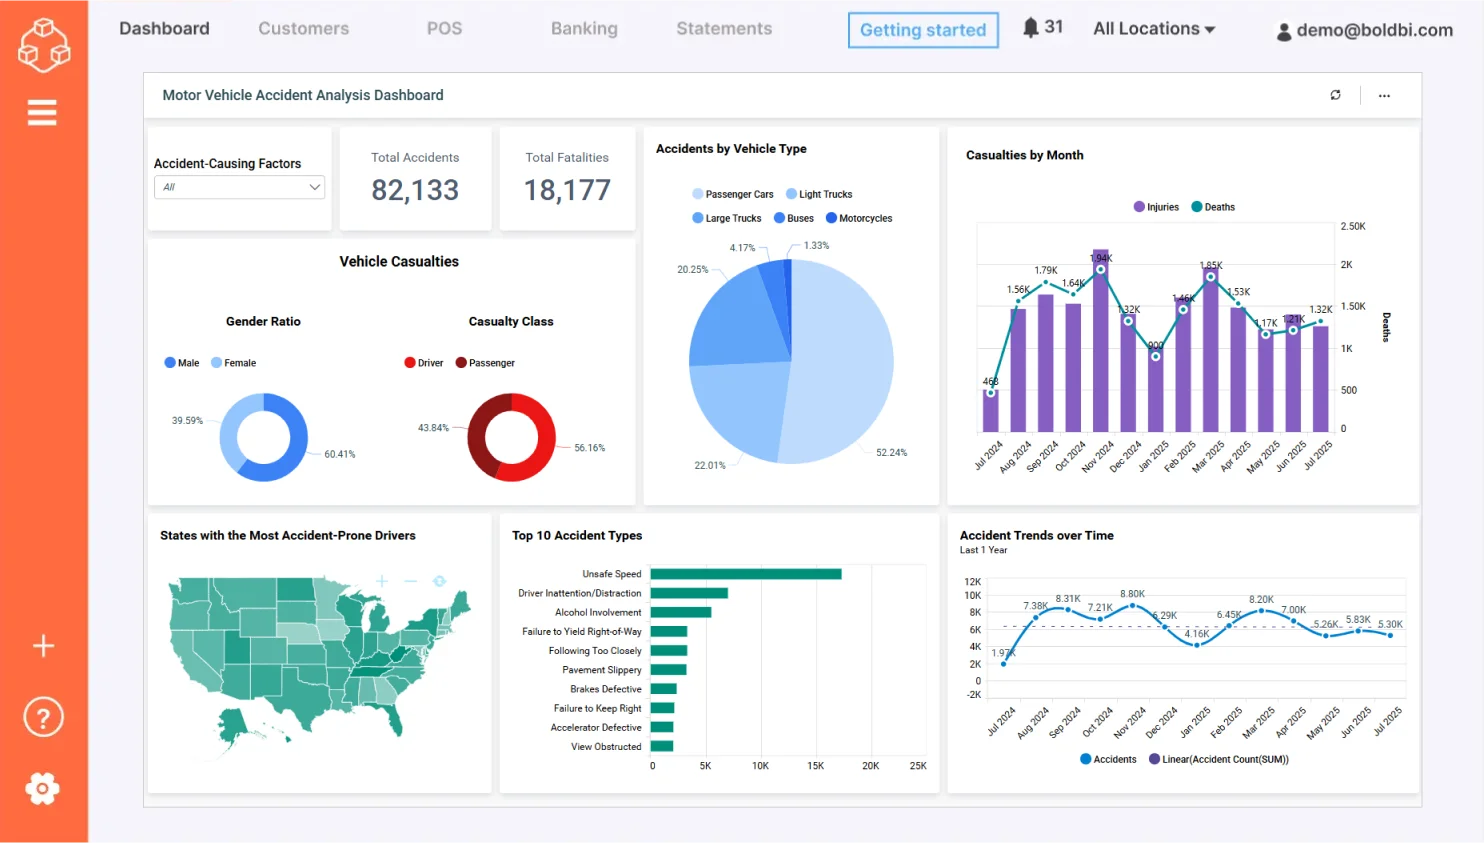
The dashboard helps you visualize:
- Accident count by vehicle manufactured year: Shows the accident count based on the year a vehicle was manufactured.
- Monthly accident numbers: Shows the number of accidents that occurred on a monthly basis.
- Contributing factors: Shows the accident count with respect to contributing factors like human, environment, and vehicle.
- Accident count by vehicle type: Shows the accident count with respect to the vehicle type.
Check out more of our interactive dashboard solutions for government.
5. Healthcare Dashboard Example
Hospital Management
With the hospital management KPI dashboard embedded into your business application, you can track staffing details, treatment costs, and readmission rates so that you can monitor quality of care, operational activities, and financial activities of a hospital.
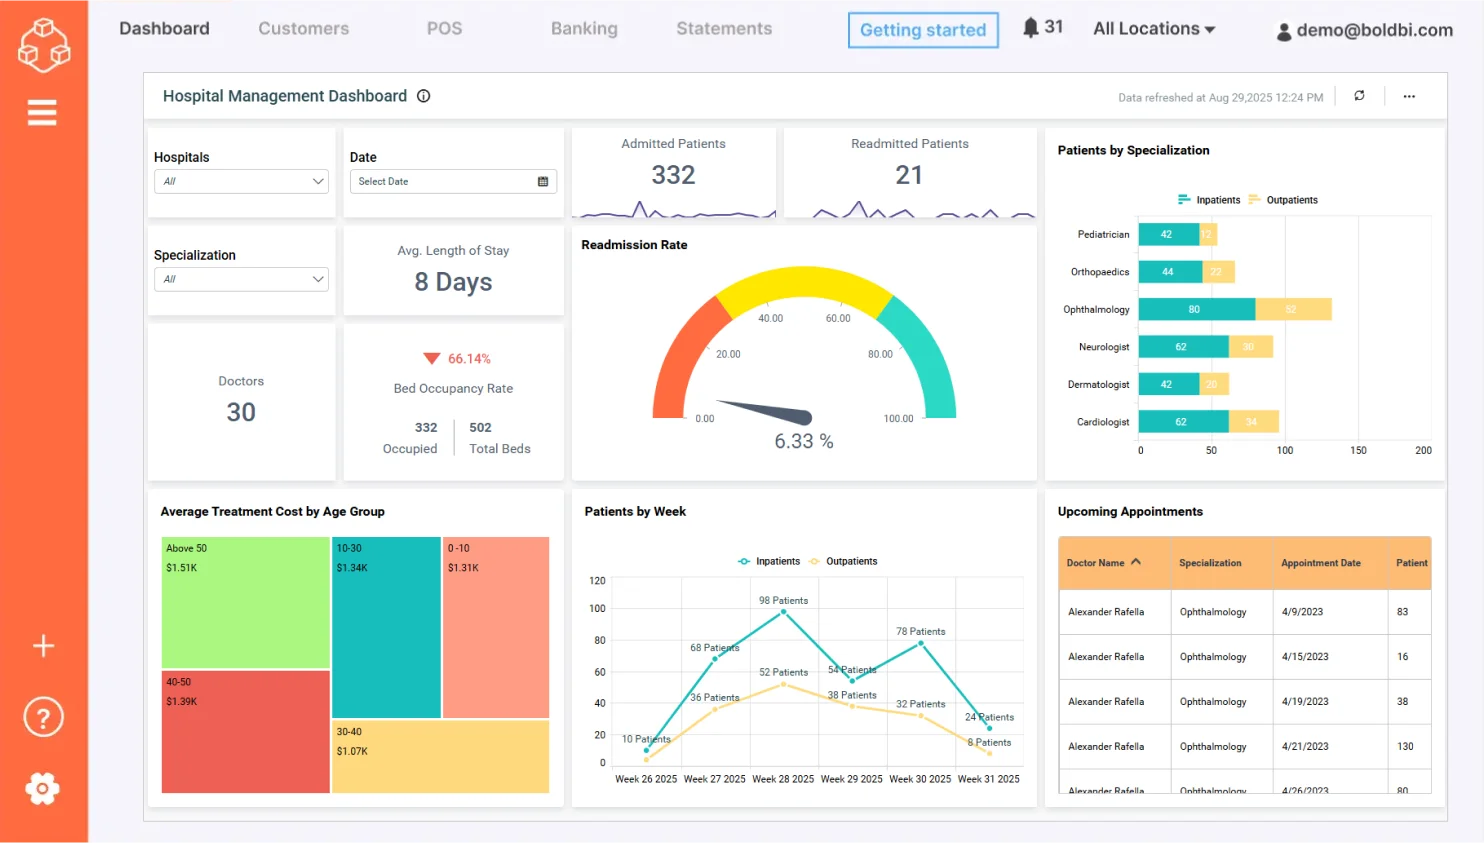
With the hospital KPI dashboard, you can track:
- Average length of stay: Shows the average length of stay of patients, which directly impacts the costs and workload of your staff.
- Readmission rate: Helps you track the patients who are coming back. Readmission rates are a token of the quality of care provided in your hospital.
- Treatment cost by age group: Shows the average treatment costs paid by patients from different age groups.
Check out more of our interactive dashboards for healthcare.
6. Hospitality Dashboard Example
Hotel revenue management
Embedding the hotel revenue management dashboard allows you to track various pieces of crucial revenue and performance data in your application to assess daily operations while analyzing yearly trends. This in turn helps you allocate resources efficiently, eventually increasing the performance of your hotel.
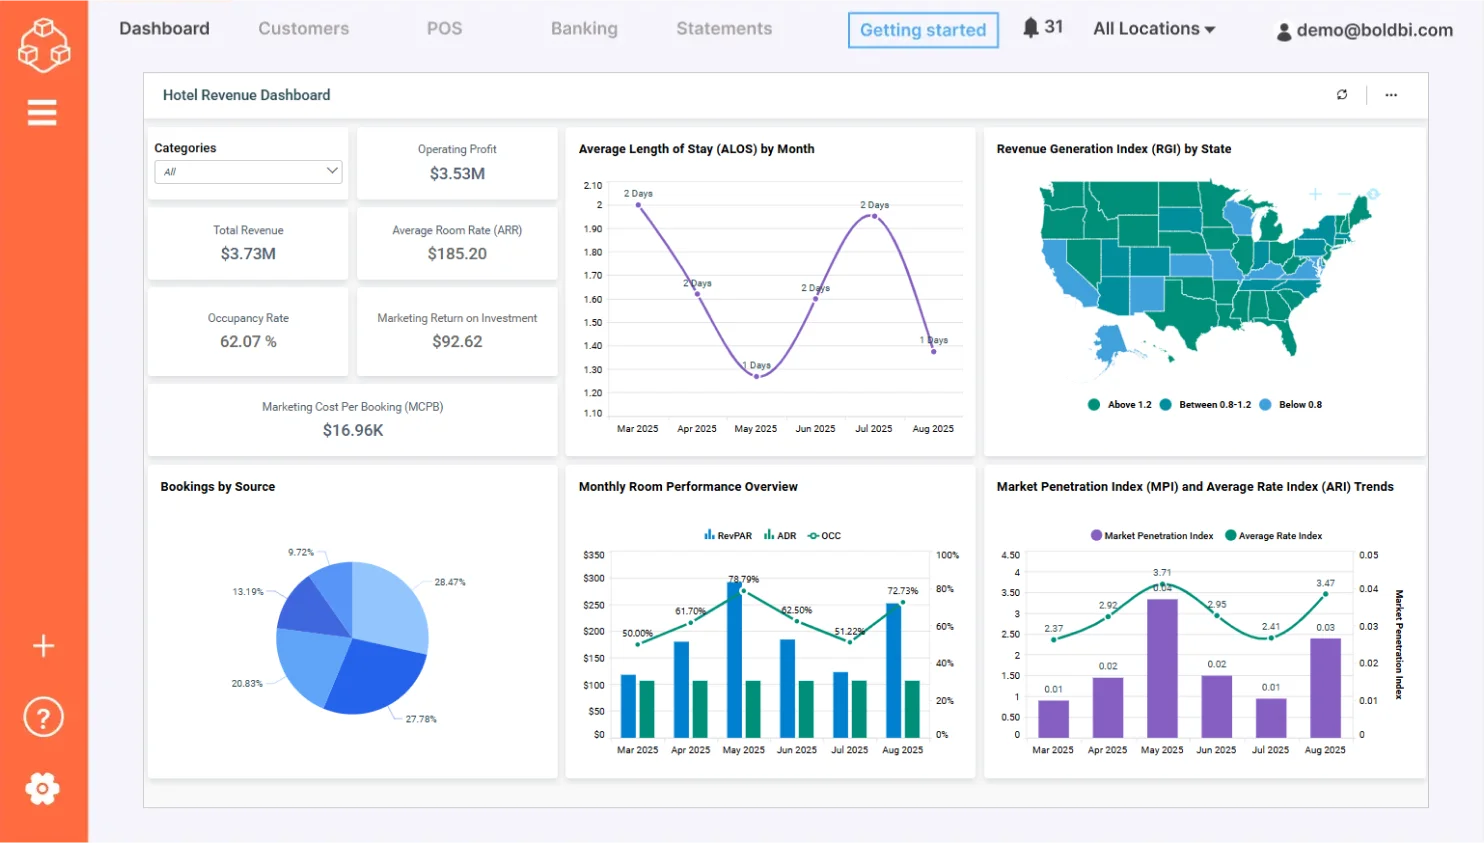
This dashboard provides insights into:
- Revenue: Compares the total revenue earned in the current year to the last year.
- RevPAR and average daily rate: Shows how well hotels are filling their rooms each month and how prices might be adjusted to achieve higher occupancy rates.
- Booking source: Shows the percentage of bookings from sources such as phone, online, direct, and referral.
- Marketing cost per booking (MCPB): Shows the amount spent on marketing in order to book a room.
Check out more of our interactive dashboards for hospitality.
7. Insurance Dashboard Example
Insurance claims analysis
Embedding the insurance claims analysis dashboard helps you track premiums, assured amounts, and revenue sources in one place without navigating to other applications. This dashboard provides insight that allows you to analyze trends that may occur with claims as they relate to policy type, which helps you allocate resources properly.
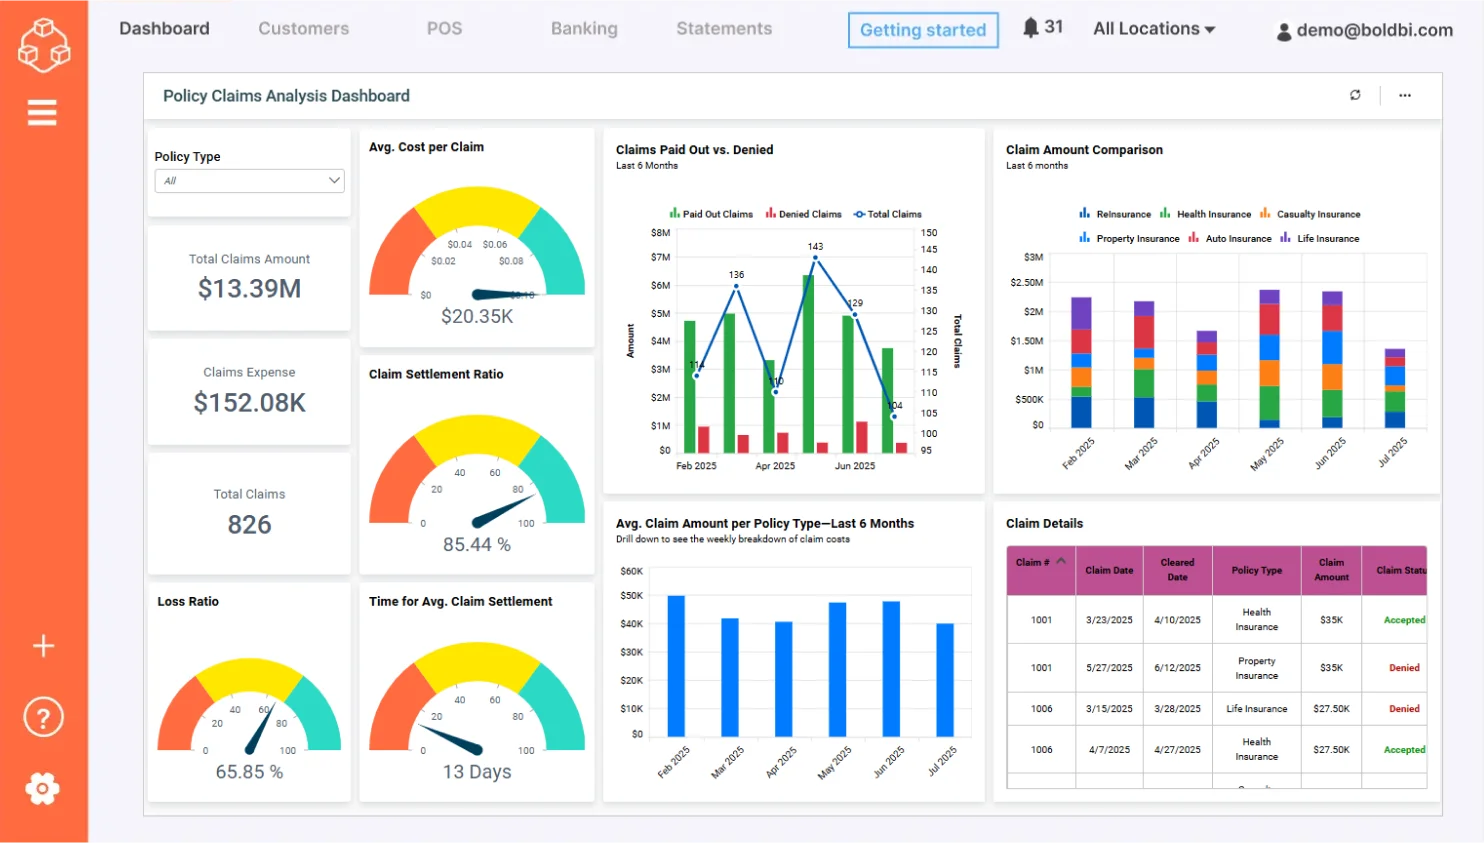
This dashboard helps you explore KPIs including:
- Claim amount comparison: Compares the claim amount for each policy type over a time period.
- Average cost per claim: Shows the average cost of each type of claim.
- Average days to settle a claim: Shows the average days taken to settle each claim.
Check out more of our interactive dashboards for insurance solutions.
8. Oil and Gas Dashboard Example
Oil and gas production monitoring
Embedding the oil and gas production monitoring dashboard helps you track oil and gas production, top-producing wells, and production trends in your business application. The dashboard provides an overview of typical energy company KPIs that help you track daily operations and trends that occur over longer periods of time.
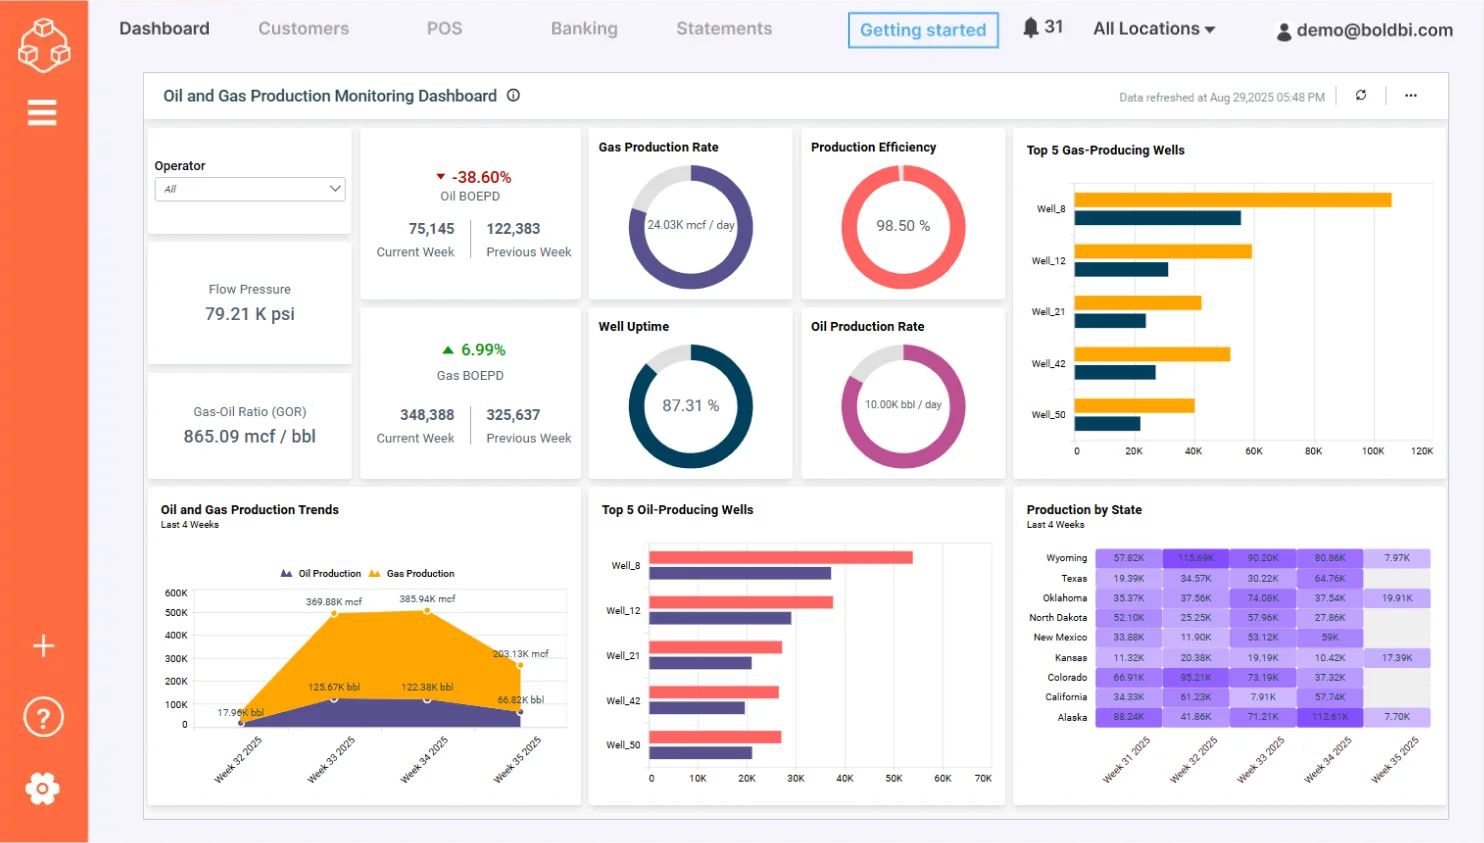
This dashboard helps you monitor:
- Oil BOEPD (Barrels of oil equivalent per day): Shows the comparison between oil BOEPD units produced in the current week and previous weeks.
- Gas BOEPD: Shows the comparison between gas BOEPD units produced in the current week and previous weeks.
- Production by state: Shows the BOEPD produced in the past four weeks according to U.S. state.
- Total production: Shows the oil and gas BOEPD produced in the last four weeks.
Check out more of our interactive dashboard solutions for oil and gas.
9. Pharmaceutical Analysis Dashboard Example
Pharmaceutical sales performance
Embedding the pharmaceutical sales performance dashboard into your application helps pharmacists, executives, and sales representatives drill down into the details of prescription and nonprescription drug sales in different states. This dashboard compares changes over different quarters and channels, and it analyzes sales and profits.
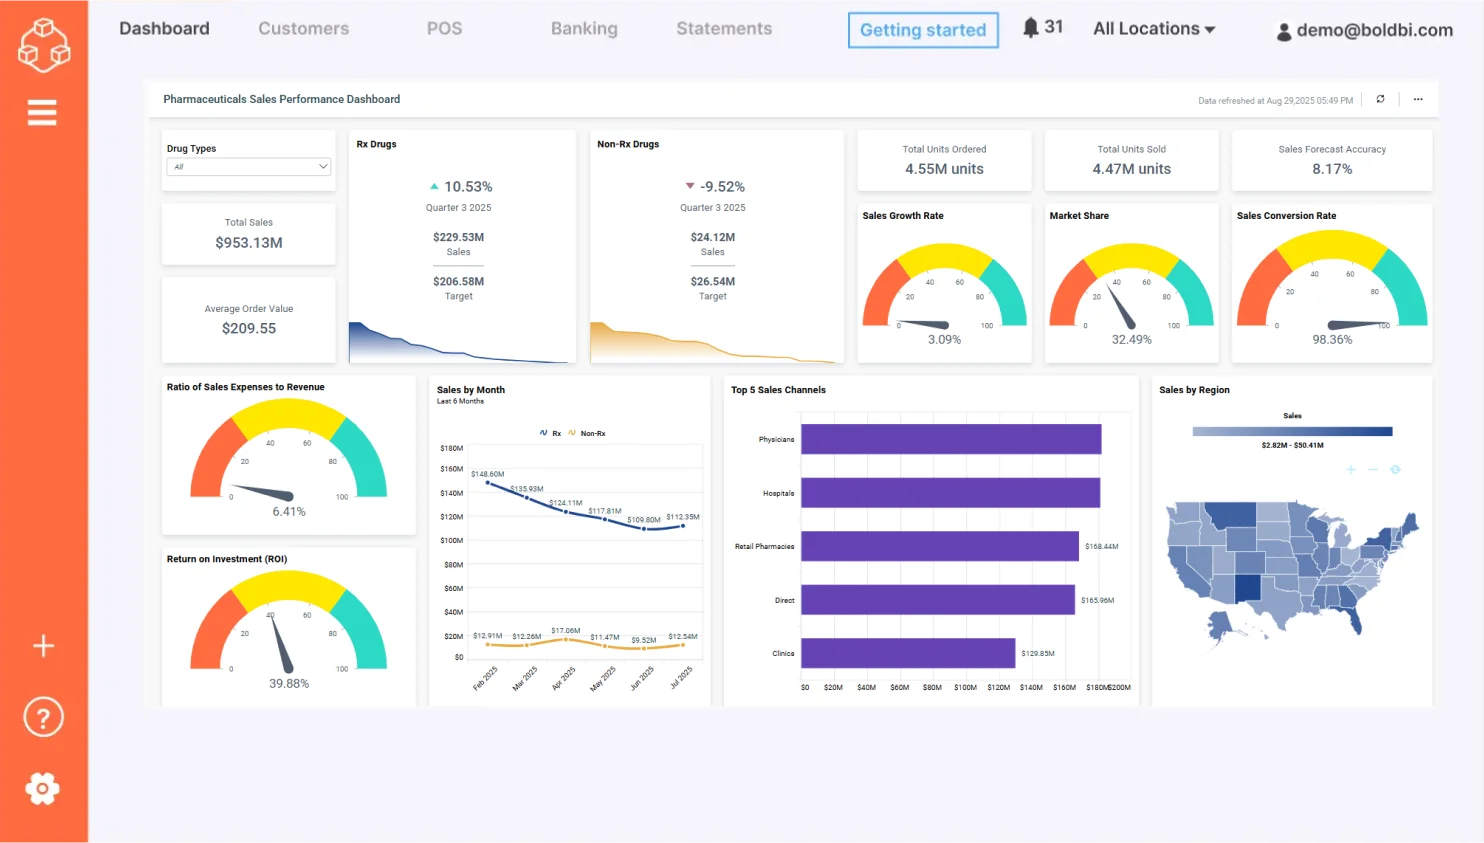
With this dashboard, you can visualize:
- Rx drugs: Compares prescribed drugs’ total sales with their target.
- Non-Rx drugs: Compares nonprescribed drugs’ total sales with their target.
- Prescription drug’s performance: Shows NBRx, NRx, and TRx drug sales figures and performance over a period of time.
- Sales over quarter: Shows the sales values of prescription and nonprescription drugs over the last four quarters.
- Profit by channel: Shows and compares the profit percentage earned from multiple channels in each quarter.
Check out more of our interactive dashboards for pharmaceutical analysis.
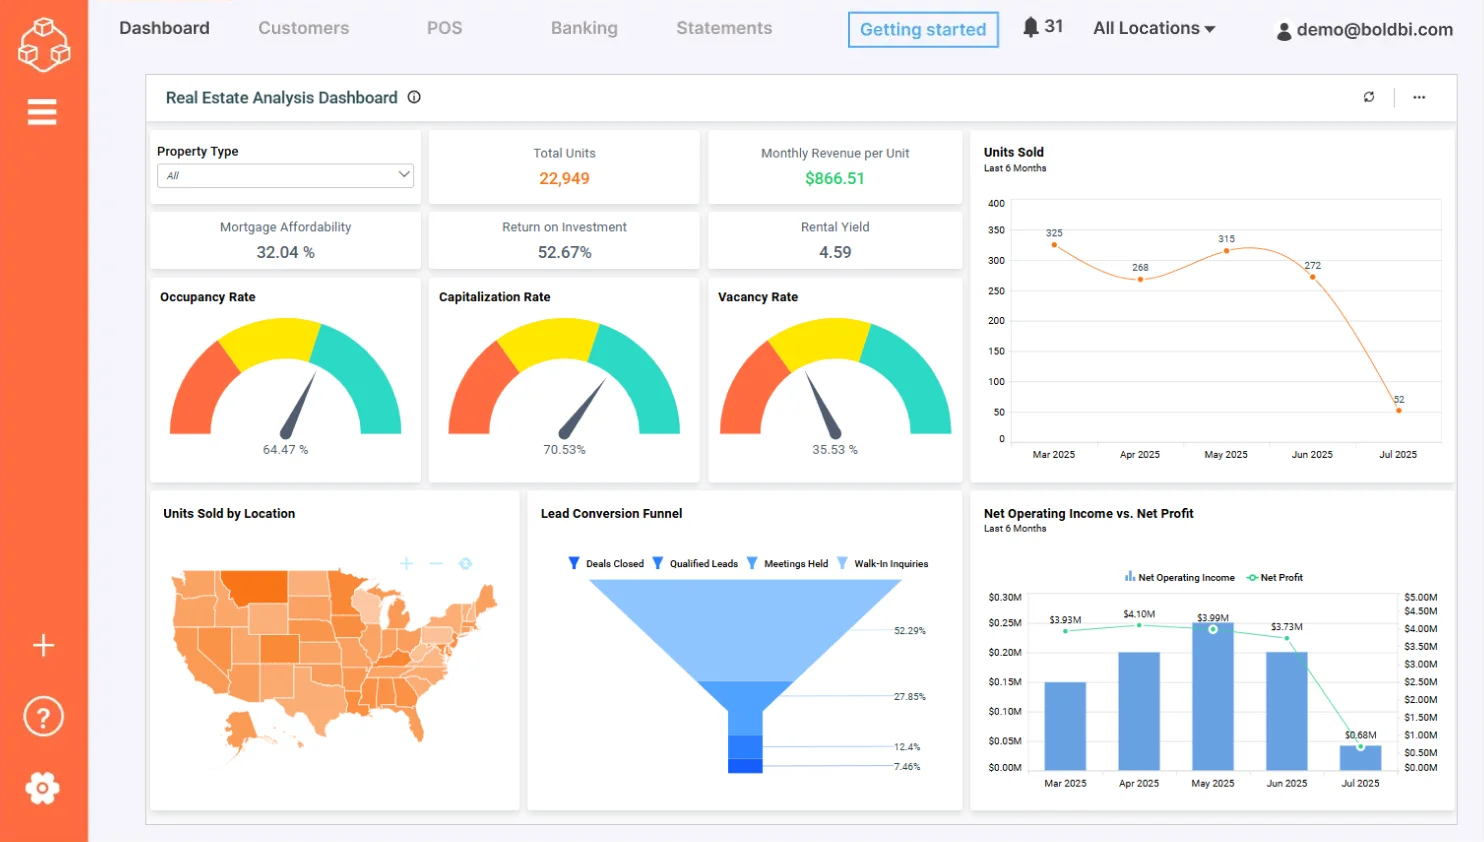
10. Real Estate Dashboard Example
Real estate management
Embedding the real estate management dashboard helps you track market data, financial metrics, and sales team performance to monitor your company’s financial health in a single application.
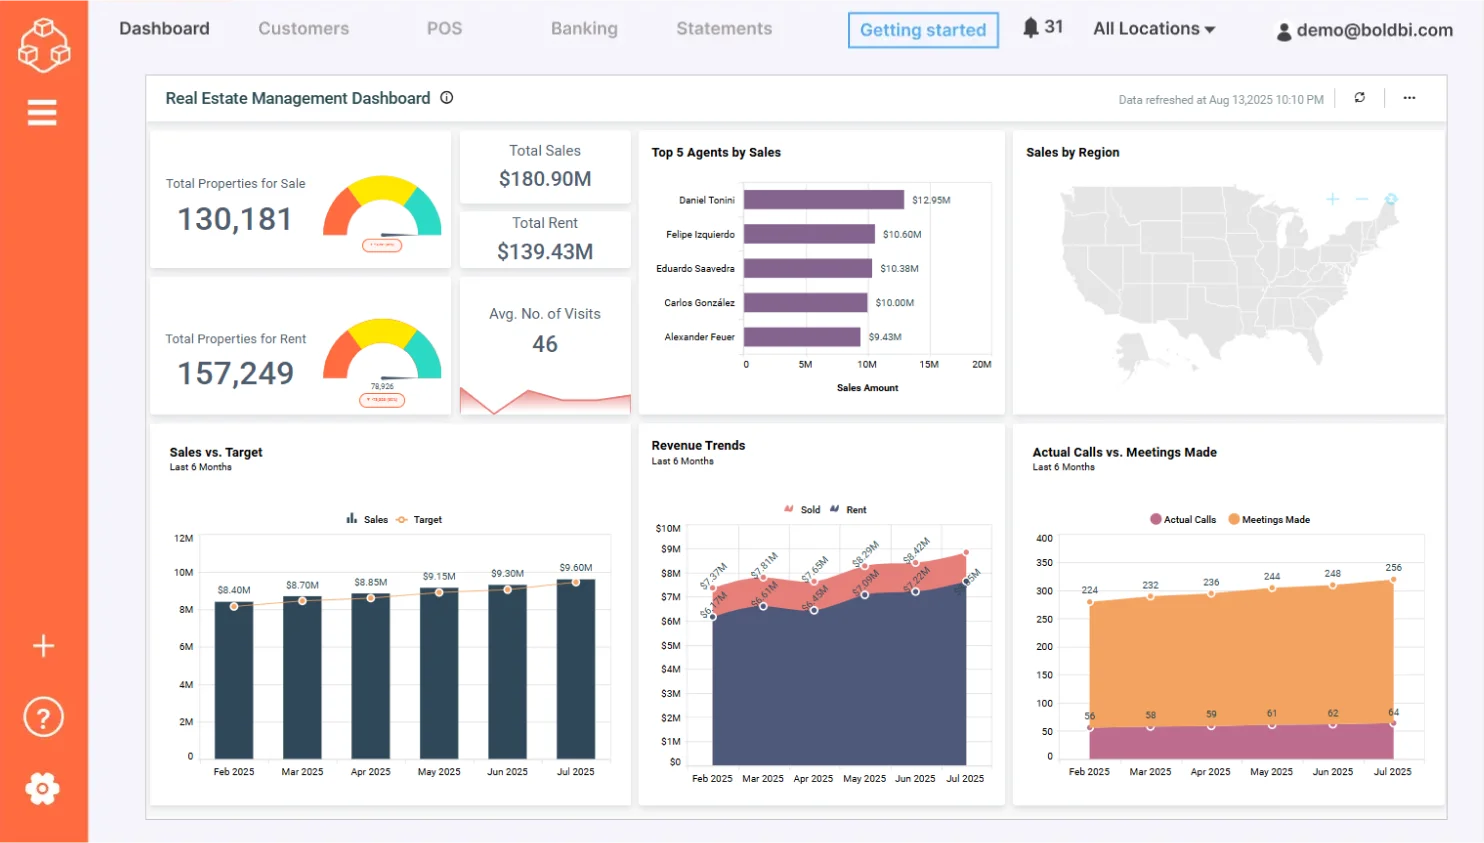
This dashboard helps you analize:
- Average days on market: Shows the average number of days a property remains in inventory.
- Average no. of visits: Shows the average number of times agents show properties to buyers.
- Advertisement and promotion cost: Shows the amount of money a real estate company spent on advertising and promoting properties.
- Properties sold and rented by agent: Shows the number of properties sold and rented by real estate agents.
Check out more of our interactive dashboards for real estate.
11. Retail Dashboard Example
Retail store performance analysis
Embedding the retail store performance analysis dashboard enables you to track key metrics like average unit retail (AUR), average basket value (ABU), average basket size (ABS), and more in your business application. This dashboard helps store managers and sales managers evaluate how a store has performed in the last month.
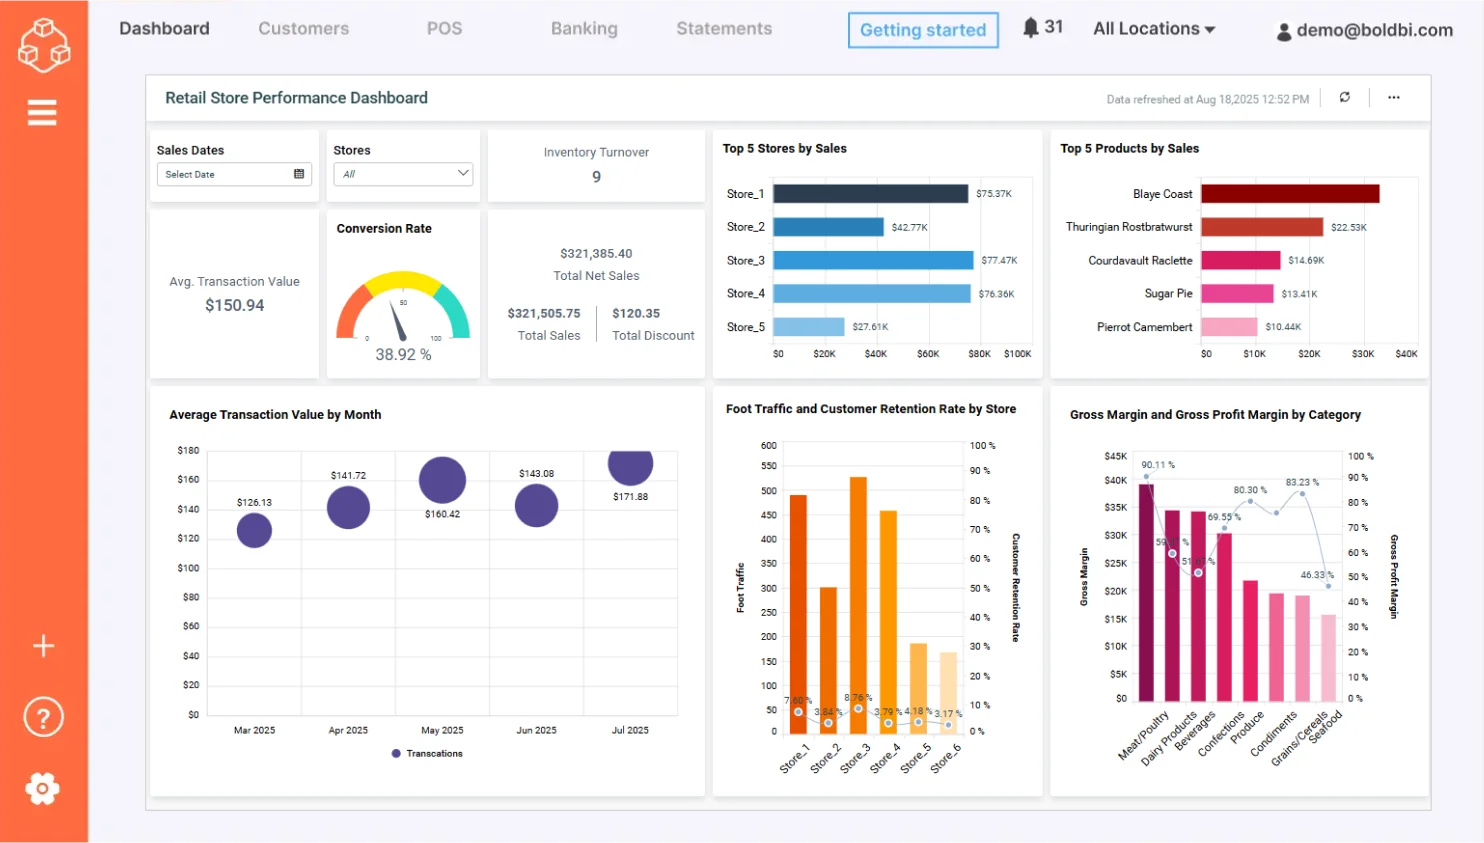
- Net sales: Shows the net sales earned over a period of time.
- AUR: Shows the average amount spent for a particular type of item.
- ABS: Shows the number of items sold in a single purchase.
- Sales and gross profit by category: Shows a product category’s sales volume and gross profit value.
Check out more of our interactive dashboards for retail.
12. Telecommunications Dashboard Example
Revenue and usage statistics
Embedding the revenue and usage statistics dashboard into your business application helps you track network usage, revenue, subscriber details, and provides an overall status report of a telecom service. This helps your company use their resources efficiently in order to keep up with subscriber demand.
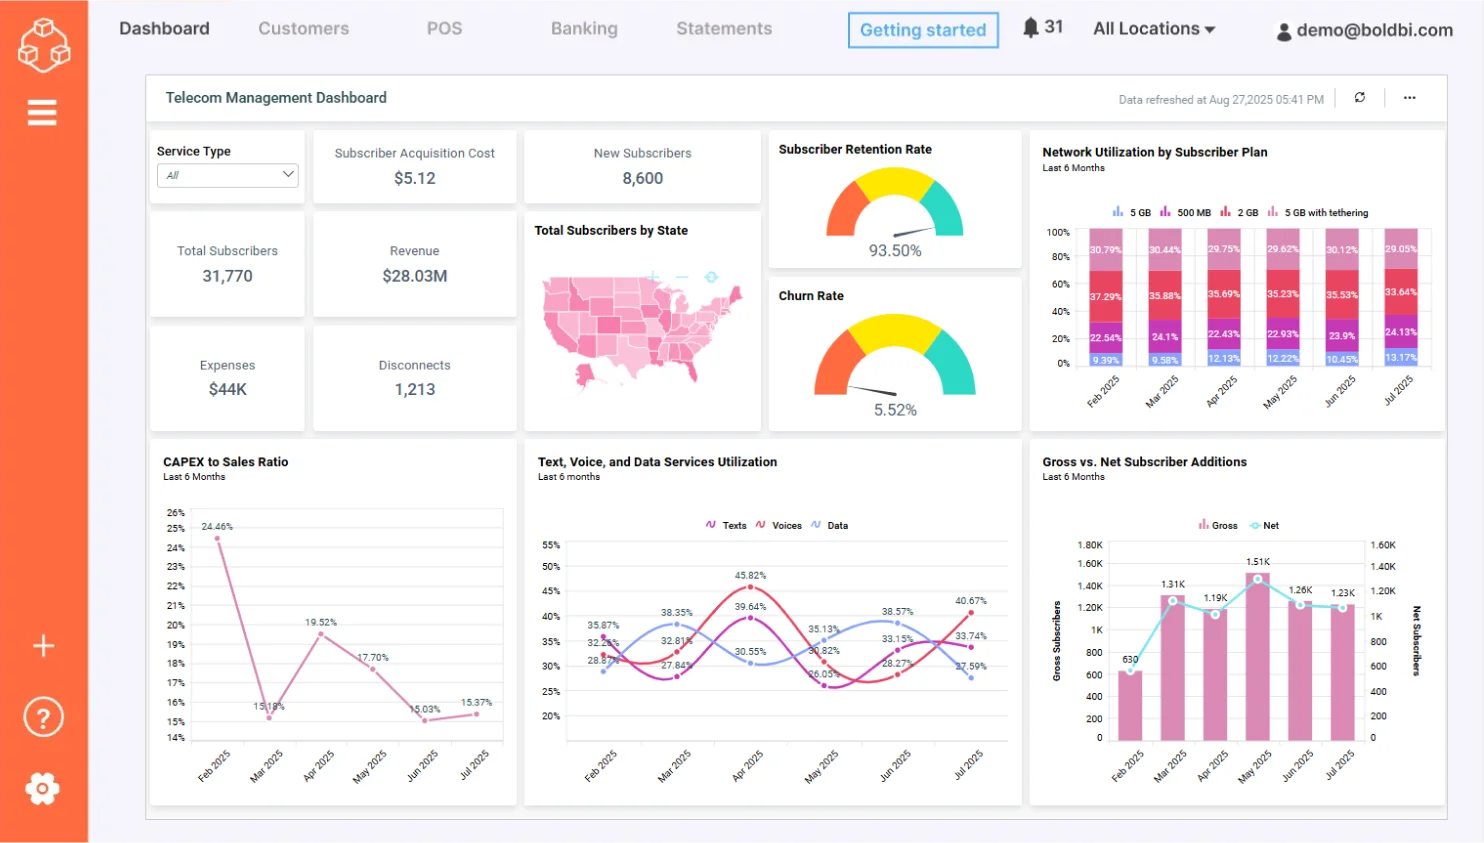
- Revenue: Shows the overall revenue earned in a period of time.
- Expense: Shows the money spent to earn more subscribers.
- Churn rate: Shows the percentage of subscribers who stopped subscribing to the services.
- Network utilization by subscribers: Shows how much of the network is used by each category of subscriber.
- Average revenue per user by plan: Shows how much revenue was earned per customer over a month.
Check out more of our interactive dashboards for telecommunications.
13. Finance Dashboard Example
Financial performance
Embedding the financial performance dashboard into your business application helps CEOs, CIOs, or other executive leaders track AR, AP numbers, networking capital, current ratios, and other key metrics of a company’s finances. This paints a clear picture of how those finances performed in a particular period of the year.
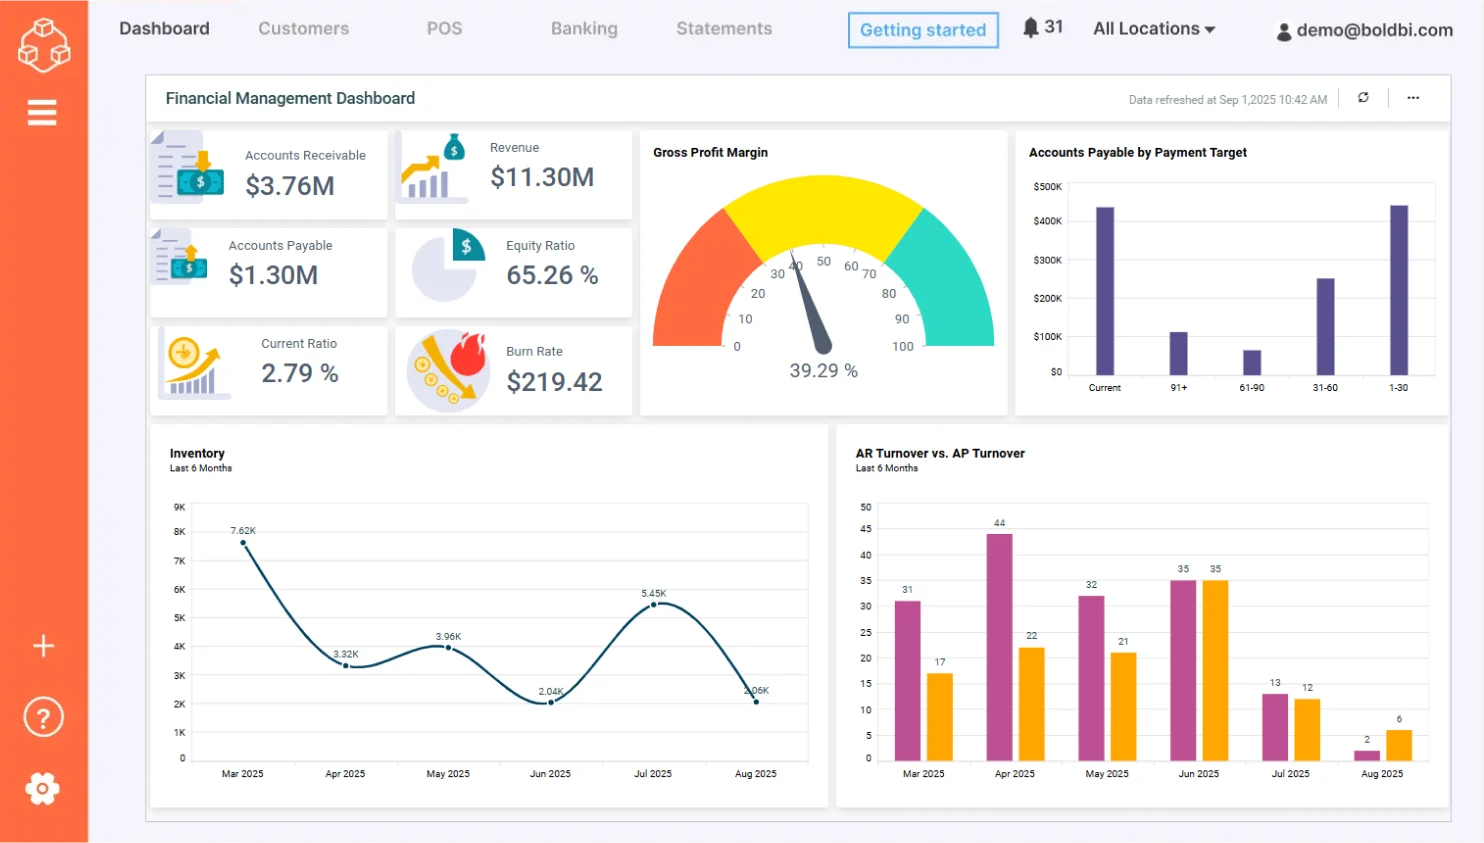
- Total accounts receivable: Shows the amount of current assets on the balance sheet.
- Total accounts payable: Shows the liability amount incurred when a company purchases goods or services from its suppliers on credit.
- Debt equity: Shows the percentage of a company’s financial leverage.
- Days sales of inventory: Shows the average number of days required for a business to convert its inventory into sales.
- Days sales outstanding: Shows the average number of days that it takes a company to collect payment after a sale has been made.
- Days payable outstanding: Shows the average time taken by a company to pay its bills and invoices to its trade creditors that includes suppliers, vendors, and other companies.
Check out more of our interactive dashboards for finance.
14. Information Technology Dashboard Example
Project management
Embedding the project management dashboard helps you track SLAs, financial metrics, and project completion times in your business application. This dashboard allows you to outline the financial health of an IT company by tracking the performance of projects undertaken.
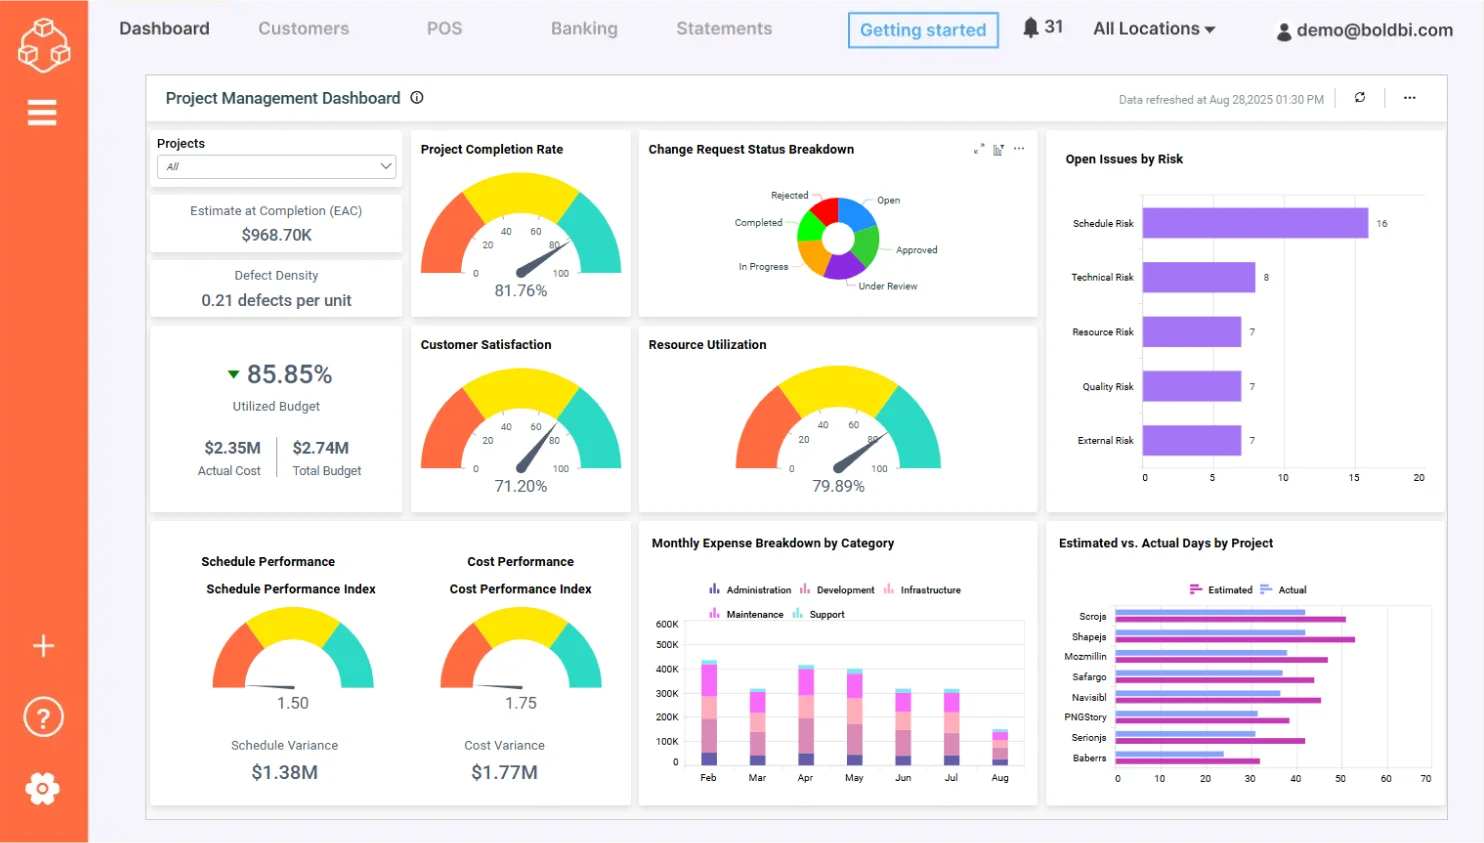
The dashboards help users monitor the following:
- Revenue and investment by month: Shows the monthly breakdowns of the company’s finances over total investment and total revenue earned.
- Total days spent to complete each project: Shows the difference in the number of days spent on each project.
- Customer satisfaction by project: Shows the percentage of customers who are satisfied with the projects.
- SLA status by project: Shows the level of service that customers expect from the service providers.
Check out more of our interactive dashboards for IT.
15. Property Management Dashboard Example
Property management
Embedding the property management dashboard helps property owners track repair and maintenance costs, tenant turnover, financial metrics, tenant data, and customer satisfaction. This dashboard helps a company determine where they are doing well and where they could improve.
With this dashboard, you can monitor:
- Occupancy rate: Shows the ratio between the number of occupied properties and total properties.
- Rent arrears count: Shows the count of tenants who paid their rent as overdue.
- Loss due to vacancy: Shows the amount lost due to vacant units in the properties.
- Tenant acquisition cost: Shows the total charges incurred by the property owner for arranging tenants to fill vacant units in the property.
- Tenant turnover: Shows the percentage of tenants who vacated the properties.
Check out more of our interactive dashboards for property management.
All these dashboards were developed using the Bold BI® platform, which empowers businesses to embed real-time, interactive dashboards into web and mobile applications with ease. Bold BI allows you to customize dashboards for your specific industry, visualize key performance indicators to support informed decision-making, and maintain enterprise-grade data security. To learn how to embed a KPI dashboard example in your business in Bold BI, refer to our “Maximizing Business Performance with KPI Dashboards today.”
Take the Next Step with Bold BI
Now, we hope you have a clear understanding of the best KPI dashboard examples you can implement to enhance performance across various industries. From construction and healthcare to energy, hospitality, and more, each dashboard offers tailored insights that empower smarter decision-making. With Bold BI®, you can easily create and customize a full KPI dashboard through a natural language input using our AI-powered analytics feature, embed it into your applications, and unlock the full potential of your data. To learn how this can be made possible, explore our “Build Generative AI-Driven Dashboards [Webinar Notes]” for detailed insights.
Explore Bold BI dashboard example website to discover more solutions tailored to your industry and start transforming your data into actionable insights. You can also sign up for a free trial or request a personalized demo to see how Bold BI fits into your workflow. If you need help getting started, check out our onboarding resources for a step-by-step guide to building your first dashboard. Curious about how Bold BI can elevate your business? Start your journey today and turn your data into decisions that drive success.