

How to Connect SharePoint Data in Dashboards for Insights

Introduction
SharePoint is a widely used platform for storing business data, but converting that data into clear metrics can be a challenge. With Bold BI, you can connect your SharePoint data directly to interactive dashboards. This allows you to visualize key metrics in real time and make faster, data-driven decisions. In this blog, we explore how to connect SharePoint data and dashboards for meaningful Insights with live updates.
Understanding SharePoint integration
SharePoint is a web-based, collaborative platform integrated with Microsoft Office. It is used as a document management and storage system. Following is one view of a JSON document, showing how data is represented in SharePoint.
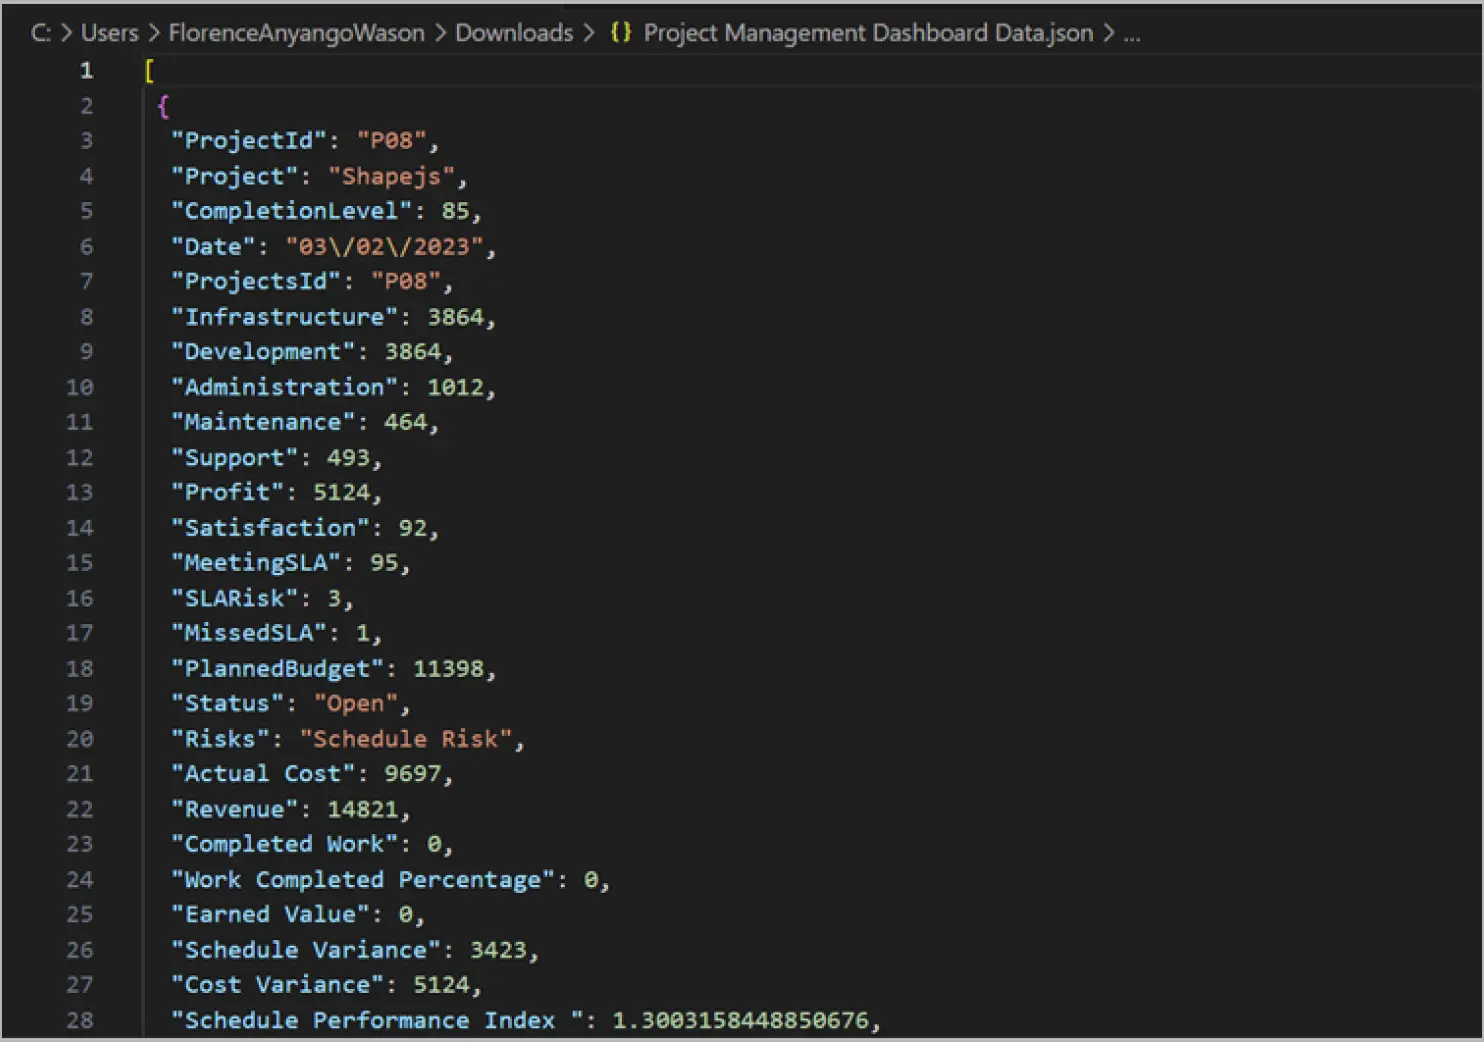
How to connect to SharePoint data
Bold BI allows you to connect SharePoint storage to the dashboard designer using your Office 365 account. Let us see how to connect to files from SharePoint.
To create a SharePoint data source from the dashboard designer, open the Data Sources configuration panel and select SharePoint from the Cloud Storage category.
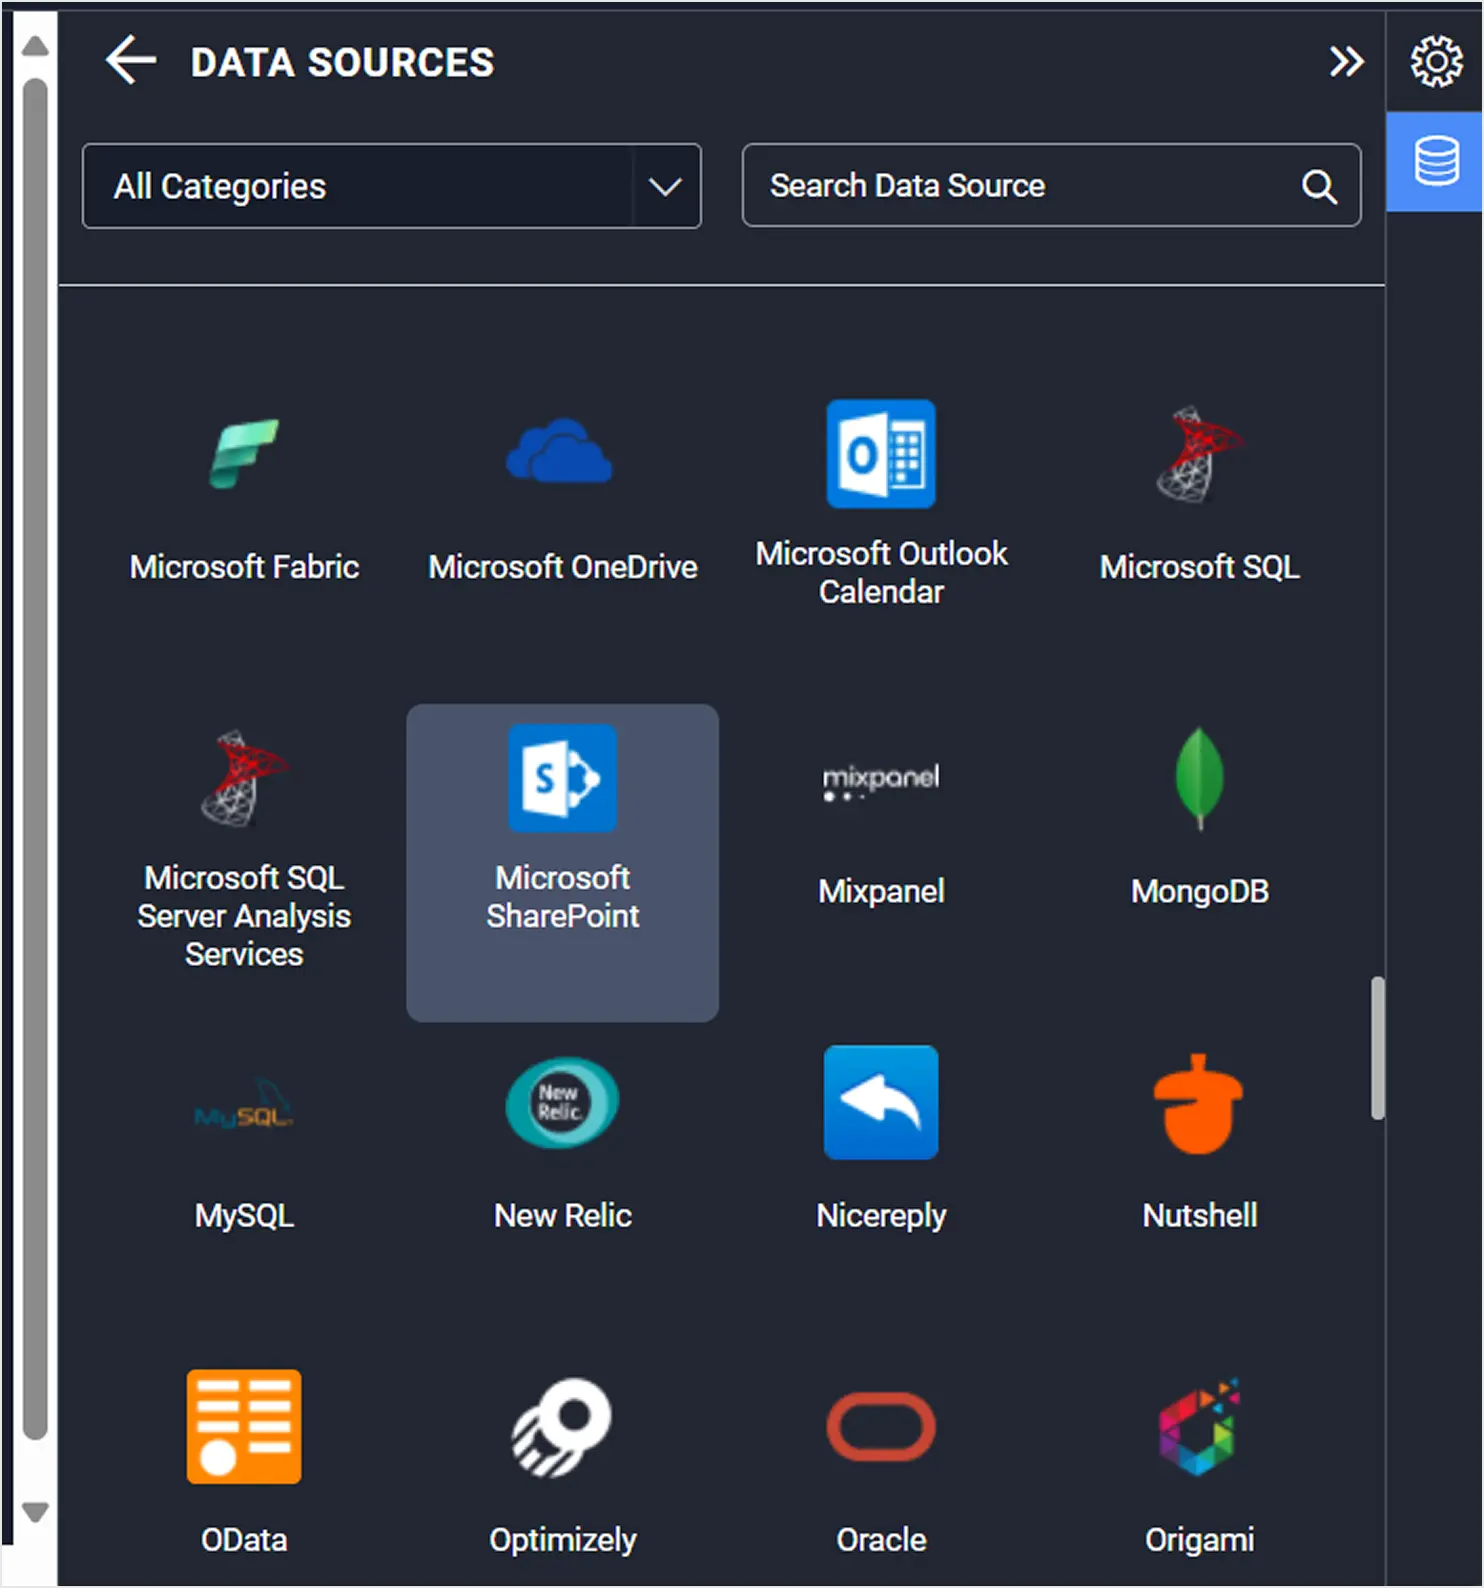
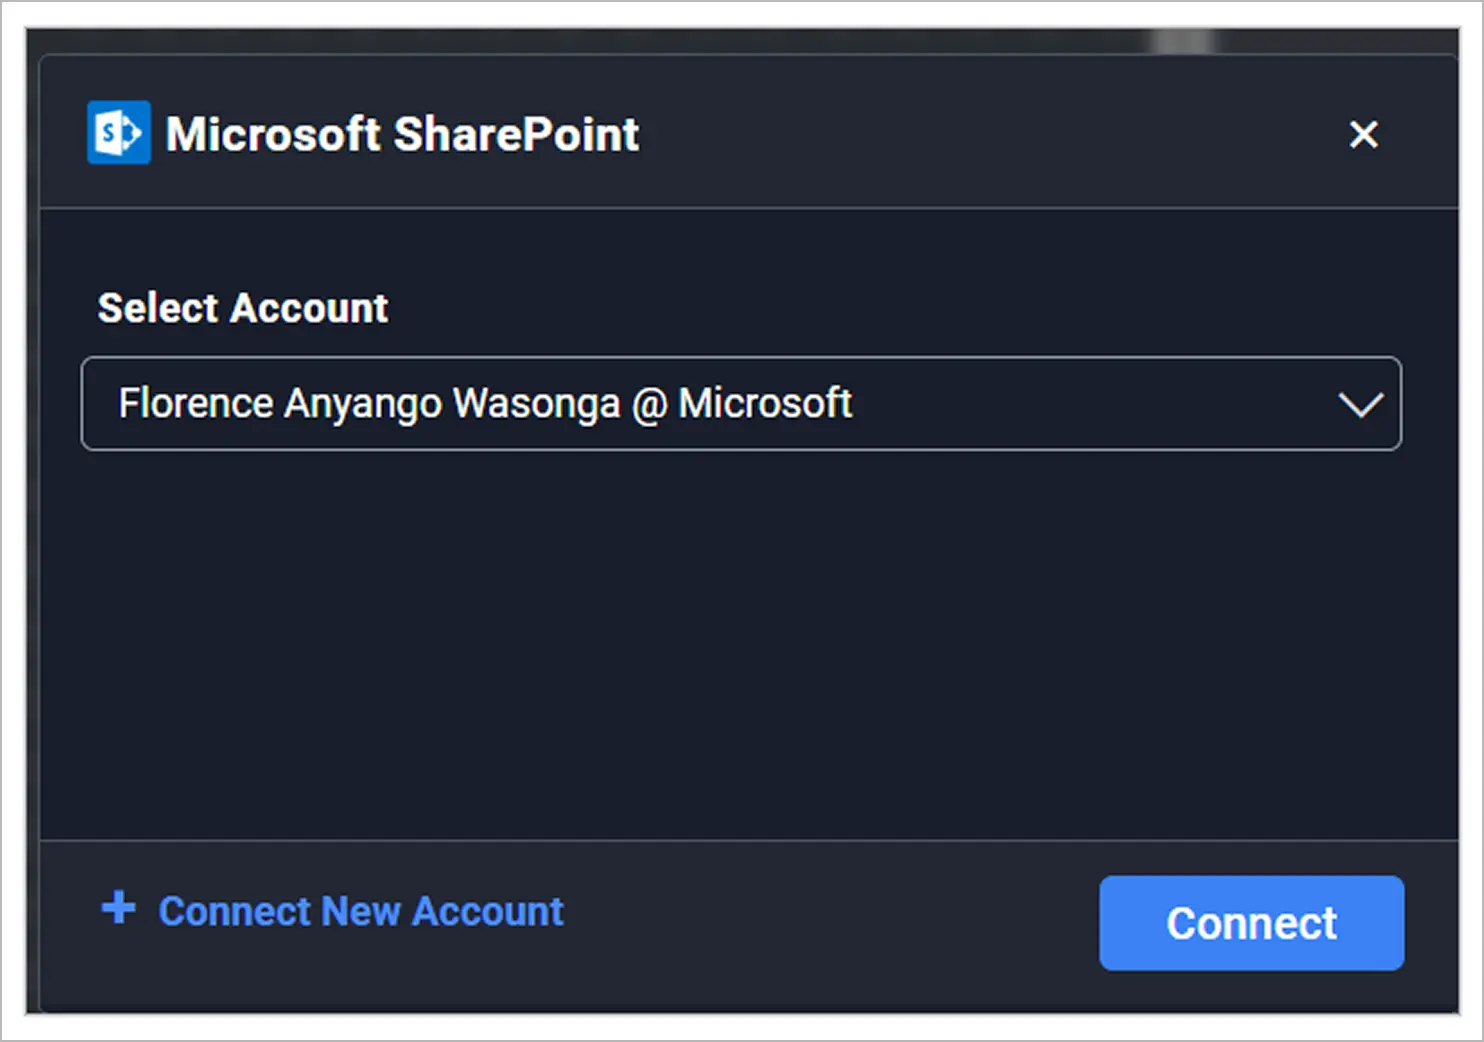
The SharePoint connection window opens, as shown in the following image.
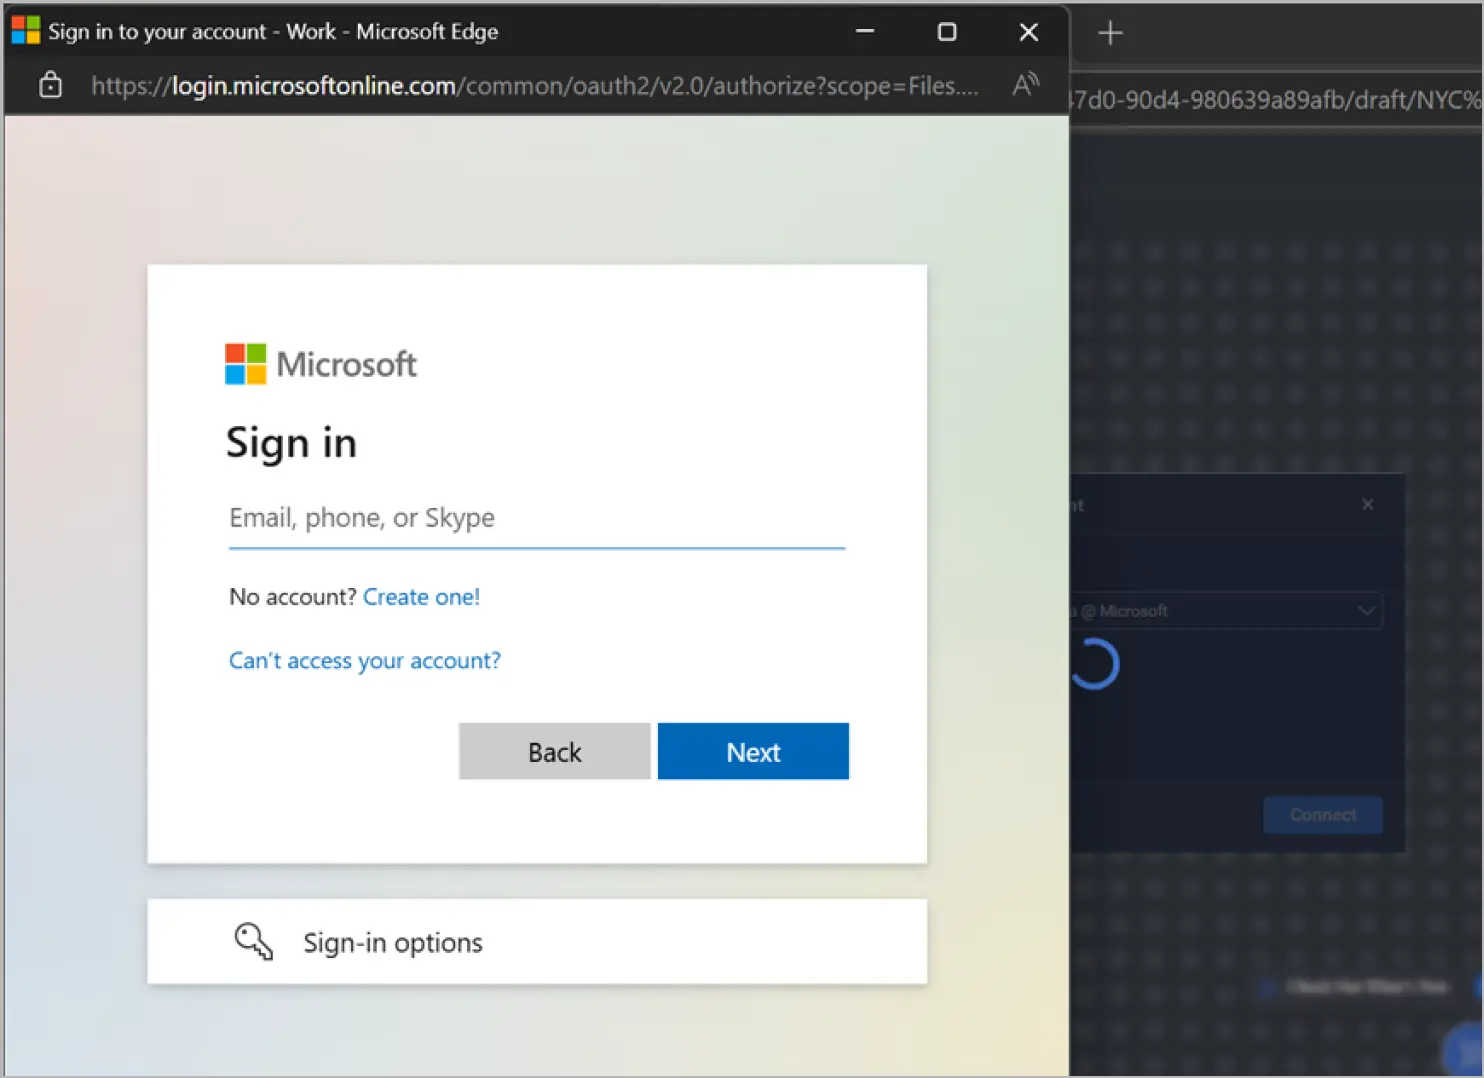
Sign in to your Microsoft Office account. Choose your account from the dropdown.
Select a sites from SharePoint, as shown in the following image.
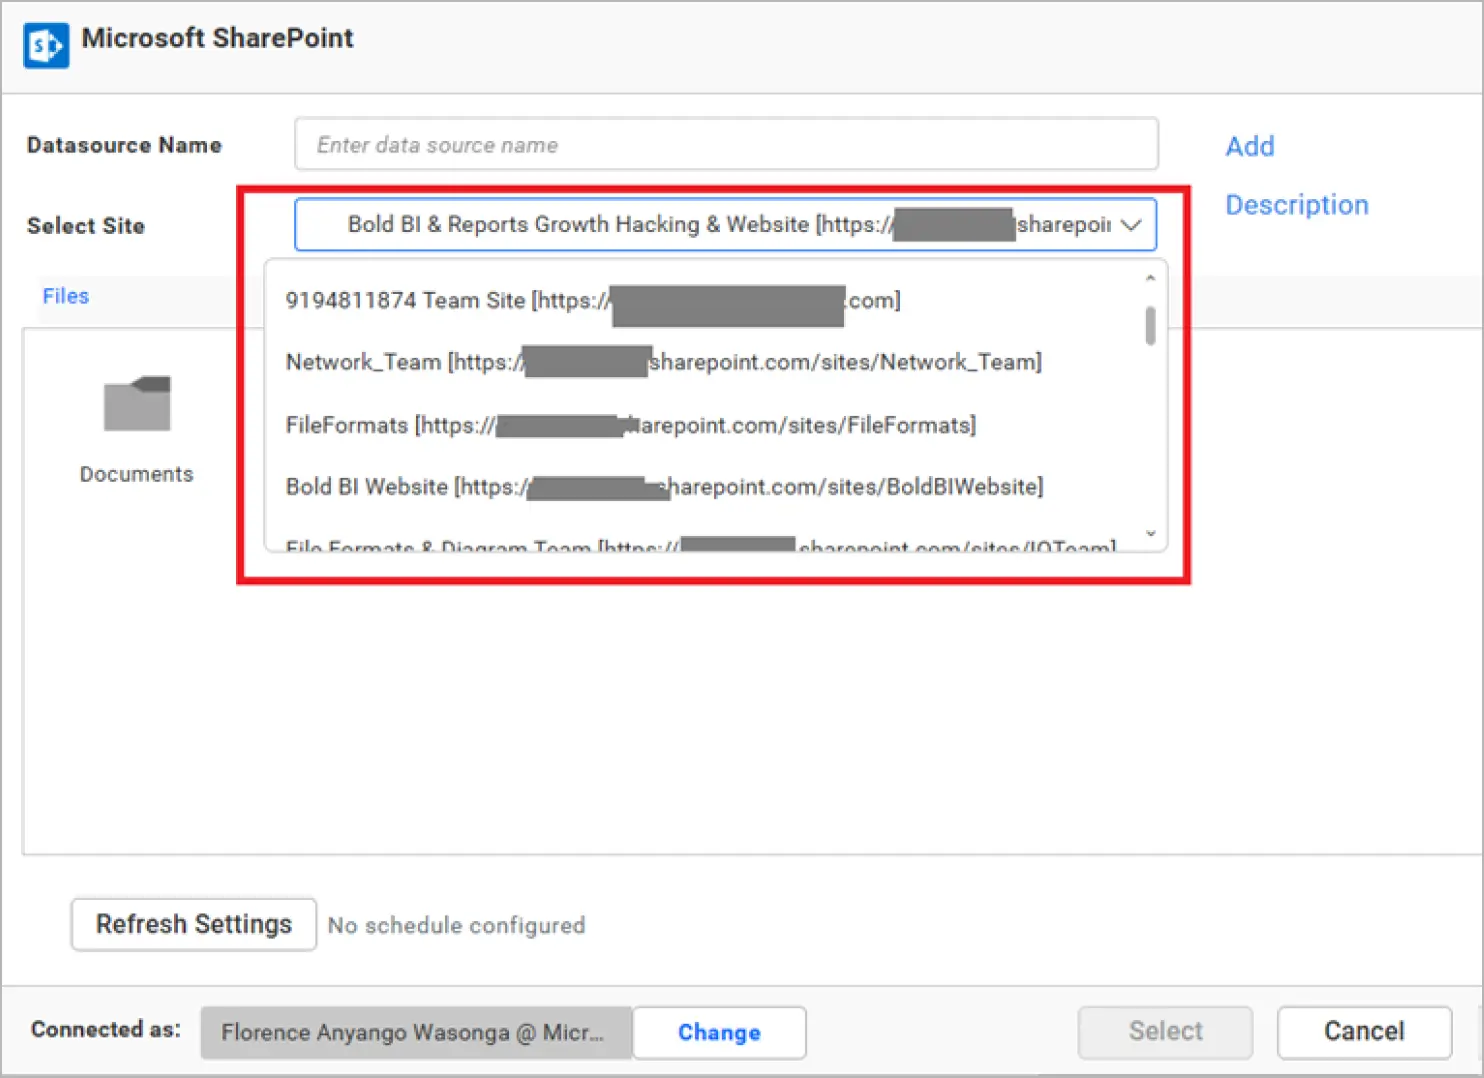
After selecting the site you need, select the data files and provide the name of the data source in the configuration window.
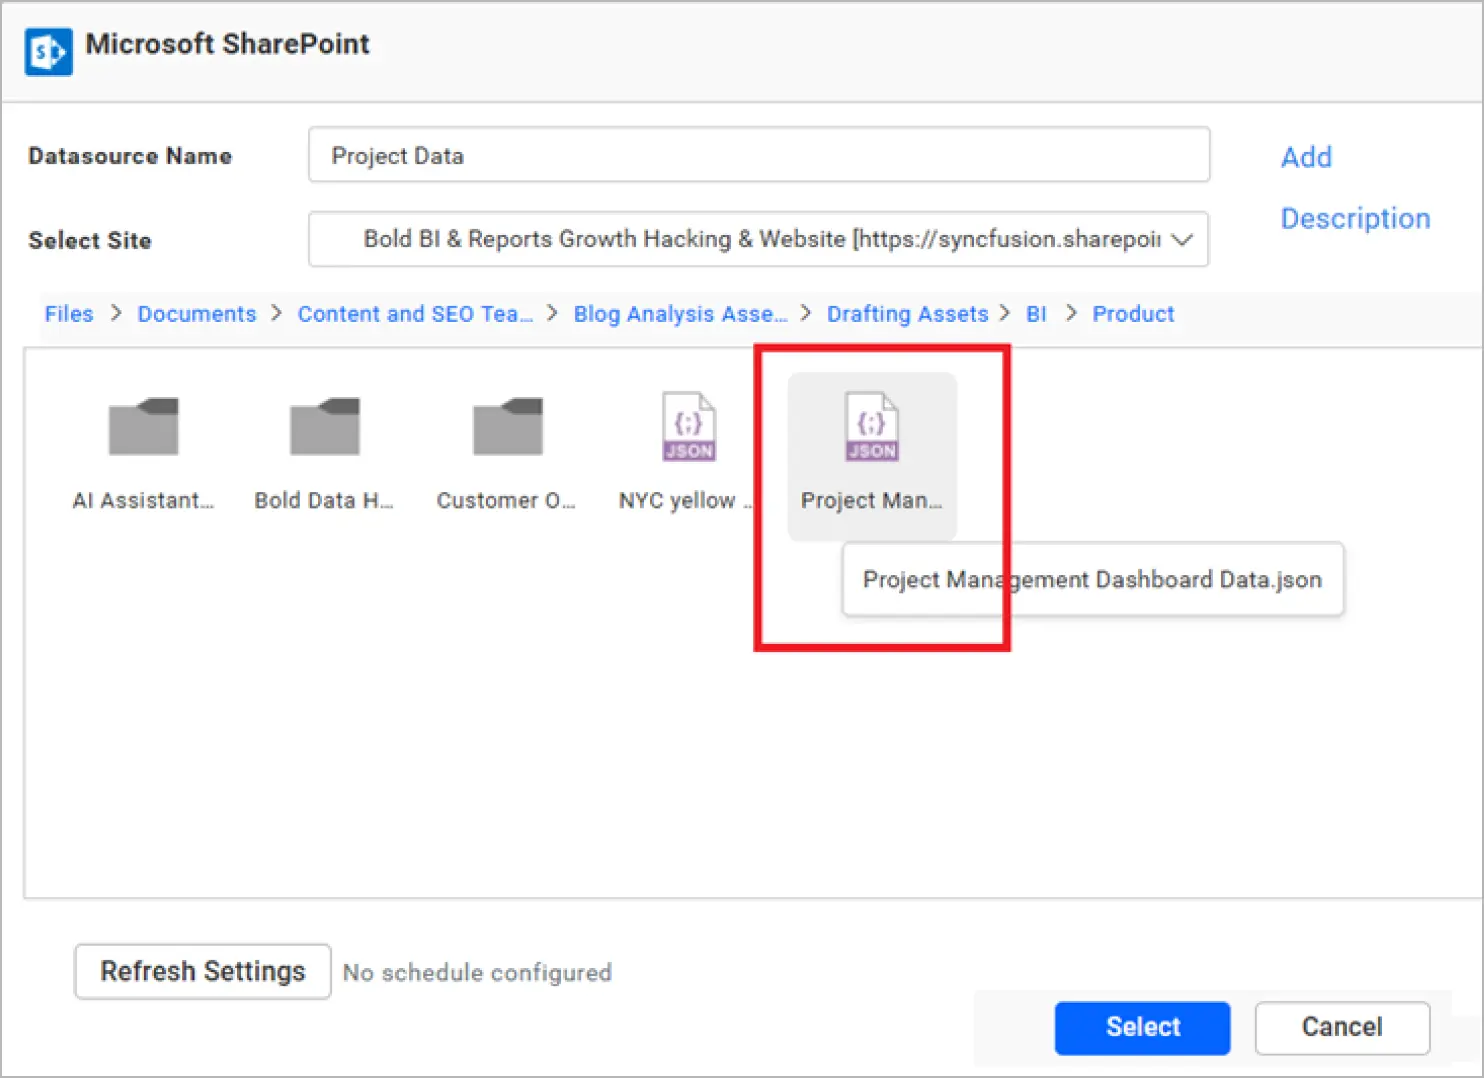
I have selected a JSON file to create a Project Management dashboard. After selecting the file, the window will show the list of columns in that JSON file.
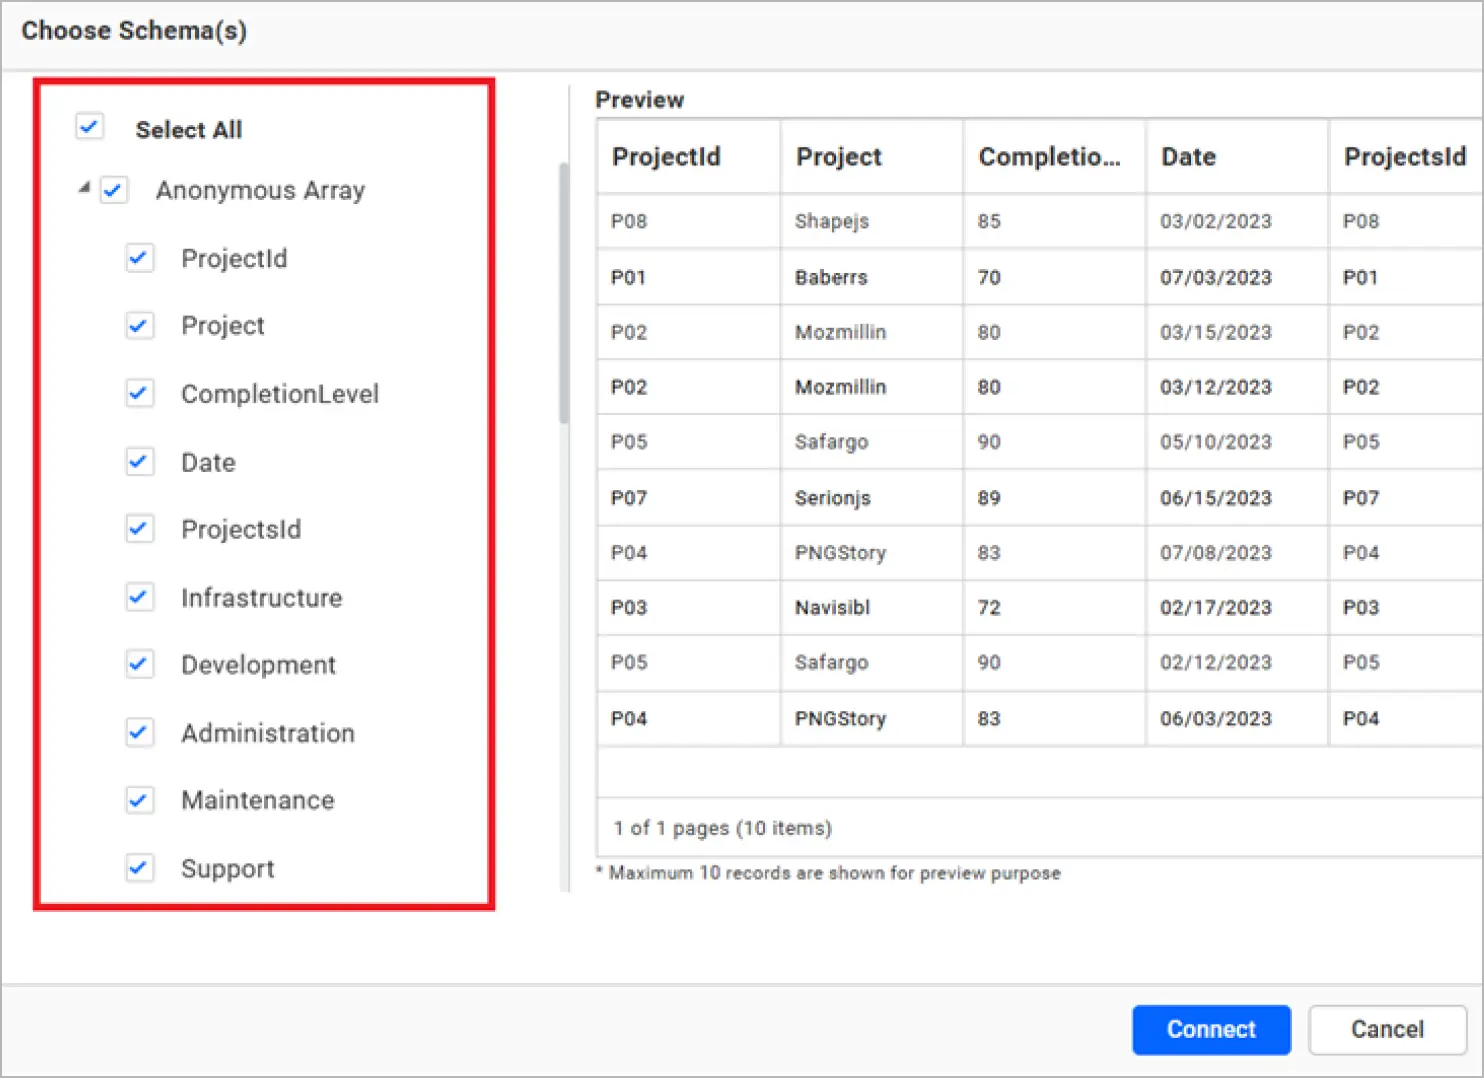
Choose the desired columns and click Connect. Now your selected data will move to the intermediate database specially reserved for your tenant. Once it’s done, you will be directed to the Bold BI data source designer. The SharePoint schema is listed in a tree view on the left side of the editing window.
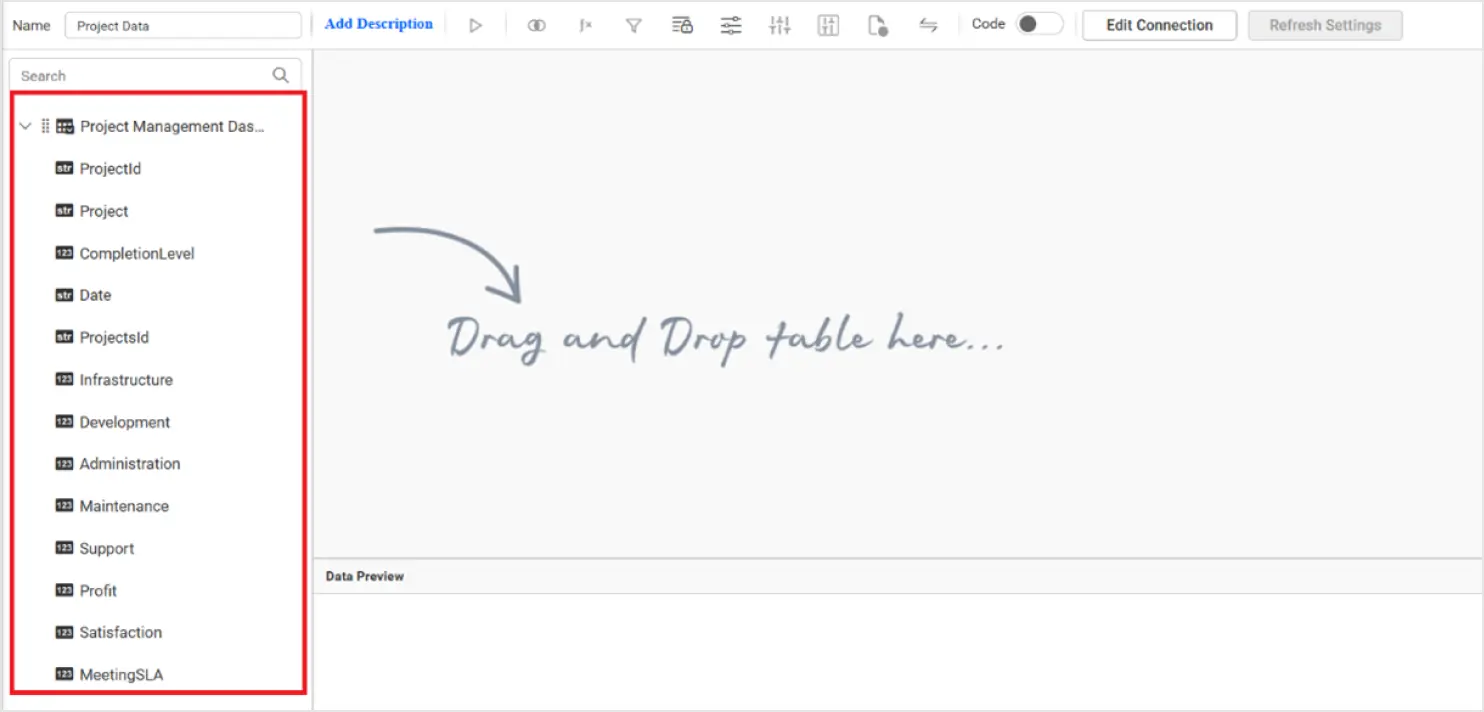
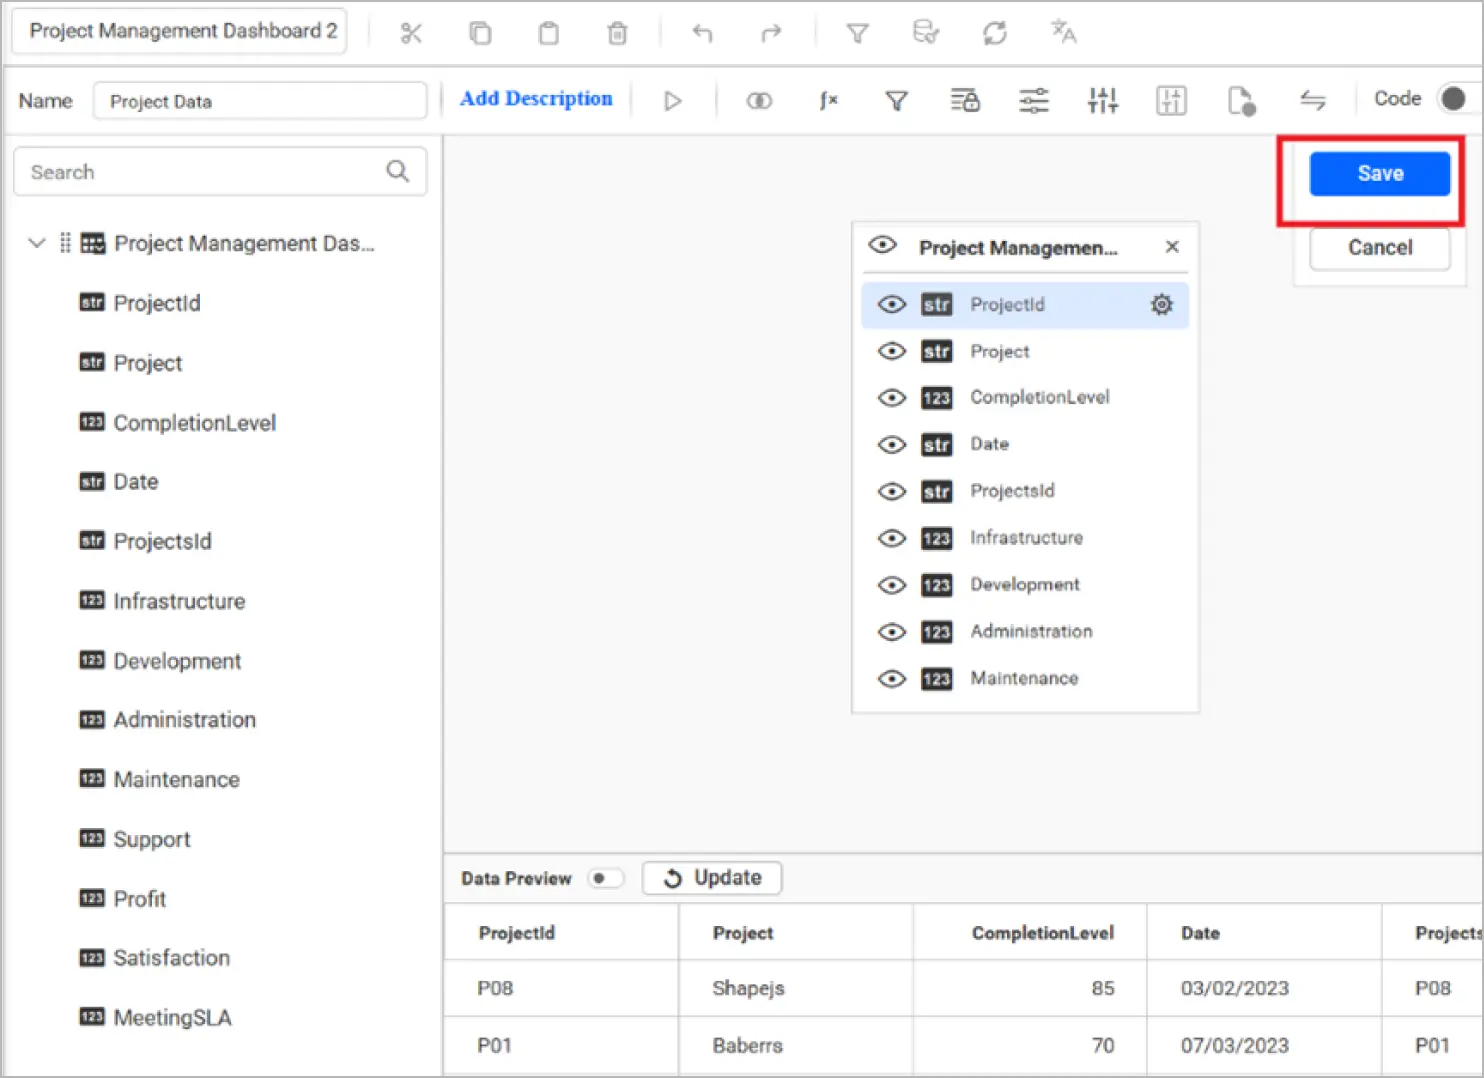
Drag and drop the table you want to analyze and save the data source.
How to integrate SharePoint data with other data sources
Combining data from multiple sources is a common requirement for various online applications. To combine multiple data sources, use the Shared Tables panel at the bottom of the data source designer.
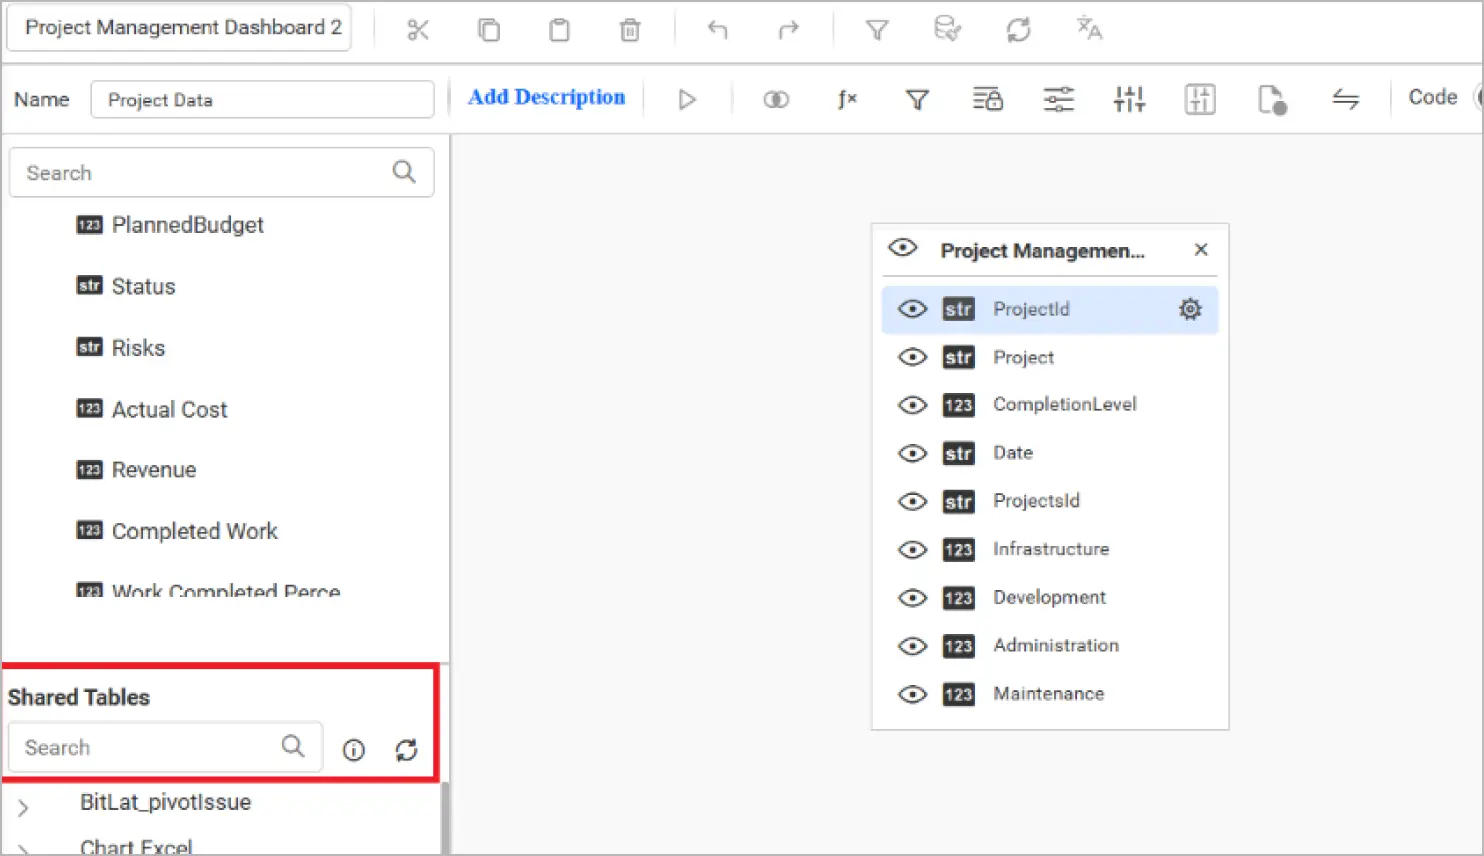
This pane displays the data sources you have permission to access. By default, the data sources you created previously for this or any other dashboard will be listed here. You can drag them to the canvas, as shown in the image, to join them.
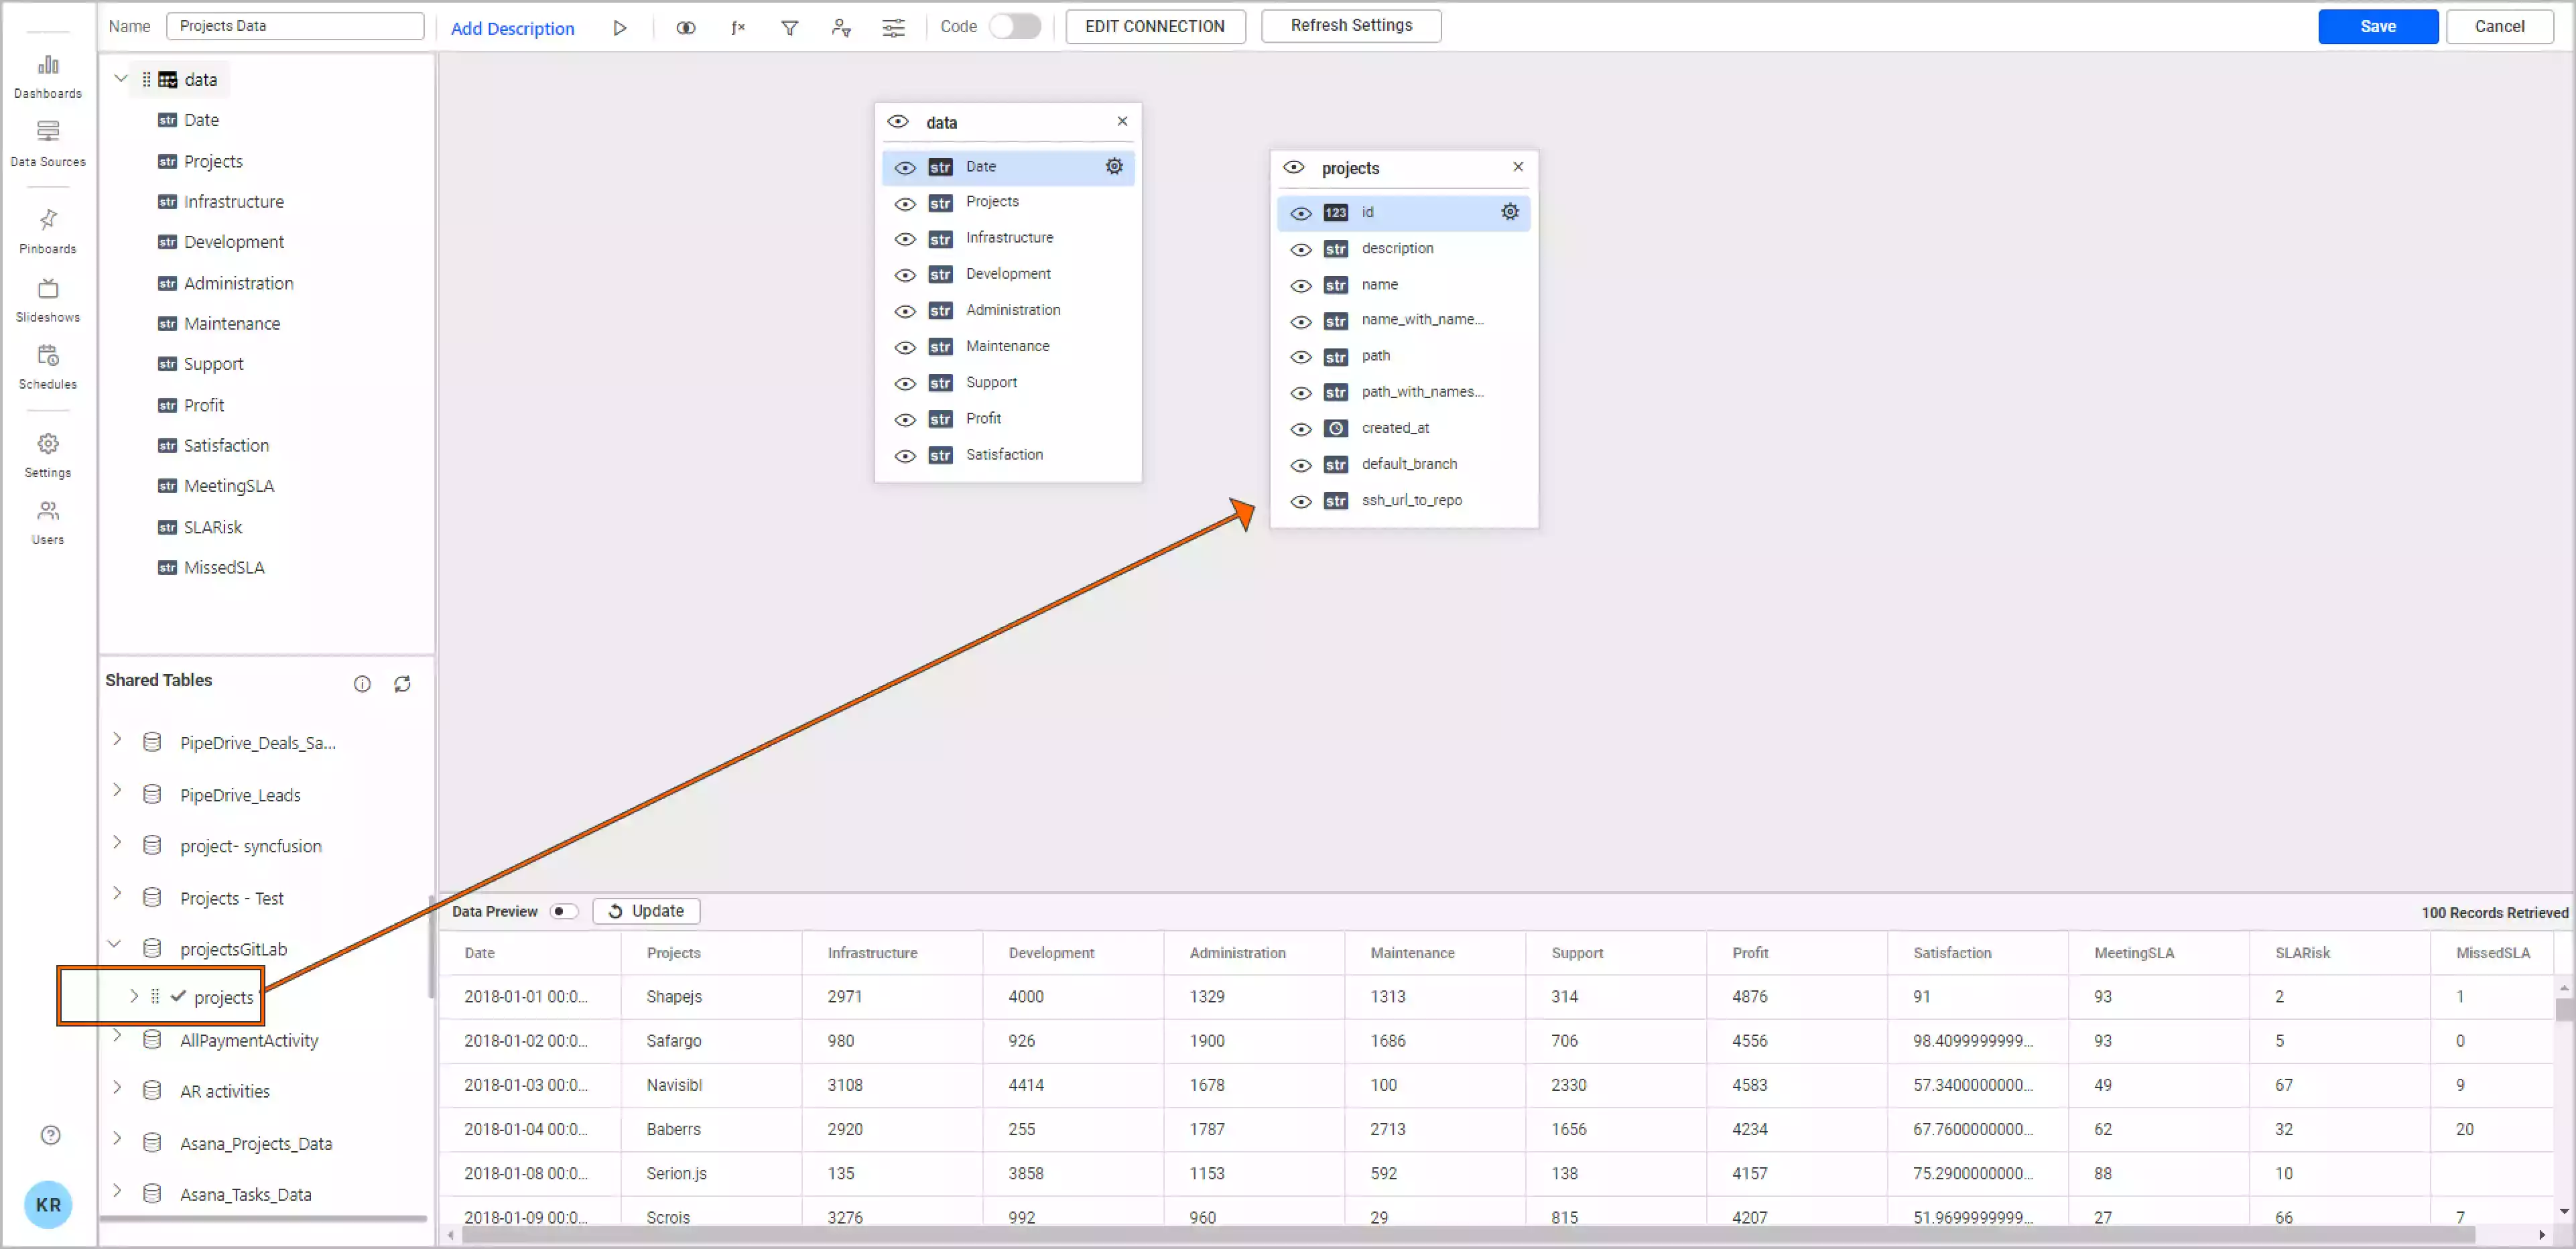
Now that you’ve successfully connected your SharePoint data source, the next step is to transform that data into a meaningful dashboard. Let’s see what metrics we can create from this SharePoint data in an interactive dashboard.
Creating a dashboard with SharePoint data
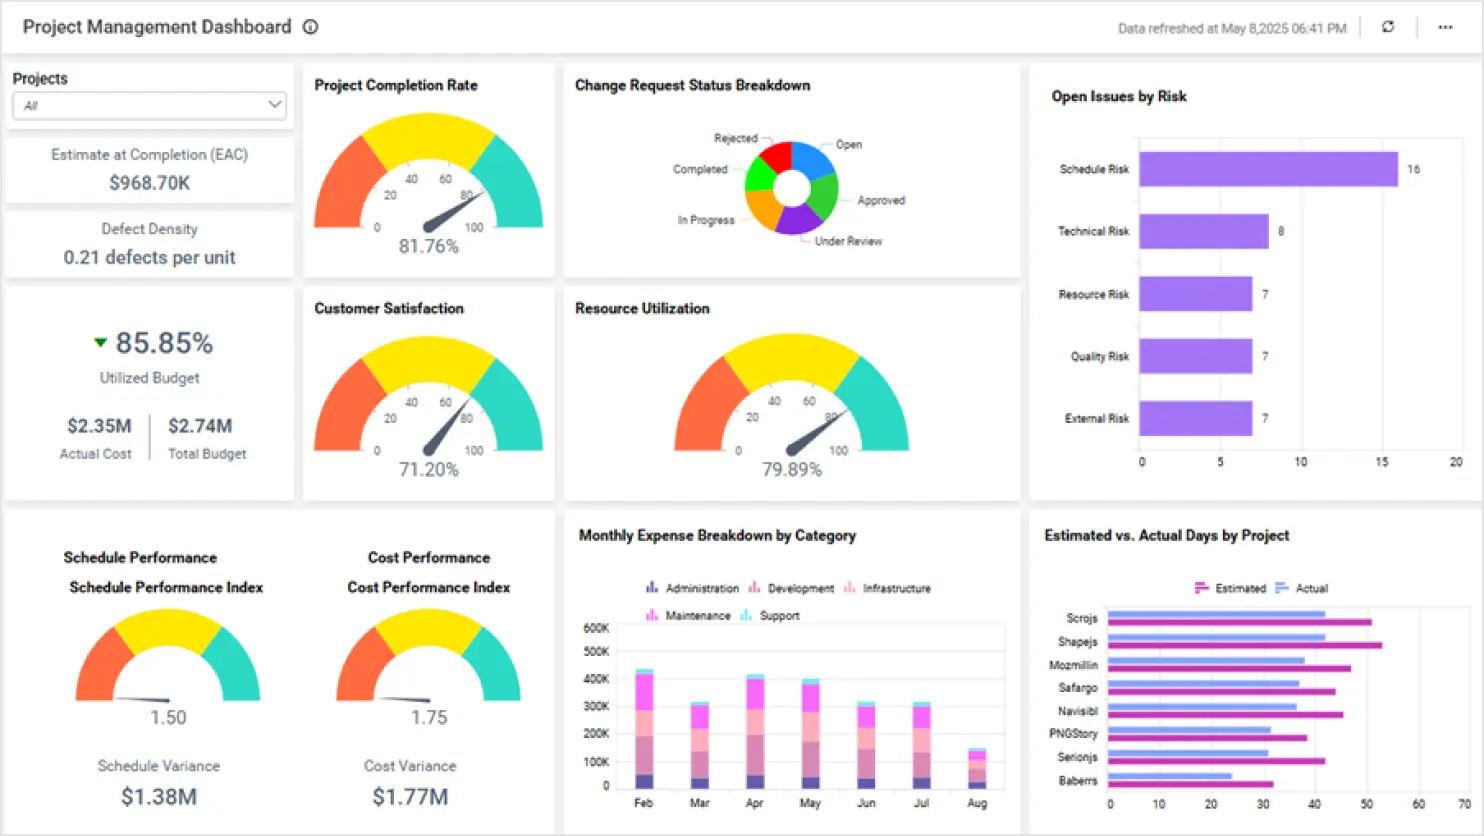
Using the data loaded from SharePoint, we can define metrics and KPIs to create a project management dashboard with the following metrics:
- Project completion rate
- Change request breakdown
- Open issues by risk
- Estimated at completion
- Defect density
- Utilized budget
- Customer satisfaction
- Resource utilization
- Monthly expenses breakdown by category
- Estimated vs. actual days by project
Scheduling data refreshes in your dashboard
You can schedule data refreshes in dashboards to keep your data up to date. With SharePoint storage, use the Refresh Settings option to create a schedule to move data from your cloud location to an intermediate database location.
You can add these refresh settings while connecting to SharePoint itself.
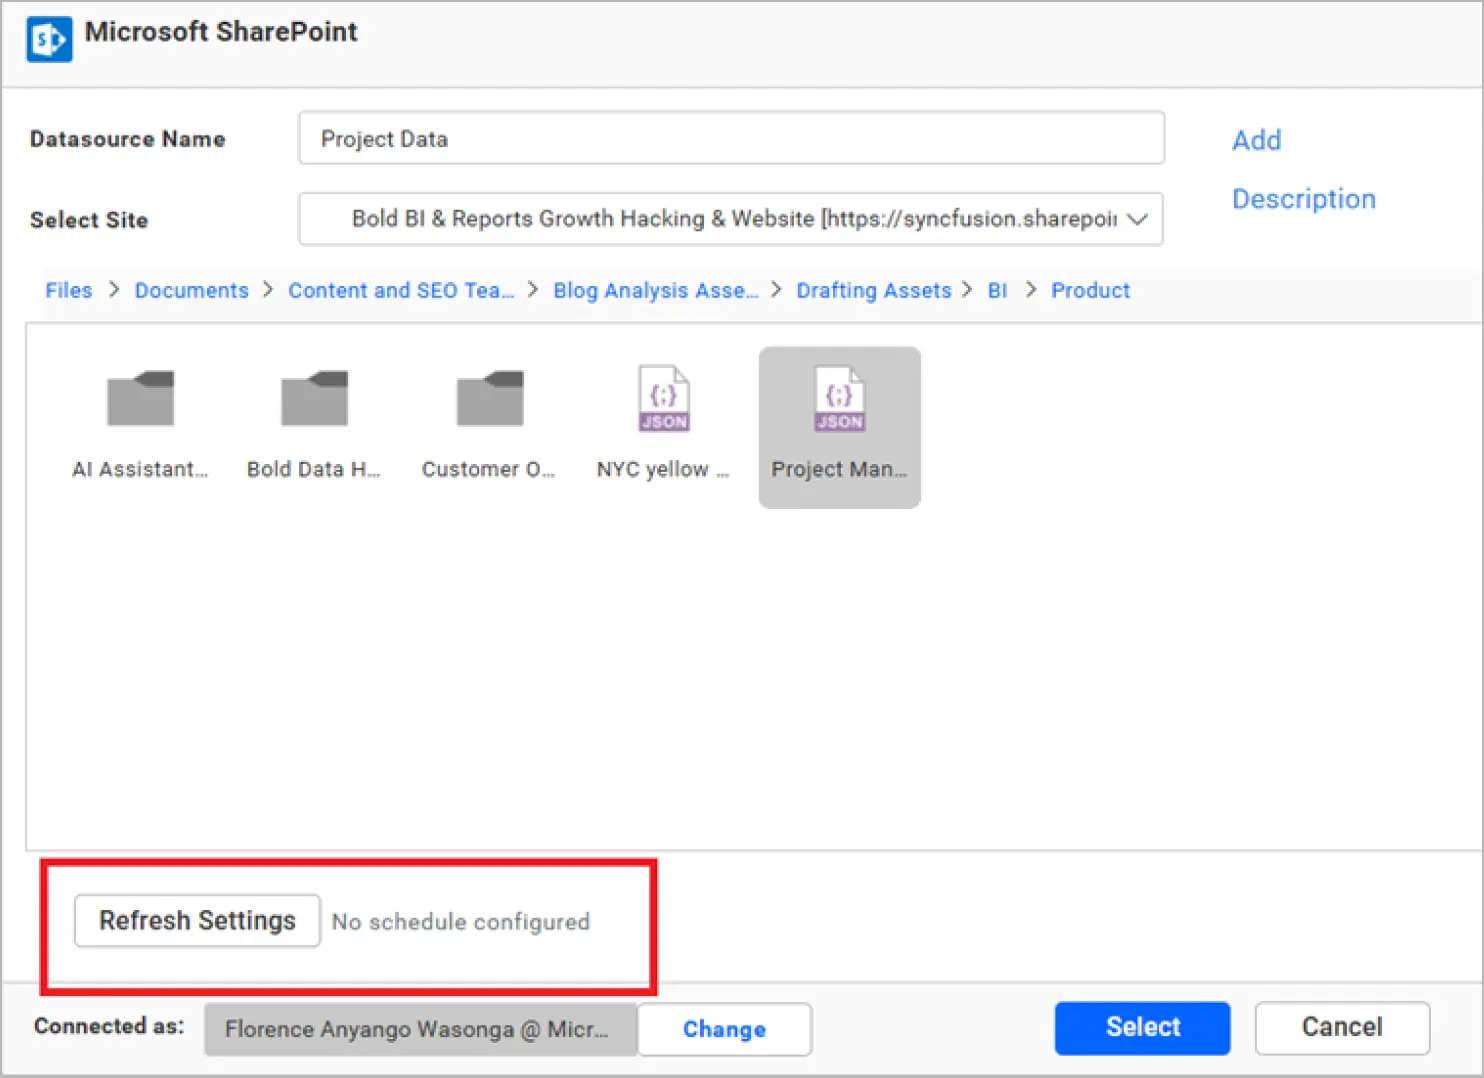
Click Refresh Settings to view the following configuration.
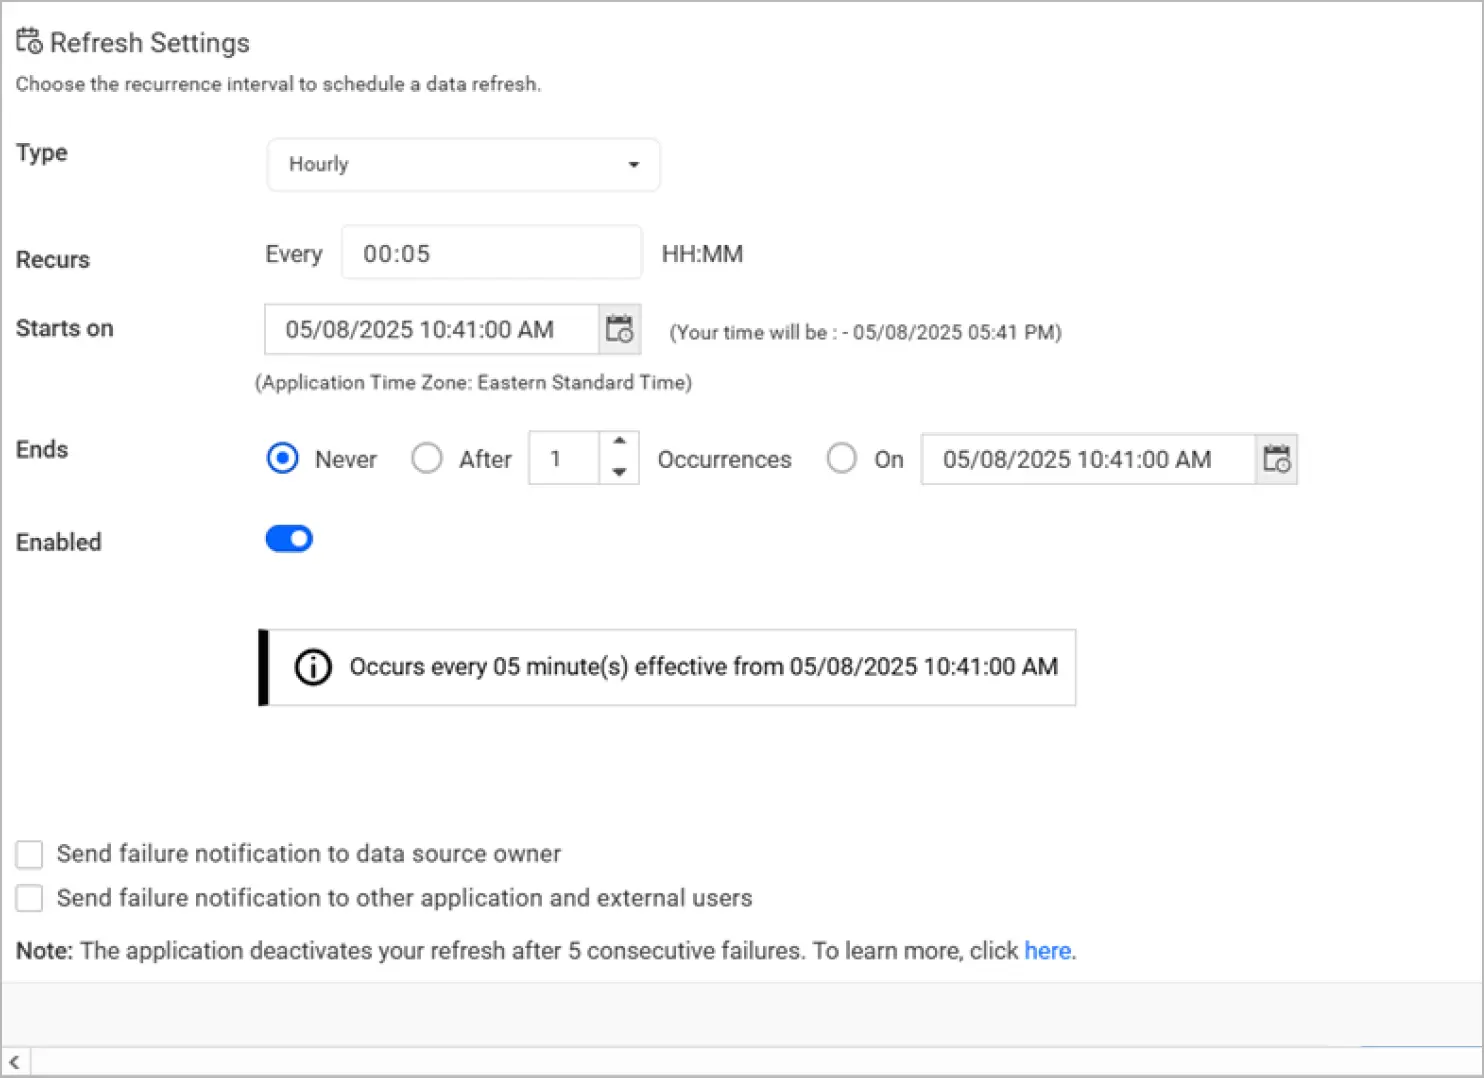
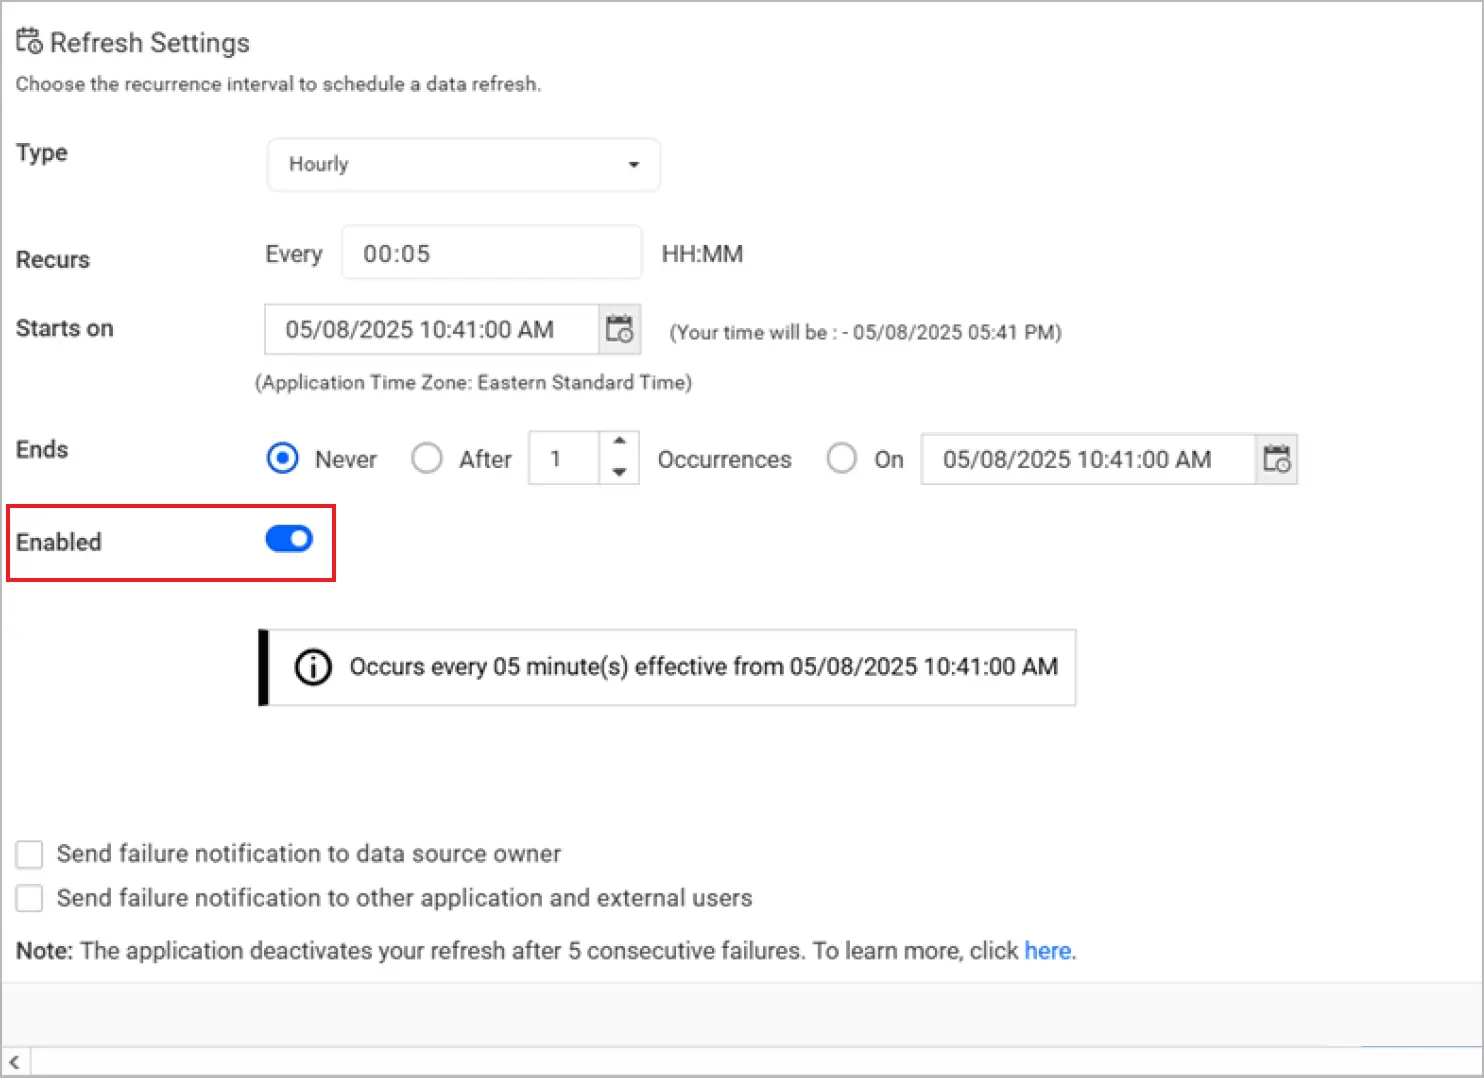
In the Refresh Settings window, you can schedule the data to refresh hourly, daily, weekly, or monthly and then refine this further in the Recurs section. I’m setting my dashboard to refresh every five minutes, as you can see in the following screenshot. This will automatically trigger a call to the API configured in the data source to keep the data up to date. If you do not want to synchronize your new data, turn off the Enabled toggle.
After the refresh is scheduled for the Project Management Dashboard, you can see the data updates in the dashboard every five minutes.
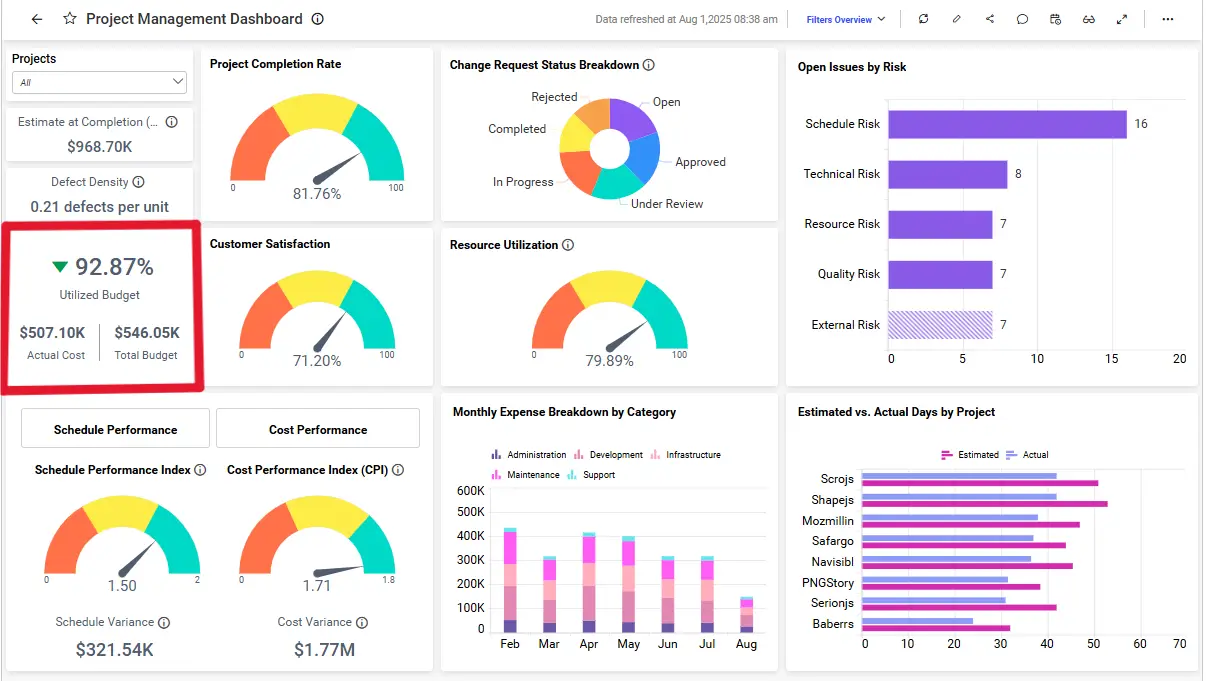
Now, you can easily embed this dashboard in a useful place with Bold BI. Here, we have integrated the project management dashboard into an ASP.NET Core application.
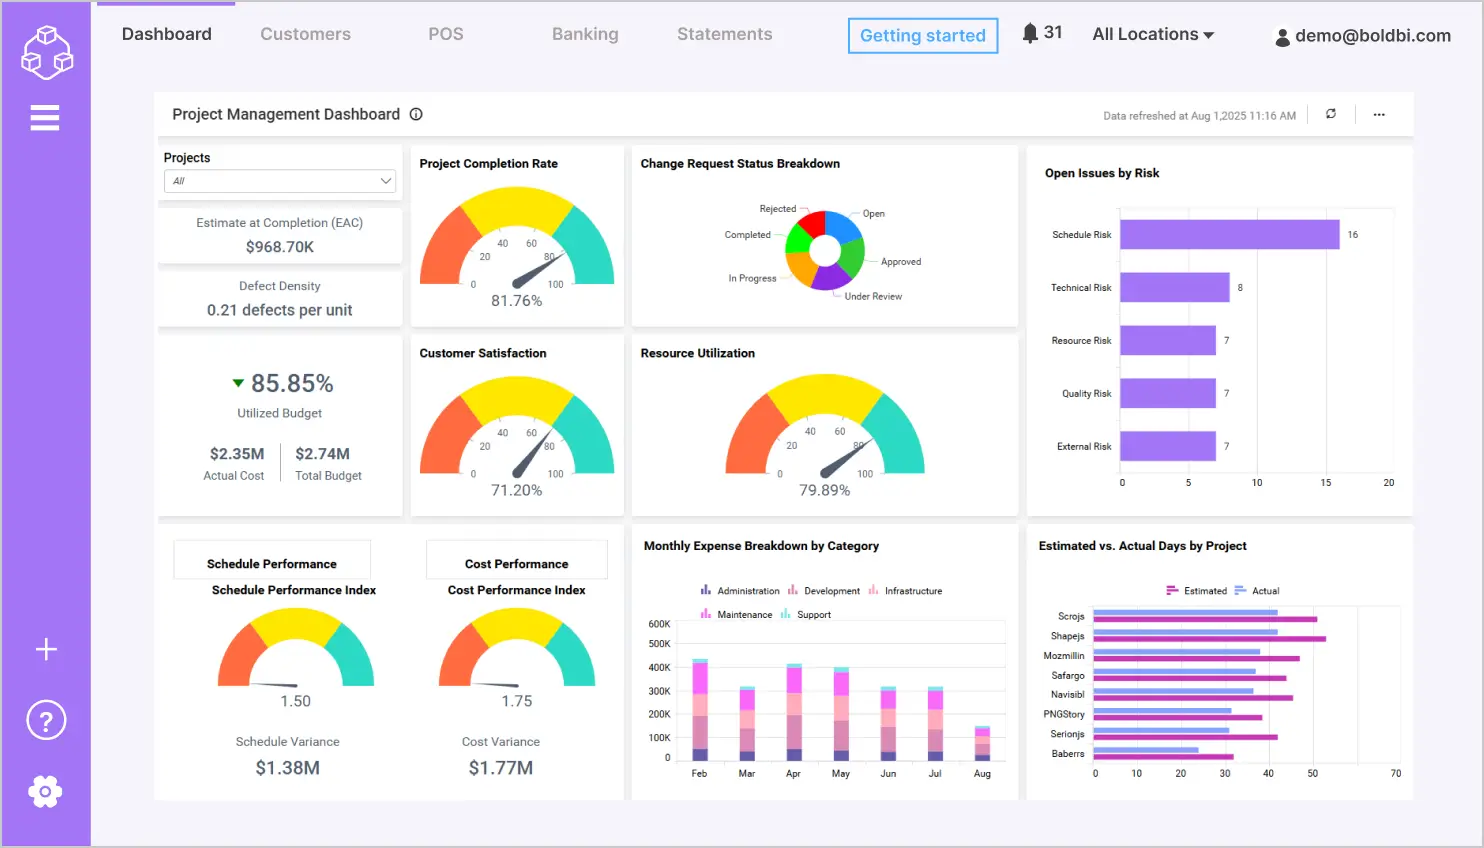
This way, Bold BI helps you utilize your dashboards in applications written in, for example, .NET Core, ASP.NET, ASP.NET MVC, or PHP. It also works well with JavaScript frameworks such as Angular, React, and Vue. To learn how to embed your dashboards into an application, please refer to this help documentation.
Conclusion
We hope this blog article guides you in building a dashboard using SharePoint data with Bold BI and embedding it into a web application. If you have any questions or need assistance, feel free to reach out through the Bold BI website. Simply log in to submit your inquiries if you already have an account.
Ready to turn your SharePoint data into actionable insights? Sign up for a free trial and start building interactive dashboards today.





