

Improve Your Labor Management with Embedded Pharmaceutical Analytics

Proper labor management in the pharmaceutical industry assists managers in working efficiently and harmoniously with their staff. It promotes productivity in key areas of the business, leading to improved production, sales, and ultimately profitability. No matter the gains, managers have the constant challenge of tracking and monitoring their staff’s daily operations. They have to manage labor while planning ahead and making the right decisions for the company’s achievements today and for years down the line.
Working with embedded analytics in pharmaceutical industry labor management provides insight into staff operations and activities. It also helps manage and utilize the revenue sources and avoid work redundancy and delays. In this blog post, I am going to explore the following subtopics:
- What is embedded analytics?
- Benefits of embedded analytics in managing pharmaceutical labor
- Bold BI’s Pharmaceutical Labor Dashboard
- How to embed analytical tools into pharmaceutical domain apps
What is embedded analytics?
Embedded analytics is the integration of analytical solutions and data visualization capabilities into a software application’s user interface to improve data comprehension and usability. Bold BI® helps you easily embed an analytics solution into your everyday work applications using a JavaScript SDK and server application. It also enables you to reduce dependency on analytics-focused IT teams and delivers all the insights you need to improve organizational and workforce outcomes.
Benefits of embedded analytics in managing pharmaceutical labor
Embedded analytics improves labor management by giving you an overview of the flow of operations. With this information, managers can develop better operational processes and achieve higher goals. Some of the key gains that can be achieved with embedded analytics include:
- Increase quality and production
- Enhance prescription rate
- Boost employee satisfaction
- Improve revenue management
Increase quality and production

Production is the root of pharmaceutical operations, and the area of production most valued by customers is the production quality. Embedded analytics helps track key metrics such as drug quality, average production per day, and more. Tracking these metrics helps product managers improve daily production to allow higher daily rates of prescribing. They also ensure products offered are high quality and worth prescribing, making it easier for sales teams to court more healthcare providers to prescribe their drugs.
Enhance prescription rate

The rate of prescribing determines the number of products sold by the industry. Embedded analytics in pharmaceutical industry labor management helps track key metrics and KPIs concerning this factor such as average prescription growth trend, prescriptions per day, average labor cost per prescription, average gross profit per prescription, and average revenue per prescription. Tracking these metrics helps pharmaceutical admins put more effort into the marketing process to enhance the prescription rate. It also helps them improve areas of the drug production and sales process that are holding back specific drugs from finding wider adoption by healthcare providers. Addressing these circumstances lead to increased revenue per prescription.
Boost employee satisfaction

Embedded analytics in pharmaceutical labor management gives team leads oversight into operations such as product shipments, marketing, sales, and more, allowing them to observe how employees approach and carry out their duties. By better understanding how roles are fulfilled, team leads can devise strategies that make each role easier to perform and more efficient. By making their work easier, employees are motivated and more satisfied with their work.
Improve revenue management

Embedded analytics in labor-management helps track key metrics such as salaries and wages, total revenue, revenue percentage, and more. Using this information, managers can set goals for revenues to ensure certain benchmarks are achieved by the company at specific times, such as 30% year-over-year revenue increases, or $50M in new drug sales within three years of launch. Tracking these metrics also helps managers gauge the market interest for specific products and reallocate resources as necessary to improve revenue streams.
Bold BI’s Pharmaceutical Labor Dashboard
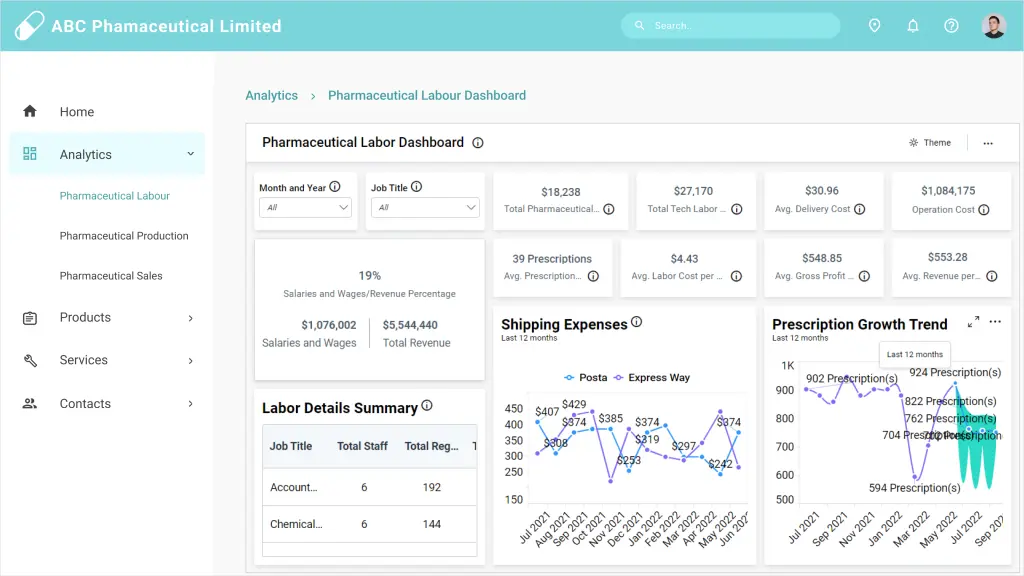
Embedding the Bold BI Pharmaceutical Labor Dashboard example provides summarized details about a pharmaceutical company’s labor management with metrics such as operation costs, labor costs, revenue and gross profit per prescription, work hours per job title, and prescription growth rate.
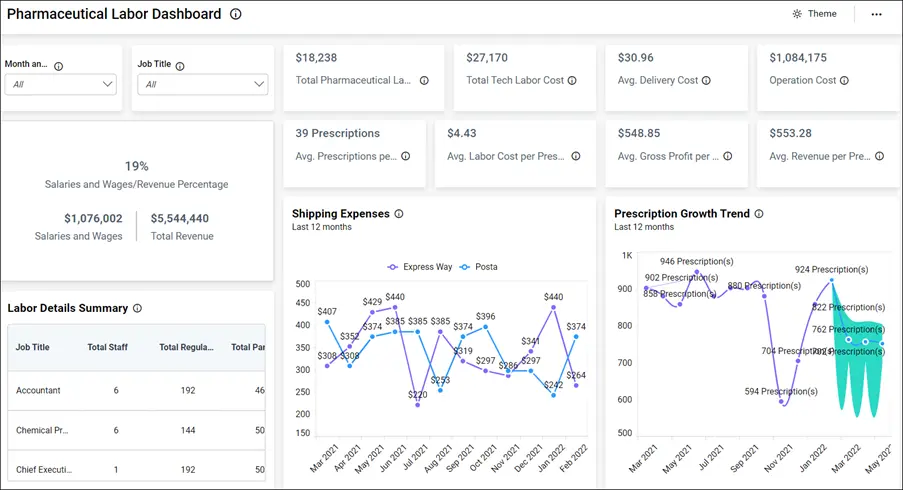
The following metrics and KPIs are visualized in the dashboard:
- Total pharmaceutical labor cost
- Total tech labor cost
- Average delivery cost
- Operation cost
- Average prescriptions per day
- Average labor cost per prescription
- Average gross profit per prescription
- Average revenue per prescription
- Salaries and wages/revenue percentage
- Prescription growth trend
- Shipping expenses
- Labor details summary
Total pharmaceutical labor cost
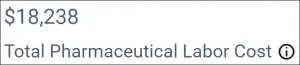
This card widget shows the total labor cost per prescription for the selected month.
Total tech labor cost
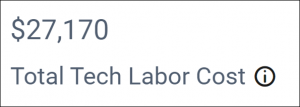
This card widget shows the total tech labor cost per prescription for the selected month.
Average delivery cost
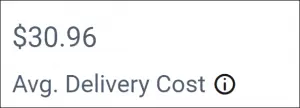
This card widget shows the average delivery cost for postage and transportation per prescription for the selected month.
Operation cost
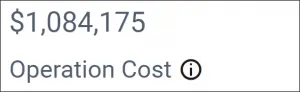
This card widget shows the total staff salaries and shipment costs at the end of the selected month.
Average prescriptions per day
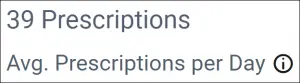
This card widget shows the average number of prescriptions filled per day for the selected month.
Average labor cost per prescription
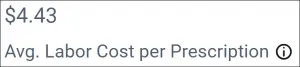
This card widget shows the average labor cost per prescription for the selected month.
Average gross profit per prescription
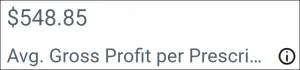
This card widget shows the average gross profit per prescription for the selected month.
Average revenue per prescription
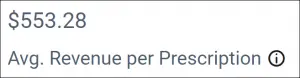
This card widget shows the average revenue realized per filled prescription for the selected month.
Salaries and wages/revenue percentage
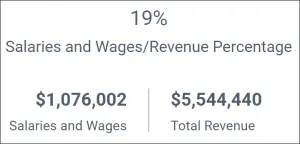
This KPI card shows the total values of salaries/wages and revenue and expresses the relationship between the two as a percentage.
Prescription growth trend
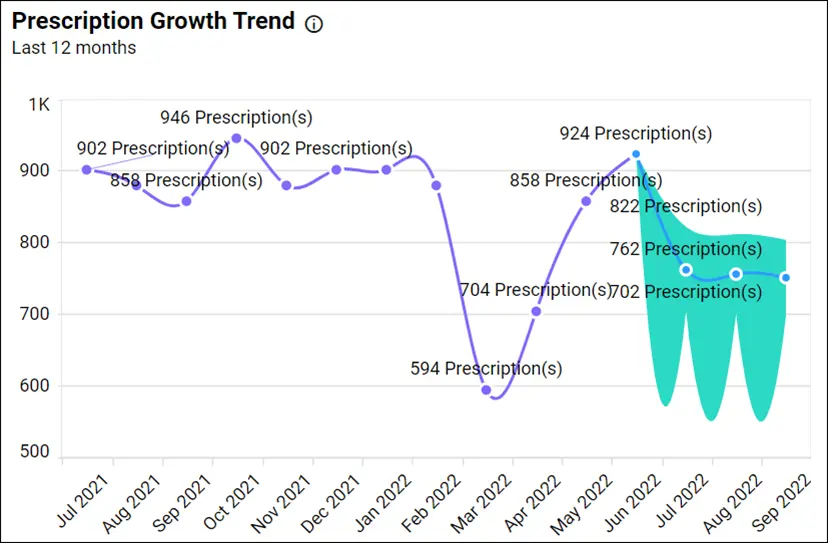
This spline distribution graph shows the trend in the number of prescriptions throughout the year. This gives managers insight into how treatments and the administration of drugs ebb and flow, giving them the ability to adjust production and supplies accordingly and decrease production waste.
Shipping expenses
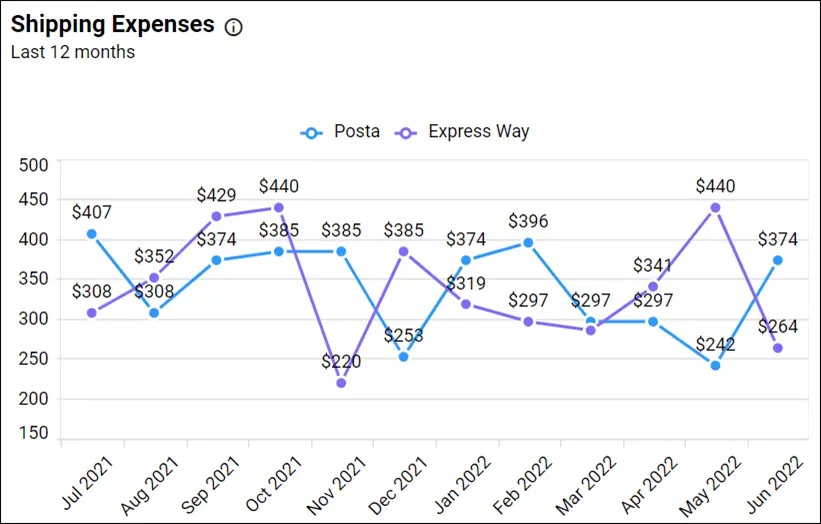
This line chart shows the standard and express shipping costs broken down by month. It assists the pharmaceutical administration team in making the best shipping decisions to cut costs.
Labor details summary
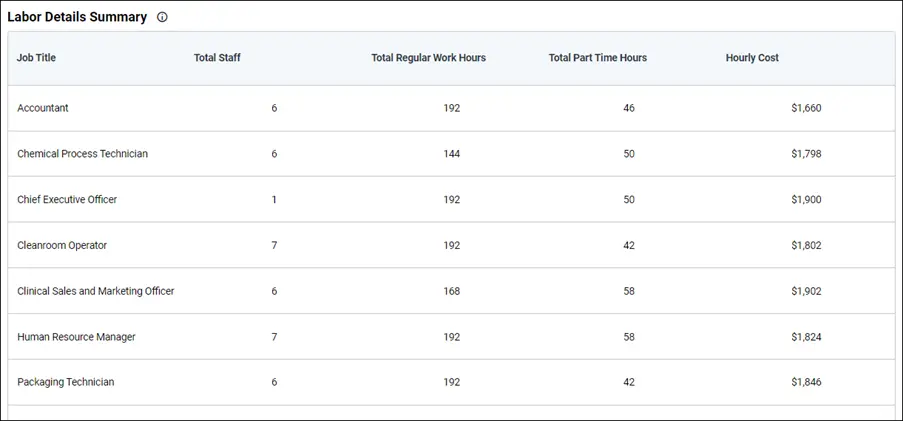
This grid shows the labor details like job title, regular work hours, hourly pay, and part-time hours worked. Being able to see and analyze this fine-grained level of information helps company directors create better working situations for employees across departments and disciplines, and helps the company serve their clients better.
To learn more about the metrics and KPIs used in this dashboard example, refer to the Pharmaceutical Labor Dashboard demo.
How to embed analytical tools into pharmaceutical labor apps
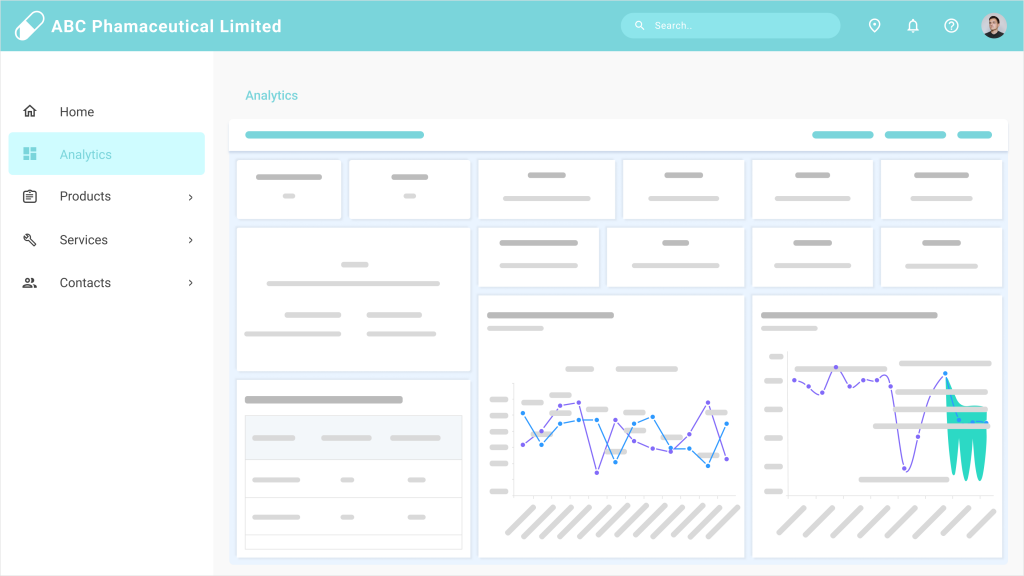
Let’s see how analytics can be embedded into the web applications of pharmaceutical companies. Bold BI helps you embed dashboards in more than 18 web platforms, including React with ASP.NET Core, React with Go, WinForms, Node.js, Vue with Go, and Vue with ASP.NET Core. In the rest of this blog, I will explain how to embed dashboards into your Angular applications. Consider a scenario in which your company has a website like the one shown in the following image.
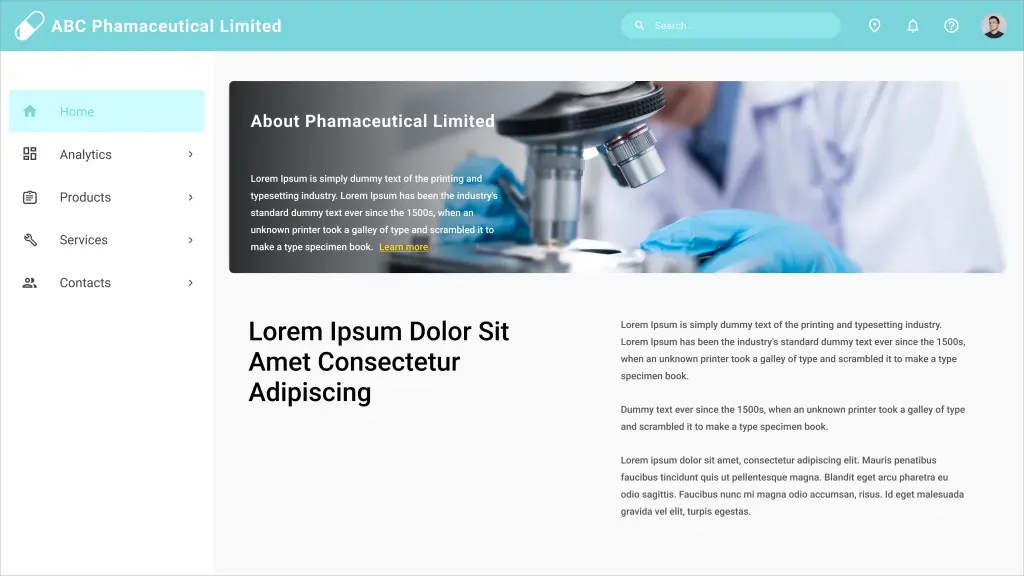
You can embed dashboards easily using Bold BI and avoid building an analytics or BI solution yourself. Follow these steps to embed your dashboard successfully.
Prerequisites
Download and install the Bold BI server on your local machine and create a dashboard. You can find the installation and deployment steps here.
Step 1: Create an Angular application.
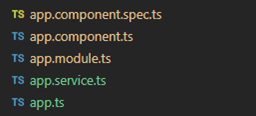
To successfully embed a dashboard in your application, you first need to create an Angular application. Create a new Angular project in Visual Studio Code and add the necessary TS files to the project as shown in the following image.
For more guidance, refer to the sample code in the Bold BI documentation.
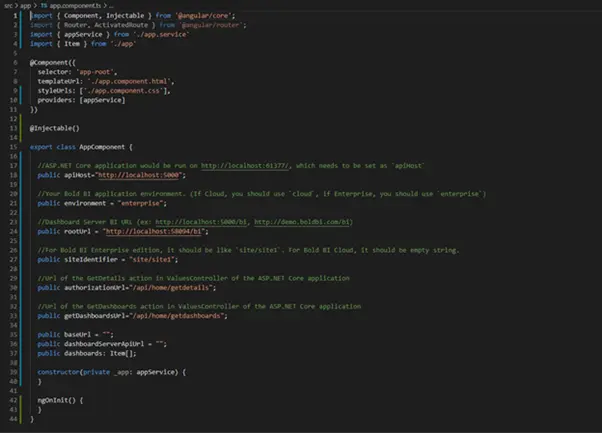
In this demonstration, the Angular application acts as a client, and an ASP.NET Core application acts as a server. You need to add several properties in the app.component.ts file as shown in the following table and screenshot.
|
Properties |
Property Value Descriptions |
|
RootUrl |
Bold BI dashboard server URL. For example: https://localhost:5000/bi. |
|
SiteIdentifier |
For Bold BI, it should be something like site/site1. For Bold BI Cloud Analytics Server, it should be an empty string. |
|
Environment |
Your Bold BI application environment. If using Bold BI Cloud Analytics Server, you should use cloud. If using Bold BI, you should use enterprise. |
|
User Email |
The Bold BI server will use an email address to authorize the authorization erver. |
import { Component, Injectable } from '@angular/core';
import { Router, ActivatedRoute } from '@angular/router';
import { appService } from './app.service';
import { Item } from './app';

@Component({
    selector: 'app-root',
    templateUrl: './app.component.html',
    styleUrls: ['./app.component.css'],
    providers: [appService]
})

@Injectable()

export class AppComponent {

    //ASP.NET Core application would be run on http://localhost:61777/, which needs to be set as "apiHost"
    public apiHost = "http://localhost:5000";

    //Dashboard Server BI URL (ex: http://localhost:5000/, https://demo.boldbi.com/bi/)
    public rootUrl = "http://localhost:5000/bi";

    //For Bold BI Enterprise edition, it should be like 'site/site'. For Bold BI Cloud, it should be empty string.
    public siteIdentifier = "site/site1";

    //Url of the GetDetails action in ValuesController of the ASP.NET Core application
    public authorizationUrl = "/api/home/getdetails";

    //Url of the GetDashboards action in ValuesController of the ASP.NET Core application
    public getDashboardUrl = "/api/home/getdashboards";
    public baseUrl = "";
    public dashboardServerApiUrl = "";
    public dashboards: Item[];
    constructor(private _app: appService) {
    }
    ngOnInit() {
    }
}
Step 2: Create a Bold BI instance.
After the Angular web application is created, you need to create a Bold BI instance to communicate between the server side (any web application) and the client side (Angular application), which allows us to embed a Bold BI dashboard in the Angular application.
Step 3: Create an authorization server to authenticate the Bold BI server.
Every application that embeds a Bold BI dashboard or widget must be authorized with the Bold BI server. This authentication step requires sending confidential information to the Bold BI server, such as users’ email addresses, group data, and embed signatures. So, in your server application, implement this authentication flow and provide the URL for connecting to your server in the Bold BI Embedded instance.
Step 4: Run the Angular application to view the embedded dashboard.
In the Angular application, enter the authorization URL and dashboard URL that were defined in the ASP.NET Core application. Finally, you can that see the dashboard created in the Bold BI server is embedded in your web application.
By following the previous steps, you can embed your dashboard into your Angular application.
To learn more about embedding dashboards into your Angular applications, refer to this blog. You can also download the sample code used in the previous steps from our documentation.
Conclusion
Bold BI® helps you integrate dashboards in your applications written in ASP.NET Core, ASP.NET MVC, Angular, ASP.NET, and Ruby on Rails. It will help you save time and prevent you from doing redundant work. Click this link to explore its features.
I hope now you have a better understanding of Bold BI and how it can help you manage pharmaceutical labor to be more successful. You can create a dashboard any way you like with Bold BI’s 35+ widgets and 150+ data sources.
Get started with Bold BI by signing up for a free trial and begin creating interactive business intelligence dashboards. You can contact us by submitting questions through the Bold BI website or, if you already have an account, you can log in to submit your support questions.





