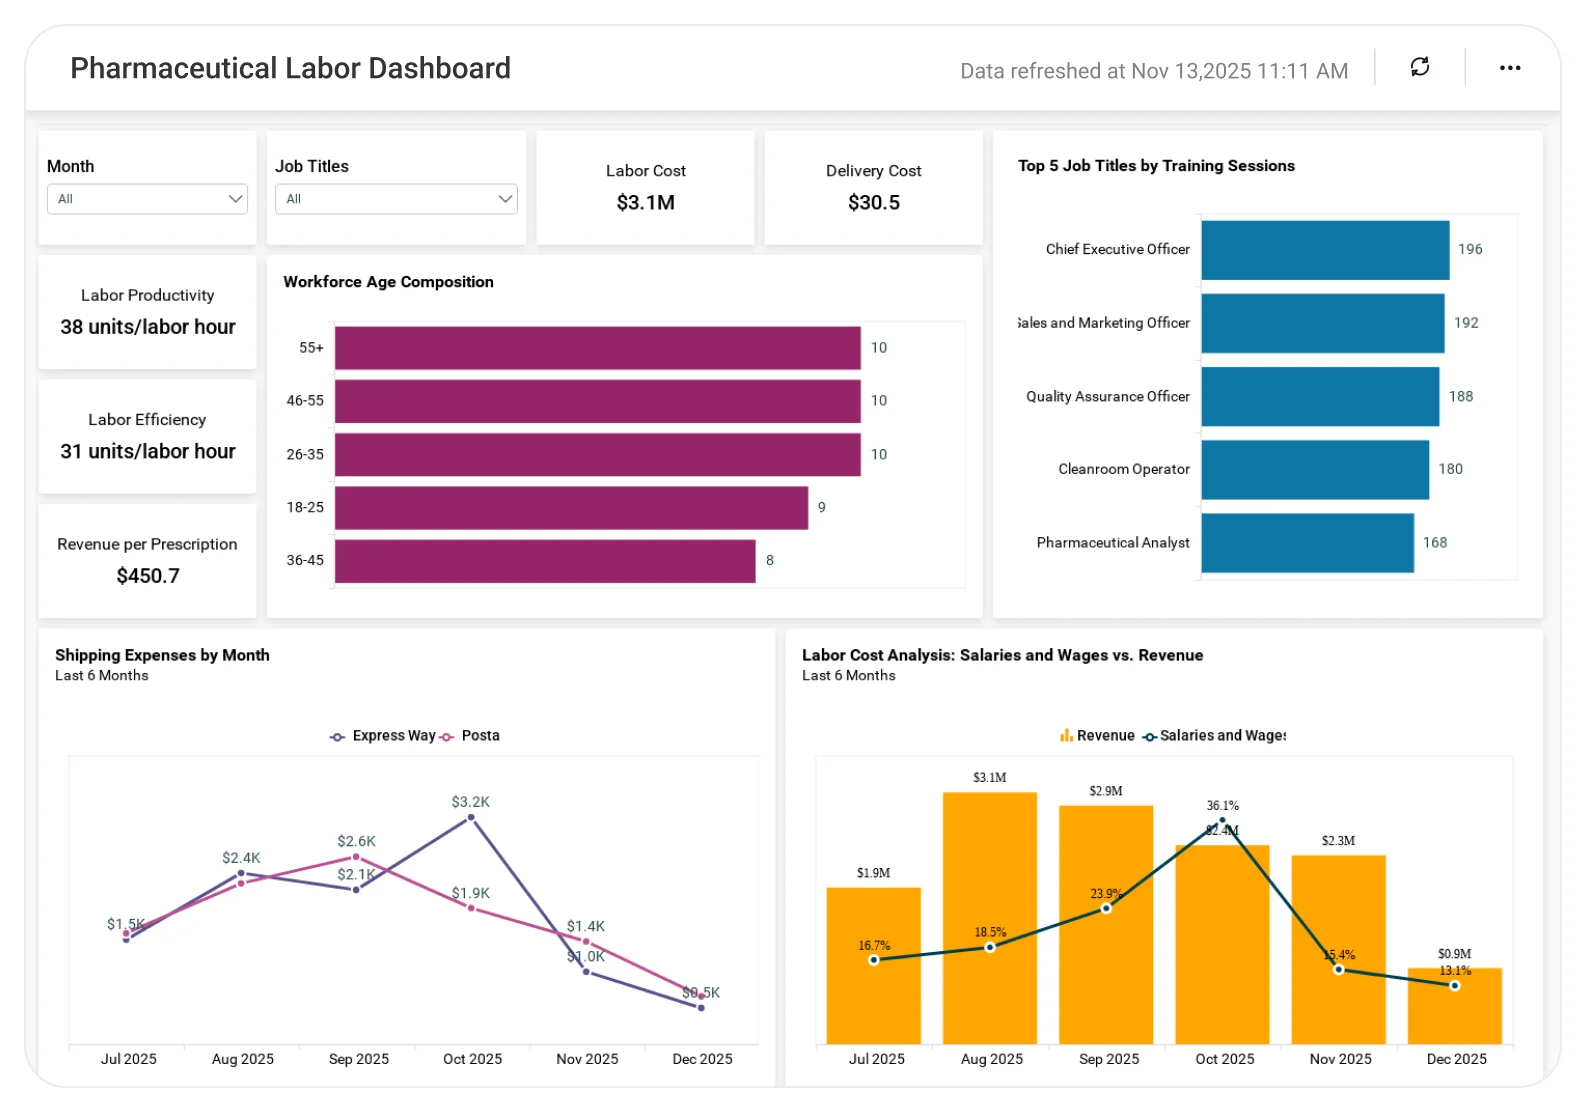
Pharmaceutical Labor Dashboard
Understand labor utilization and workforce costs to improve operational efficiency.
The Pharmaceutical Labor Dashboard helps teams analyze staffing levels, labor hours, productivity, and cost distribution across operations, enabling better workforce planning, cost control, and compliant pharmaceutical production.
TL;DR
-
Salaries and wages as a percentage of revenue.
-
Pharmaceutical and technology labor costs.
-
Average delivery and shipping expenses.
-
Labor cost, revenue, and gross profit per prescription.
-
Prescription volume trends and short-term forecasts.
What Is a Pharmaceutical Labor Dashboard?
A Pharmaceutical Labor Dashboard is a visual analytics solution that helps organizations monitor workforce costs, operational expenses, and prescription performance over time.
In Bold BI, it becomes an interactive dashboard with KPIs, charts, grids, and filters that automatically update from labor and prescription data sources.
Why Pharmaceutical Labor Dashboard Matters
Labor is one of the largest cost drivers in pharmaceutical operations.
Without a centralized dashboard:
-
Labor expenses are hard to connect to revenue.
-
Cost inefficiencies remain hidden.
-
Future prescription demand is difficult to anticipate.
What You’ll Track
-
Labor cost overview: Salaries, wages, pharmaceutical labor cost, and technology labor cost relative to revenue.
-
Operational expenses: Operating costs, average delivery cost, and shipping expenses over time.
-
Cost per prescription: Average labor cost, gross profit, and revenue generated per prescription.
-
Prescription volume trends: Prescriptions filled over the past nine months with projections for upcoming months.
-
Workforce details: Staff count, total work hours, and pay rates by job title.
All dashboards are fully customizable, allowing you to add KPIs or metrics as needed.
How It Works
-
Select the Pharmaceutical Labor Dashboard sample.
-
Blend labor costs, wages, delivery expenses, prescriptions, and revenue data in one view.
-
Share role-based dashboards with operations managers, finance teams, and leadership.
-
Track labor efficiency, control costs, and plan workforce needs with confidence.
Why Bold BI Is the Right Fit for Pharmaceutical Labor Analytics
Pharmaceutical operations teams choose Bold BI because it connects labor costs directly to business performance.
-
Connect labor and finance data easily: Integrates payroll, operations, prescription, and finance data from multiple systems.
-
Centralize cost visibility: Combines labor, delivery, shipping, and revenue metrics in one view.
-
Support cost-to-revenue analysis: Helps leaders understand how labor costs impact profitability.
-
Enable planning and demand forecasting: Review historical trends and project near-term prescription demand.
-
Deploy flexibly: Supports cloud and self-hosted deployment for pharmaceutical organizations.
Compare Options (at a glance)
| Feature | Bold BI Pharmaceutical Labor Dashboard | Internal Reports | Spreadsheets |
| Labor cost & revenue analysis | Yes | Limited | Manual |
| Delivery & shipping expense tracking | Yes | Limited | Manual |
| Cost per prescription insights | Yes | Limited | Manual |
| Prescription trend forecasting | Yes | Limited | No |
| Role-based labor analysis | Yes | Limited | No |
Frequently Asked Questions
More Articles About Pharmaceutical Labor & Operations Analytics
-
Improve Your Labor Management with Embedded Pharmaceutical Analytics
Explains how pharmaceutical organizations use embedded analytics to monitor labor utilization, workforce efficiency, and operational costs helping to reduce overhead and improve productivity.
-
Increase Your Pharmaceutical Production with Embedded Analytics
Shows how connecting labor, operations, and sales analytics enables pharma teams to improve profitability, streamline processes, and make data-driven growth decisions.
-
Transforming Pharmaceuticals with Business Intelligence
Provides an overview of how BI dashboards support pharmaceutical manufacturing, labor management, quality monitoring, and sales performance through unified analytics.