Predictive Analytics in 2026: Why It Matters and Use Cases
TL;DR: Predictive analytics helps businesses forecast factors such as churn, demand, and revenue using historical data, statistics, and machine learning. In 2026, it plays a key role in helping organizations make proactive decisions, reduce risk, and improve operational efficiency across functions.
Introduction
Most dashboards show what has already happened. But in 2026, businesses need more than historical reporting. They need the ability to anticipate churn, forecast demand, detect risk early, and act before problems affect revenue or customer experience. That is where predictive analytics becomes essential. By combining historical and real-time data with statistical models and machine learning, predictive analytics helps organizations make faster, smarter, and more proactive decisions.
In this blog, we explore what predictive analytics is, why it matters in 2026, its key benefits, common challenges, major use cases, and the techniques that support it.
What is predictive analytics in 2026
Predictive analytics is an advanced analytics approach that uses historical and real-time data along with statistical models and machine learning to forecast future outcomes.
It helps organizations:
- Predict customer behavior.
- Forecast revenue and demand.
- Identify risks and anomalies.
- Improve operational planning.
In 2026, predictive analytics is a core capability of data-driven organizations.
Why predictive analytics matters in 2026
In 2026, predictive analytics plays a critical role in helping organizations operate with speed, precision, and confidence in increasingly complex environments. It supports:
- Smarter decision‑making: Predictive analytics enables leaders to move beyond hindsight reporting and make proactive decisions based on probabilities, trends, and future scenarios.
- Stronger risk management: By forecasting potential issues such as fraud, churn, demand shocks, and operational disruptions, organizations can mitigate risk before it impacts business outcomes.
- Improved customer experience: Anticipating customer behavior allows businesses to respond proactively, reduce friction, and deliver timely interventions that improve satisfaction.
- Personalization at scale: Predictive models analyze behavior, preferences, and patterns to deliver personalized recommendations, offers, and experiences across channels.
- Greater operational efficiency: Forecasting demand, workloads, and performance trends helps optimize inventory, staffing, supply chains, and resource utilization.
As data volumes grow and decisions become more time‑sensitive, predictive analytics gives organizations the ability to anticipate change, reduce uncertainty, and maintain a competitive edge in fast‑moving, data‑driven markets.
Common challenges in predictive analytics
While predictive analytics delivers powerful foresight, many organizations face the following obstacles when trying to implement it at scale:
- Data quality issues: Predictive models are only as reliable as the data they use. Missing, inconsistent, or inaccurate data can lead to flawed predictions and poor business decisions.
- Skill gaps: Building, validating, and maintaining predictive models often requires specialized data science and machine learning expertise, which can be a barrier for many teams.
- Model complexity and trust: As models become more advanced, explaining how predictions are generated becomes harder, making it challenging to gain trust from business users and stakeholders.
- Integration hurdles: Predictive insights lose impact if they remain isolated; they must integrate seamlessly into existing BI tools, dashboards, and operational workflows to drive action.
Modern predictive analytics platforms address these challenges by simplifying model creation and application.
How to overcome these challenges
Successfully implementing predictive analytics requires more than building accurate models. Organizations must focus on data quality, usability, and integration to ensure predictions drive real business impact. The following are best practices for deploying predictive analytics in a business:
- Start with clear business goals: Define specific questions predictive analytics should answer, such as reducing churn, forecasting demand, or identifying risk, so models are aligned with measurable outcomes.
- Ensure high‑quality and relevant data: Accurate predictions depend on clean, consistent, and well‑governed data, so invest in data preparation, validation, and continuous monitoring.
- Choose the right model for the problem: Simple models like linear regression may be sufficient for forecasting, while advanced models should be used only when complexity adds measurable value.
- Prioritize explainability and trust: Select models and visualization methods that business users can understand, as explainable predictions improve adoption and decision confidence.
- Integrate predictions into workflows: Embed predictive insights directly into dashboards, reports, and operational tools so teams can act without switching between systems.
By following these best practices, organizations can move predictive analytics from experimental models to trusted, decision‑driving capabilities embedded in everyday operations.
Common predictive analytics techniques used in 2026
The following algorithms are widely used, production‑ready, and relevant for modern BI and analytics workflows in 2026:
- Linear regression: Used for simple and explainable forecasting by showing how variables affect outcomes like sales or revenue.
- Decision trees: Create easy‑to‑understand rule‑based predictions by splitting data into logical decisions.
- XGBoost: Provides highly accurate business predictions by combining many decision trees efficiently.
- Time series forecasting (ARIMA and Prophet): Predicts future trends by analyzing historical patterns and seasonality over time.
- Neural networks: Detect complex patterns and anomalies for advanced predictive insights in large datasets.
While these techniques power predictive analytics, their real business value depends on how clearly predictions are presented, evaluated, and applied in decision-making. This is where platforms like Bold BI® help turn predictive outputs into accessible, actionable insights.
How Bold BI promotes predictive analytics in 2026
Predictive analytics becomes more valuable when forecasts and model outputs are easy for business teams to interpret and act on. While machine learning models generate predictions, BI platforms help bring those insights into day-to-day decision-making.
That is where Bold BI adds value. Bold BI supports predictive analytics by helping organizations connect data, visualize predictive outcomes, and deliver insights through interactive dashboards that are accessible to both technical and business users. Bold BI supports predictive analytics in several key ways:
- Built‑in predictive analytics support: Bold BI integrates with machine learning models and supports advanced calculations, enabling teams to visualize forecasts, trends, and predictive outcomes directly in dashboards.
- Connectivity with multiple data sources: Connect historical and real-time data from databases, cloud services, and APIs to power accurate predictive models and analytics.
- Interactive and dynamic dashboards: Present predictive results using charts, KPIs, filters, and drill-down features that allow users to explore what‑if scenarios and future projections.
- Embedded analytics for SaaS products: Seamlessly embed predictive dashboards into applications with tenant isolation, role‑based access, and white‑label branding.
- Developer‑friendly architecture: REST APIs, SDKs, and flexible deployment options make it easy to integrate predictive analytics into existing systems.
- Scalable and secure: Designed for multitenant environments, Bold BI ensures data governance, performance, and security as data volumes and users grow.
By combining predictive outputs with interactive reporting and embedded analytics, Bold BI helps organizations move from raw forecasts to practical, decision-ready insights.
Real‑world use cases of predictive analytics in Bold BI
Predictive analytics delivers the greatest value when insights are presented in a way that teams can easily monitor and act on. Bold BI helps organizations do this by turning predictive data into clear, visual, and contextual analytics experiences.
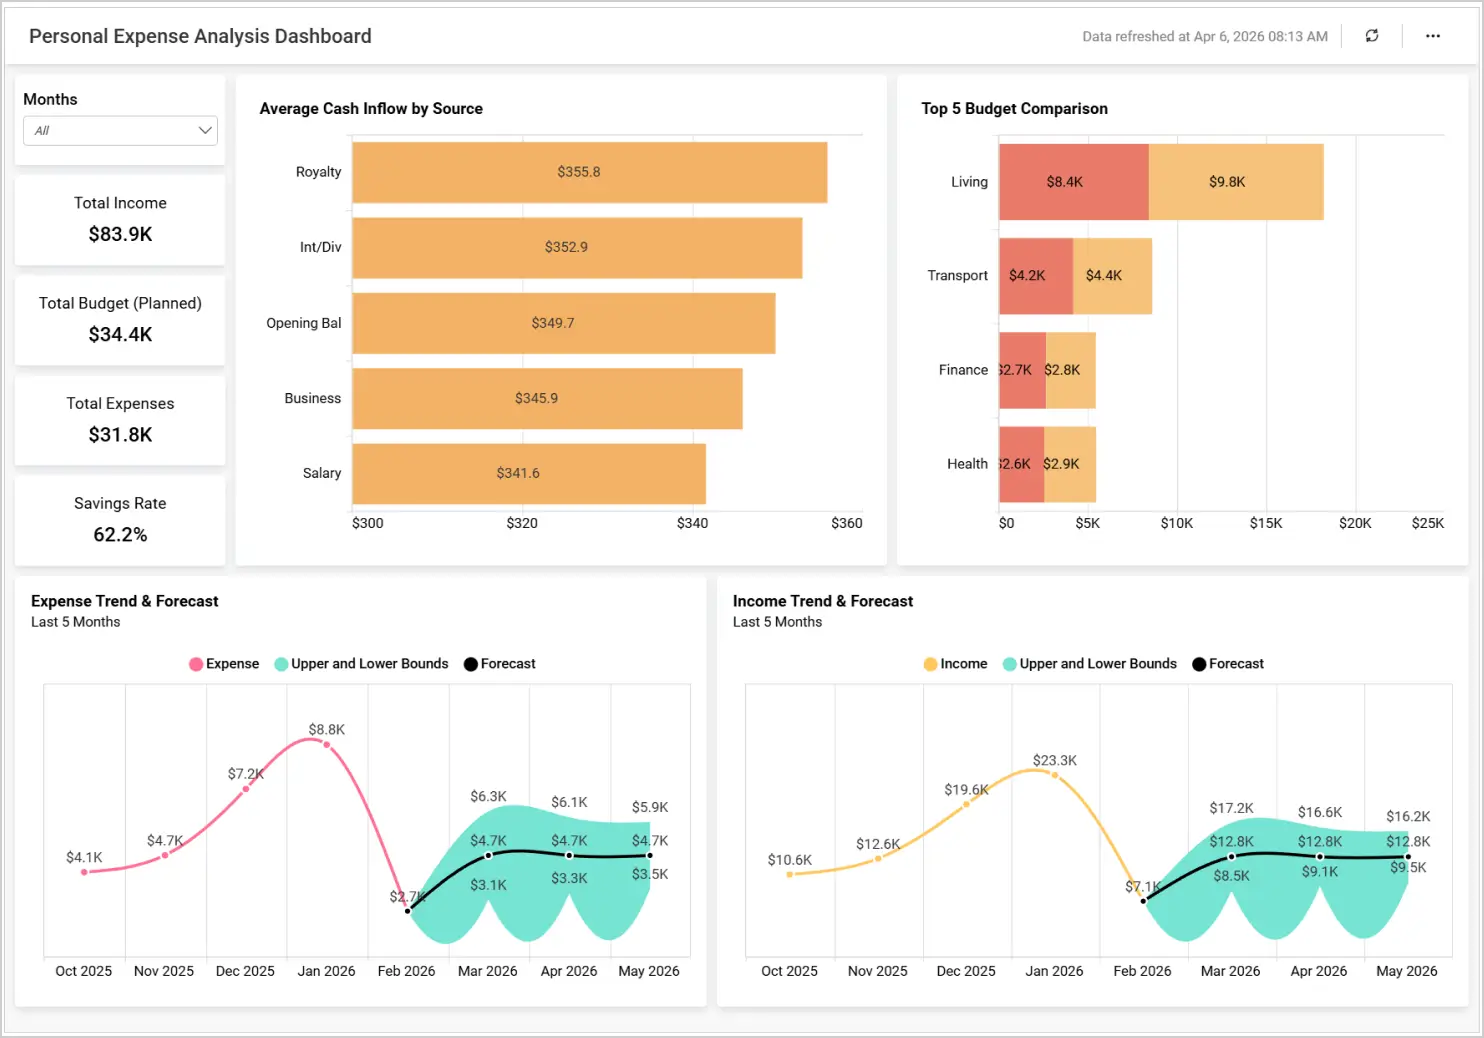
Finance
People often struggle with unexpected budget overruns because future spending patterns are not always easy to anticipate or interpret from raw predictive outputs. A personal expense analysis dashboard integrated with predictive analytics, delivered through a personal finance management app, helps solve this by visualizing forecasted spending patterns, enabling users to identify budget risks early and plan proactively for high-expense periods.
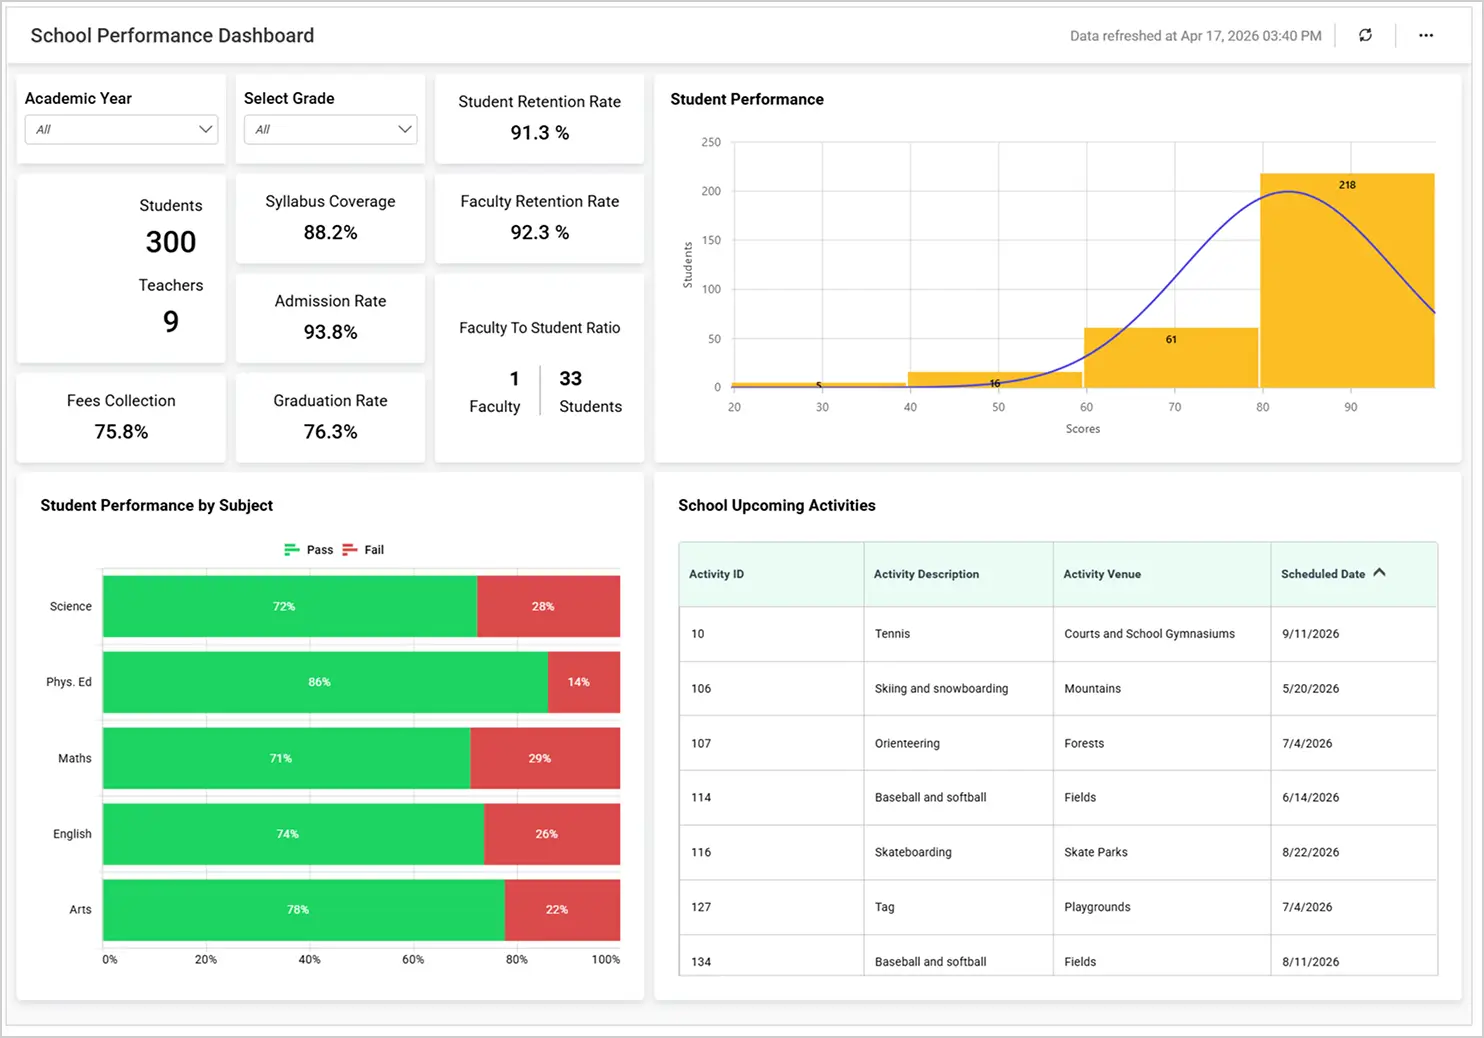
Education
Educational institutions often have trouble identifying at-risk students early enough to take meaningful action. A school performance dashboard addresses this by highlighting predictive indicators related to student performance and attendance, helping educators align timely interventions with academic goals.
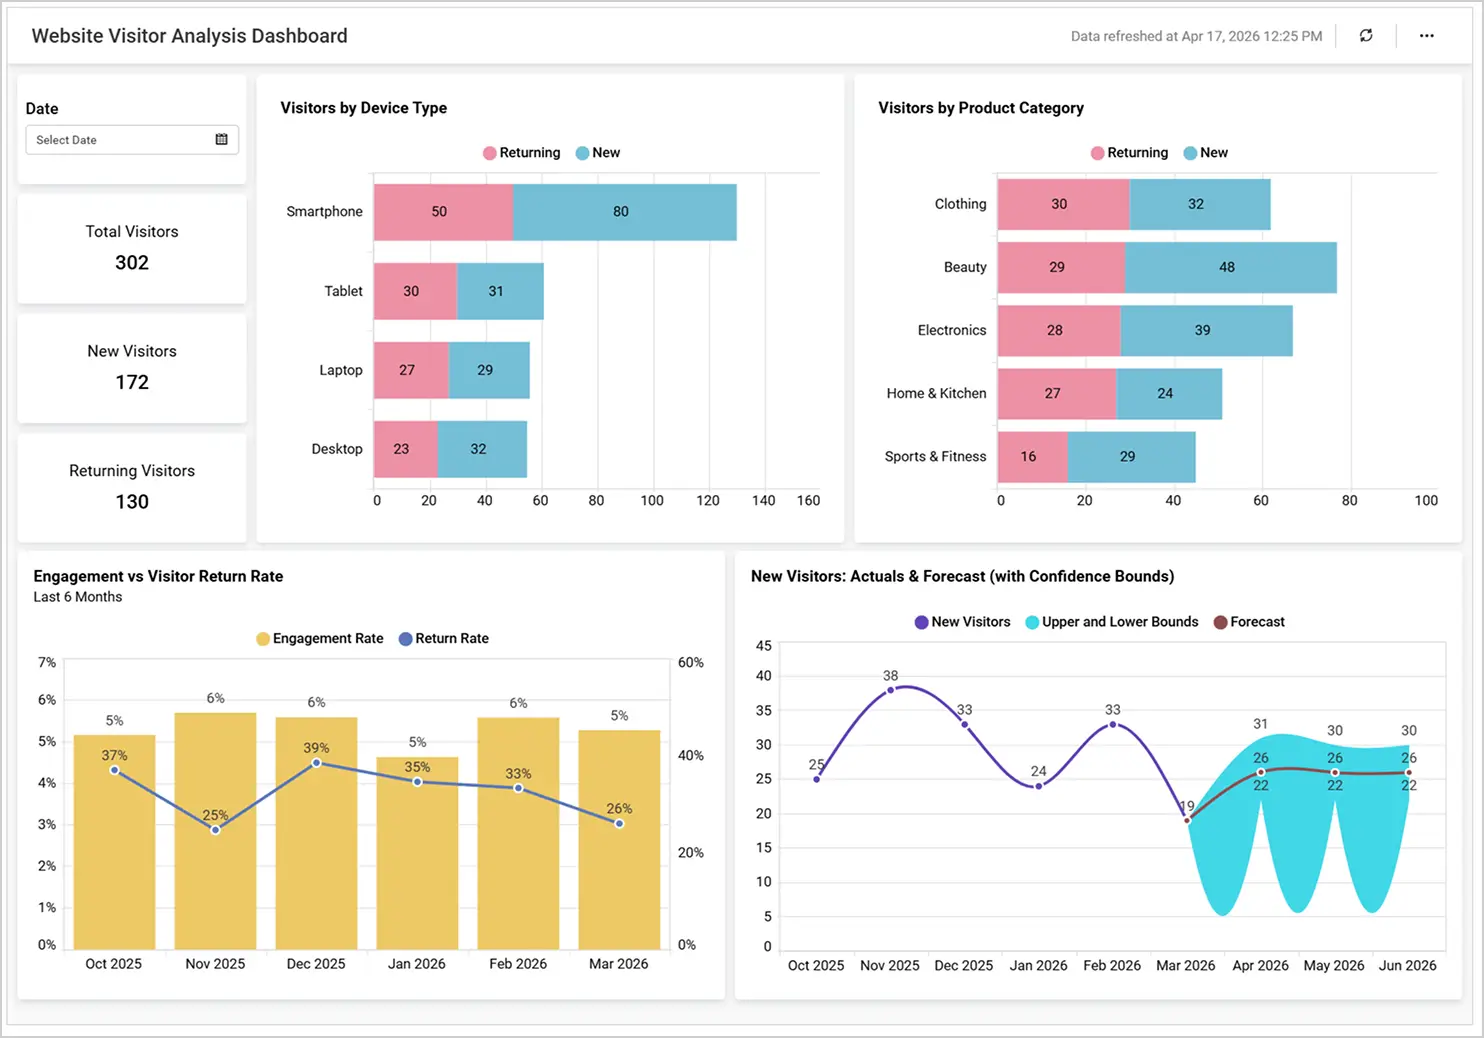
Marketing
Marketing teams frequently deal with sudden traffic fluctuations and audience drop-offs, making it difficult to adjust campaigns before performance declines. A website visitor analysis dashboard helps by visualizing predicted traffic trends alongside campaign metrics, allowing businesses to spot risks early and optimize engagement strategies proactively.
In each case, dashboards bridge the gap between predictions and decisions.
Predictive analytics trends shaping BI in 2026
Several recent trends are redefining how predictive analytics is used in BI:
- Greater focus on explainable predictions for business trust.
- Increased integration of real‑time and streaming data.
- Embedded ML outputs inside BI dashboards instead of separate tools.
- Stronger alignment between analytics and operational workflows.
- Reduced reliance on standalone data science environments.
These trends make visualization, monitoring, and context as important as algorithm choice.
Final thoughts
Predictive analytics success in 2026 is less about adopting the most complex algorithms and more about enabling predictions that business teams can understand, trust, and act on. When the right predictive approaches are paired with intuitive, embedded dashboards, insights move out of static models and into everyday decision‑making
Ready to experience Bold BI®? Sign up for a free trial or book a 30-minute personalized demo to discover how to create predictive-ready dashboards. New to analytics? No problem. Bold BI offers an onboarding process with expert guidance and support to help you get up and running quickly. To learn more, check out our blog, Predict the Future to Grow Business with Predictive Analytics.
Frequently asked questions
- 1.
- 2.
Do we need advanced data science or machine learning expertise to use predictive analytics in Bold BI?
Bold BI enables forecasting, trend analysis, and predictive visualizations through intuitive dashboard features that business users can easily configure and understand.
- 3.
Can we compare forecasted values with actual results?
Bold BI dashboards support side-by-side views of actual vs predicted values, helping teams evaluate forecast accuracy and refine future planning.
- 4.
Does Bold BI support real-time or scheduled updates for predictive dashboards?
Predictive dashboards can refresh automatically based on your data update schedule, ensuring forecasts stay aligned with the latest data.
- 5.
Can predictive analytics dashboards be customized for different teams?
You can create separate dashboards for sales, finance, operations, or leadership, each with tailored predictive KPIs, filters, and access controls.
- 6.
Is predictive analytics secure in Bold BI deployments?
Bold BI supports Row-Level Security, Single Sign-On, and Role-Based Access Control, and token authentication, and both cloud and on-premises deployments to meet enterprise security requirements.