
Bold BI for Predictive Analytics
Predict future outcomes with data-driven dashboards, anticipate trends, reduce risk, and plan smarter. Predictive analytics helps organizations move beyond historical reporting by using data patterns to forecast future outcomes. Whether you’re planning demand, identifying risks, or spotting growth opportunities, predictive analytics gives you the foresight needed to make confident business decisions.
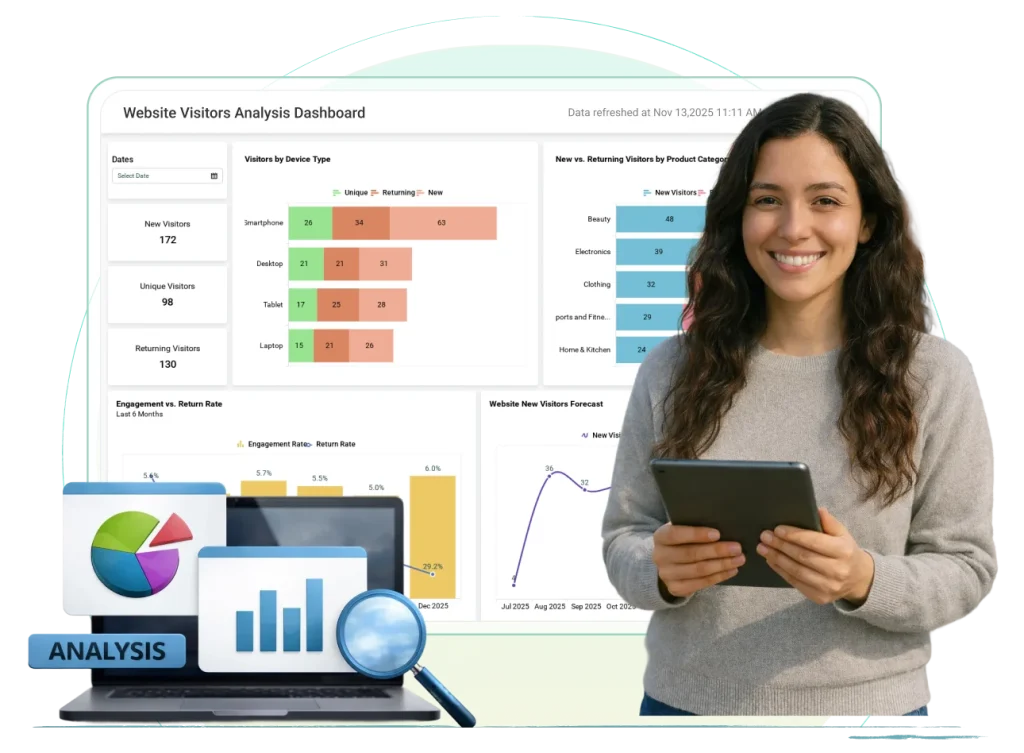
Predictive Analytics
With Bold BI, predictive analytics becomes visual and actionable. Instead of static models or complex tools, Bold BI brings forecasts, trends, and projections directly into interactive dashboards so business users can understand and act on insights faster.
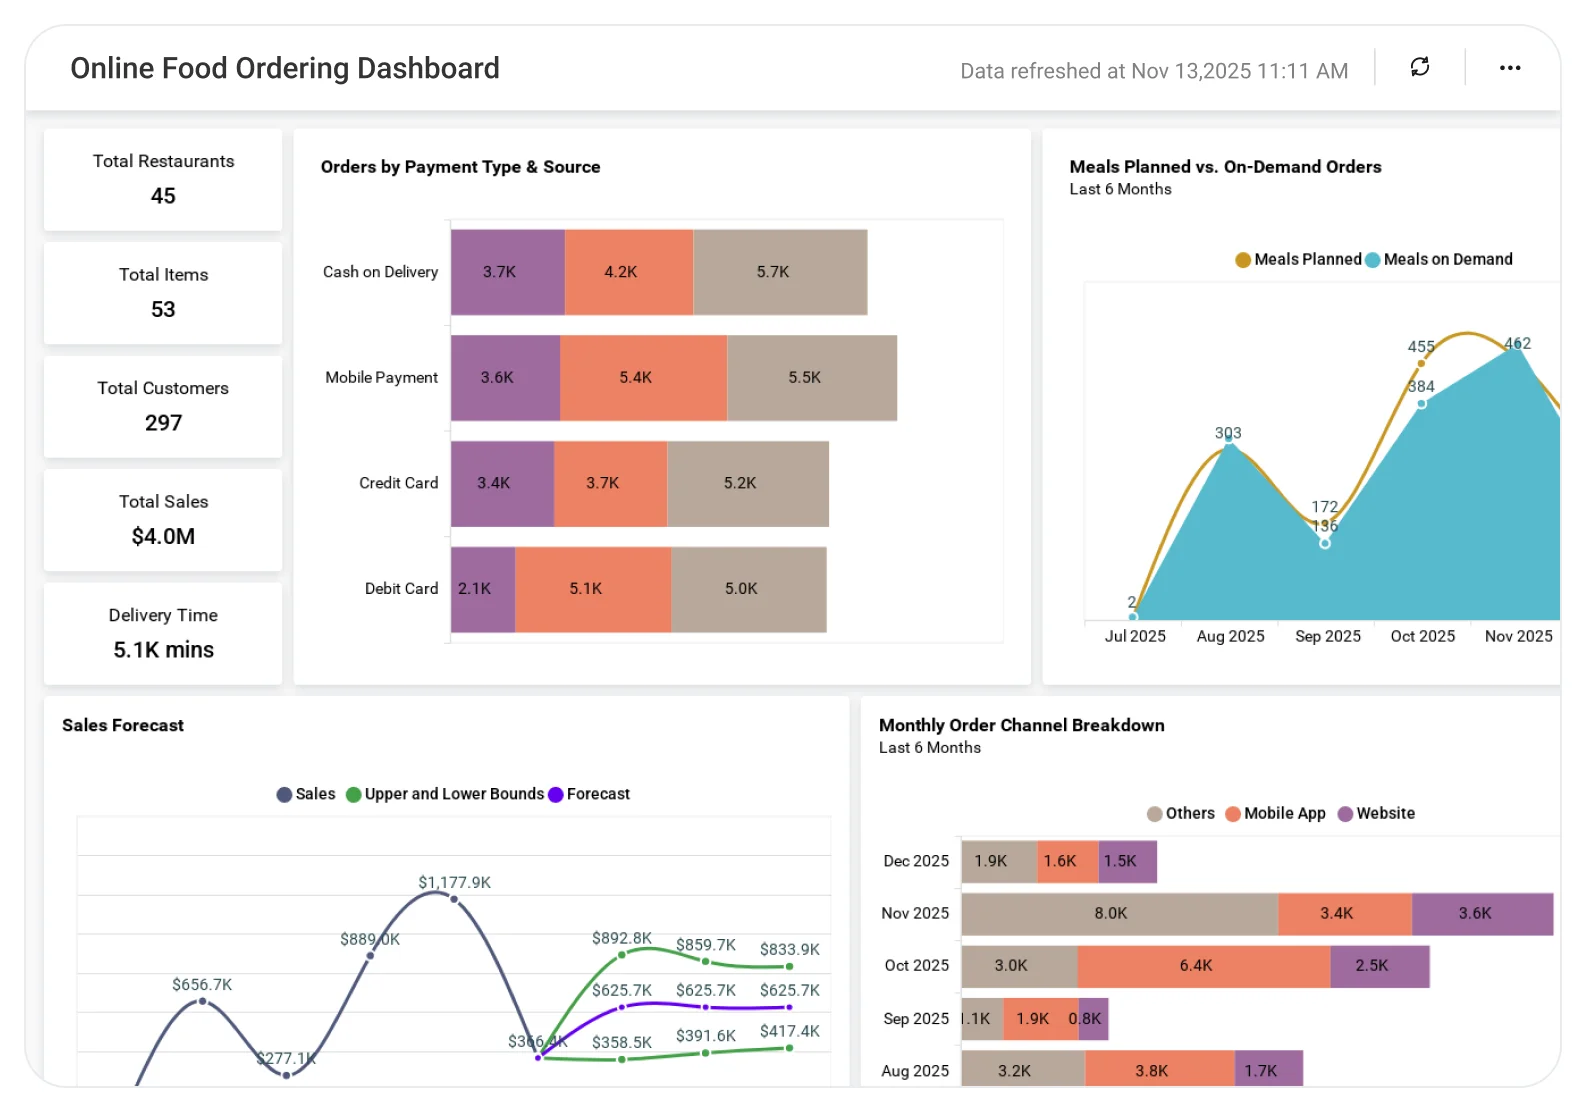
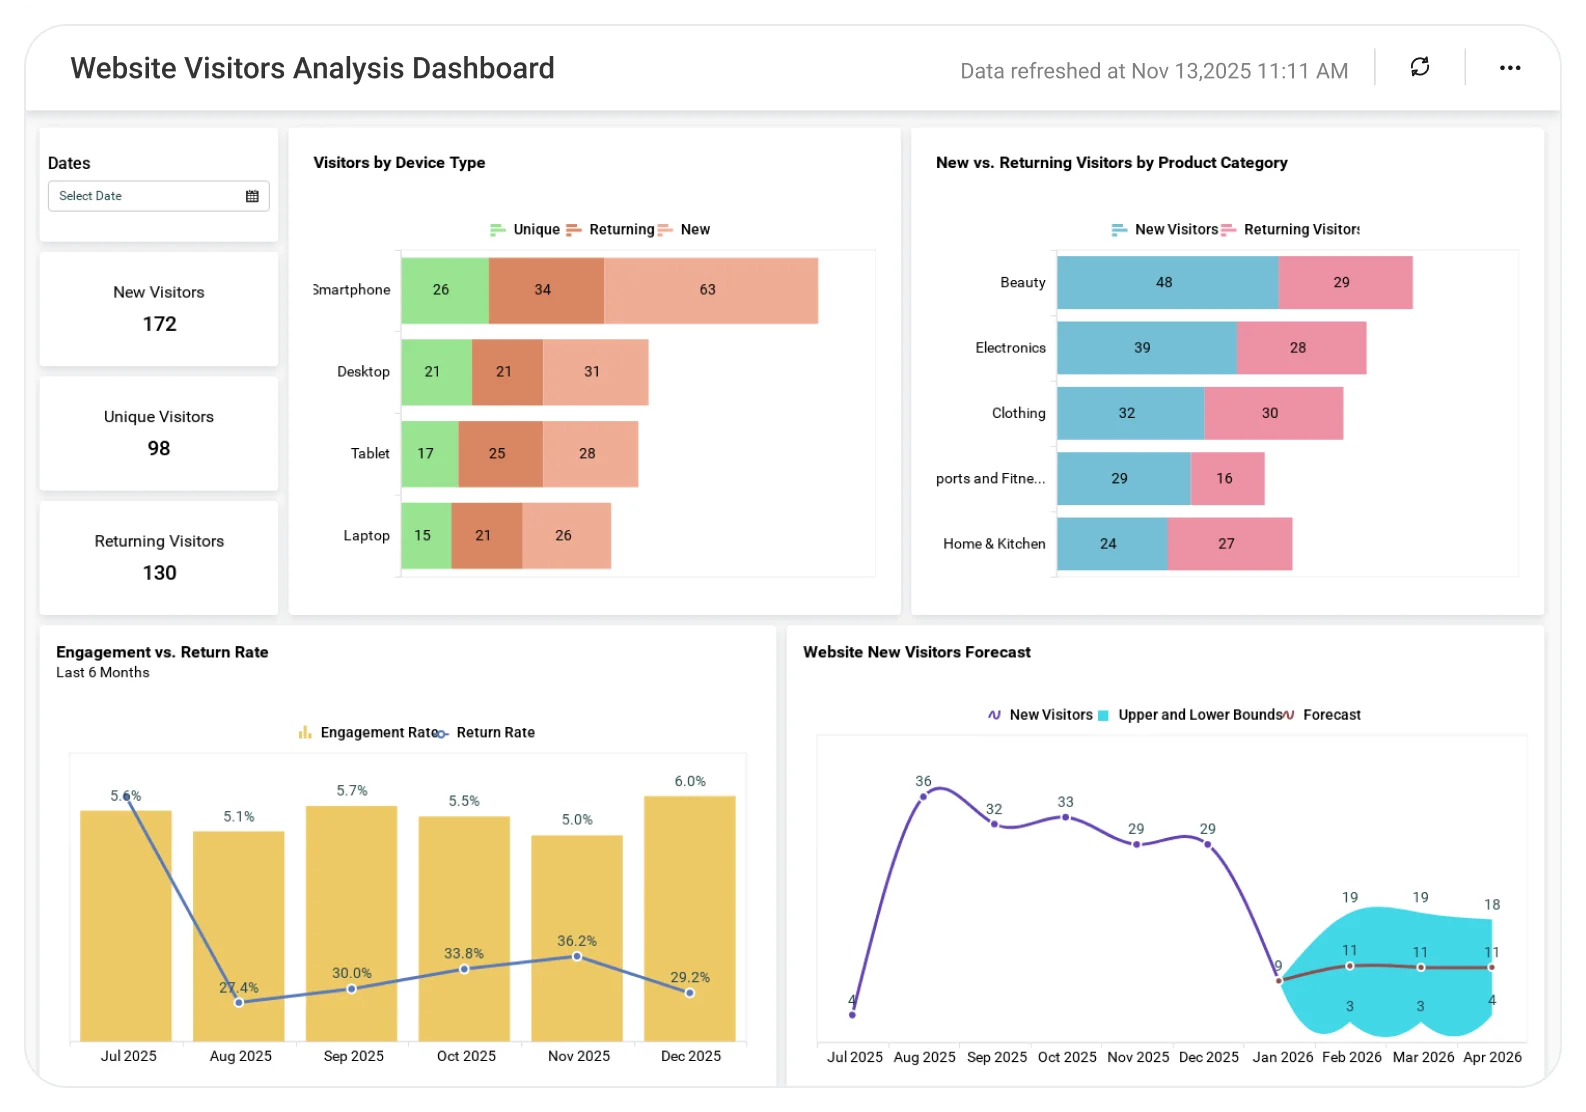
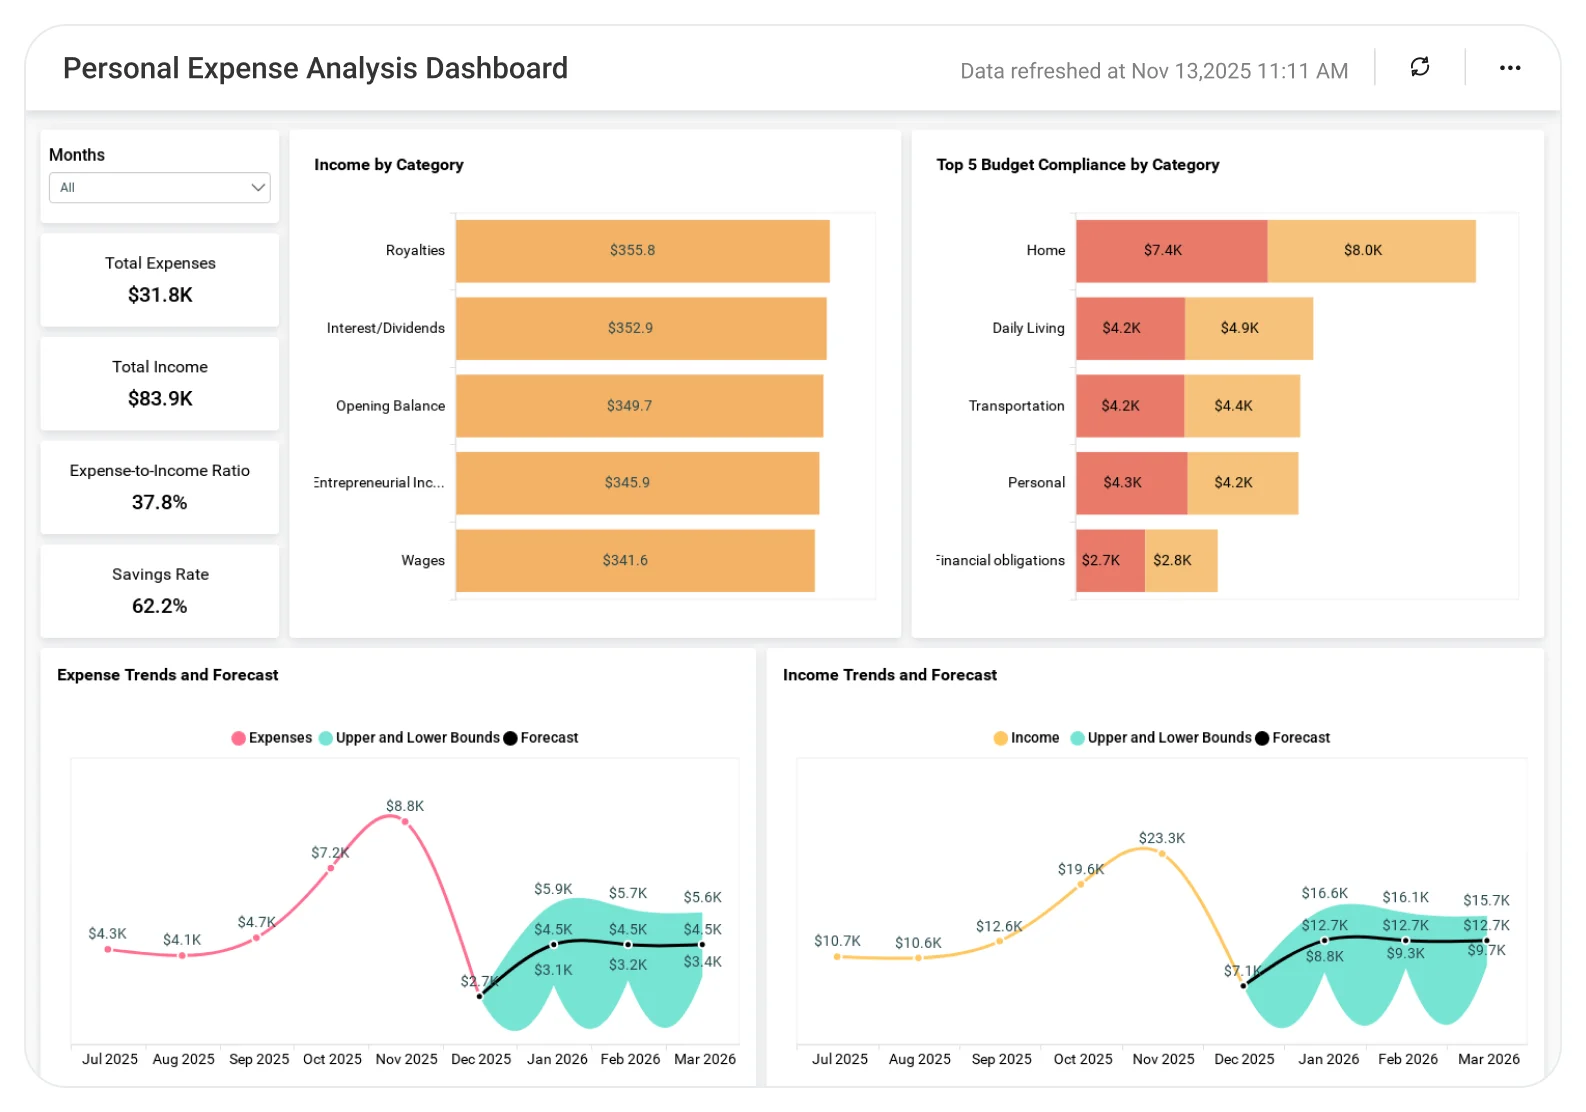
Why Teams Choose Bold BI for Predictive Analytics
- Forward-Looking Insights: Forecast trends, demand, and performance using historical and real-time data.
- Better Planning: Support budgeting, capacity planning, and resource allocation with predictive KPIs.
- Risk Reduction: Identify anomalies, potential downturns, and emerging risks early to minimize impact.
- Cross-Data Analysis: Combine operational, financial, customer, and market data in one unified view.
- Secure Analytics: Ensure data protection with role-based access, governance controls, and cloud or self-hosted deployment options.
What You’ll Track
Bold BI’s customizable dashboards put predictive KPIs at your fingertips, helping teams plan proactively and reduce risks.
- Trend Forecasting: Analyze historical data to project future performance, uncover seasonality, and visualize expected trends over time. This helps teams plan ahead instead of reacting late.
- Demand & Capacity Projections: Forecast sales volumes, workload, inventory needs, or staffing requirements to align resources with expected demand.
- Risk & Anomaly Indicators: Detect unusual patterns, potential performance drops, or outliers early before they turn into costly problems.
- Scenario & What-If Analysis: Compare multiple future scenarios by adjusting assumptions, inputs, or conditions to understand best- and worst-case outcomes.
All dashboards are fully customizable so teams can add or adjust KPIs based on business goals and industry needs.
Bold BI for Predictive Analytics – Common Metrics
With fully customizable dashboards, you can track predictive metrics that matter most to your business:
- Trend and time-series forecasts
- Demand and volume projections
- Growth and decline indicators
- Risk and anomaly detection metrics
- Actual vs forecast comparisons
- Scenario and what-if analysis outputs
- Seasonal and cyclical pattern indicators
Tailor predictive dashboards for sales, finance, operations, HR, or leadership teams in minutes.
How It Works
- Connect Data Sources: Integrate information from SQL databases, Excel files, ERPs, cloud apps, or Web APIs.
- Use Pre-Built or Custom Dashboards: Start with predictive analytics templates or design dashboards tailored to your needs.
- Apply Forecasting & Trend Analysis: Run predictive models directly within Bold BI visualizations to uncover future insights.
- Combine Historical, Real-Time & Forecasted Data: Answer key questions such as:
- What will performance look like next quarter?
- Are we heading toward a risk or an opportunity?
- How do forecasts compare to actual results?
- Collaborate Securely: Share dashboards with role-based access and set alerts when predictions deviate from expectations.
Trusted & recognized
Analytics that wins awards and users
Recognized by G2, TrustRadius, and Visual Studio Magazine for delivering standout performance and value.
I appreciate Bold BI for making it easier to provide reporting for our customers, allowing both our analysts and customers to easily build and publish reports. The ability to build dashboards and modify queries for specific outcomes is very user-friendly. I value the mobile readiness of the app and its integration capabilities with API structures. The addition of AI features is impressive. The economic pricing model and the effective partnership, which includes consistent and helpful support, make it an invaluable tool for our OEM model.
The support from Bold is unmatched. They do not charge extra for support and it is excellent anyway. All our tickets and questions are quickly answered with authoritative and precise guidance. This is important at the product is complex, powerful and mature. To get the most out of the tool, the level of support they provide is essential.
It was easy to implement data visualizations into our product. The standard widgets allowed us to build professional looking dashboards, and a robust API provided excellent control of the development and runtime process from within our application.



Recognition




Frequently Asked Questions
More Articles About Predictive Analytics Dashboard Examples
- Expand your Business with Predictive Analytics
A detailed blog explaining what predictive analytics is, why it’s essential, types of models, and how Bold BI supports predictive forecasting and business planning.
Ready to Get Started?
Start your 30-day free trial instantly
Easy integration, AI-Powered Dashboards and 24x5 real-time support.