Visualize Sales Metrics with a Zoho CRM Sales Dashboard

Zoho CRM is an online customer relationship management (CRM) system for managing your sales, marketing, and support in one platform. It helps you maximize your sales and increase your business growth. You can now integrate your Zoho CRM account with Bold BI® to gain a clear perspective on leads, contacts, deals, and much more.
In this blog post, we are going to explore key sales metrics in Zoho CRM and monitor them through a Zoho CRM sales dashboard created using Bold BI. Sales leads and executives can gain insights into managing the sales pipeline, identify potential leads, close more deals, and reach revenue targets.
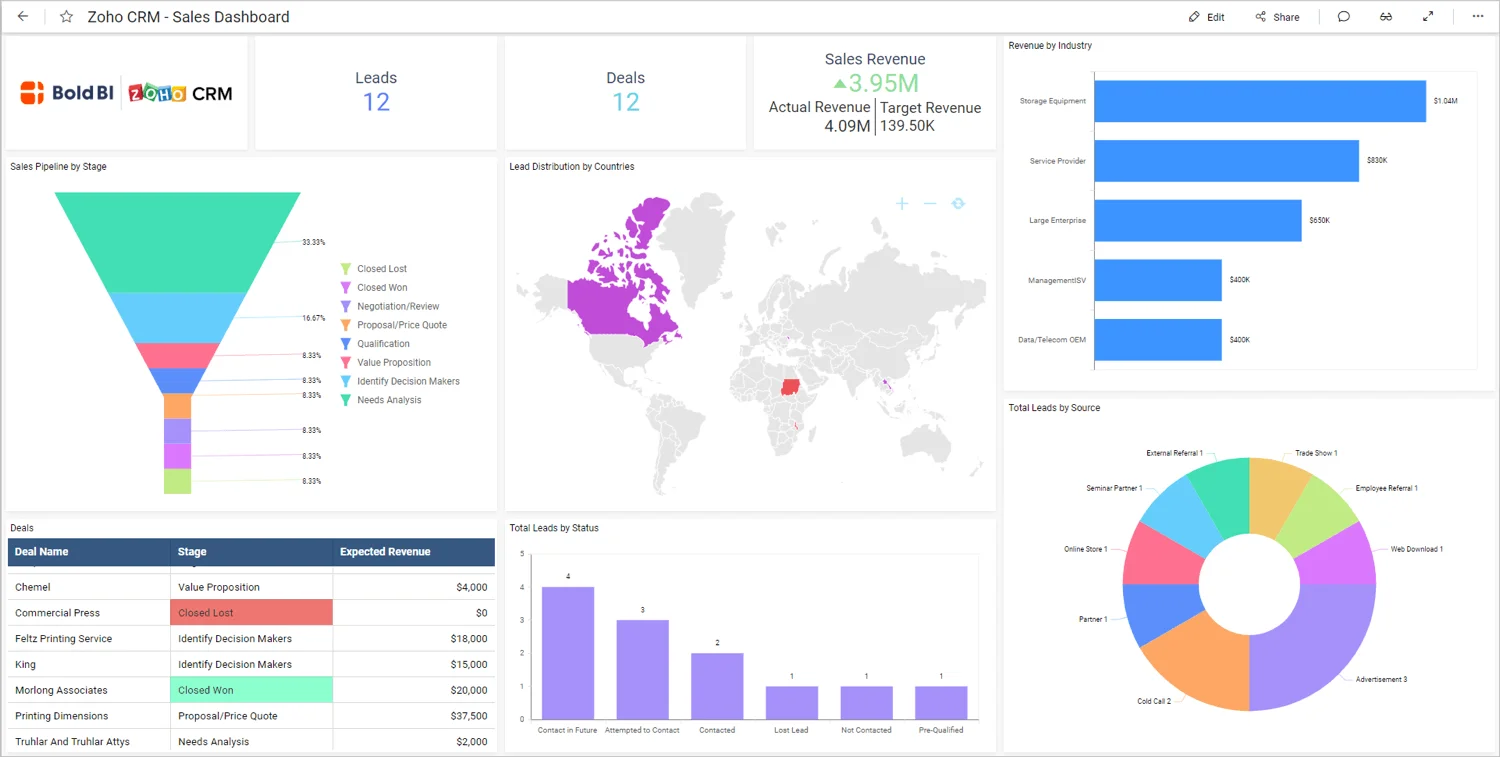
Defining sales metrics
The following are some sales metrics from Zoho CRM data that salespeople and managers can track to improve and ensure their teams’ performance:
- Total leads and deals
- Sales revenue
- Sales pipeline by stage
- Lead distribution by country
- Revenue by industry
- Deals overview
- Total leads by status and source
Let’s see how each of these KPIs can be plotted using Bold BI dashboard widgets.
Total leads and deals
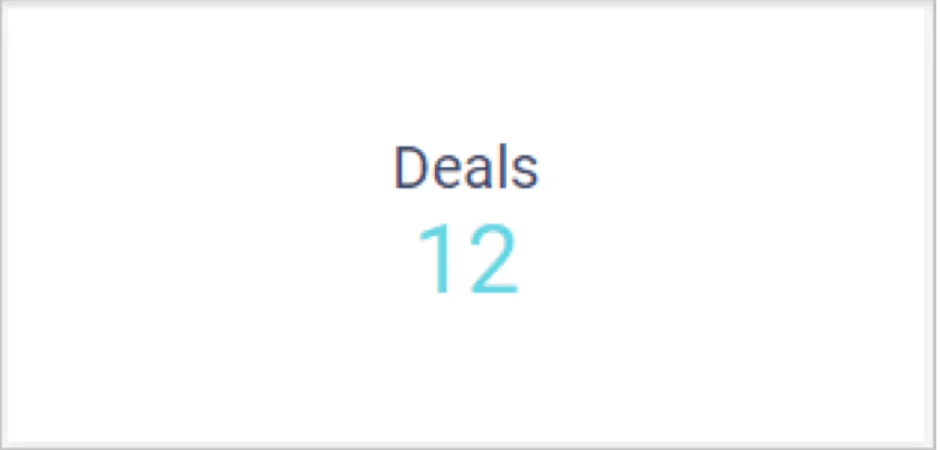
The Number Card widgets showcase information about total leads and deals. For the sales team, this KPI is useful for knowing how many people or organizations are interested in a product and how many leads are willing to buy the product. Also, the sales executives can take necessary action to improve leads-to-deals conversion.

Sales revenue
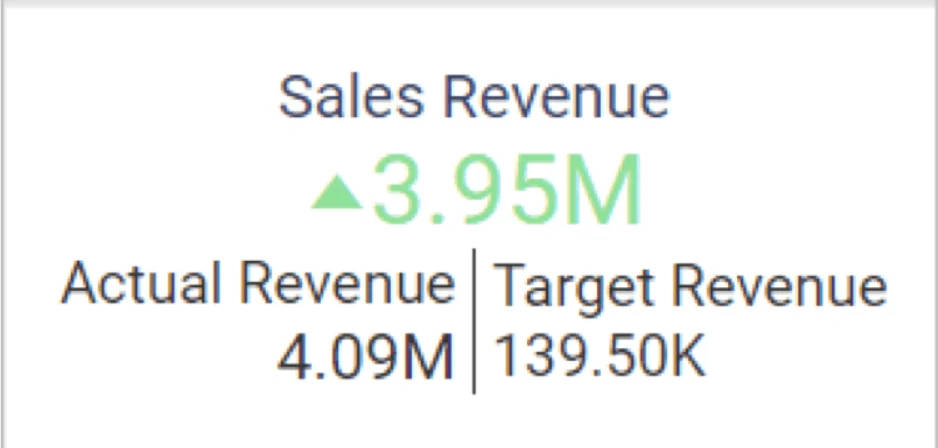
The KPI Card widget is best suited for visualizing sales revenue and performance compared with actual and target revenue. With this KPI, the sales team can see whether they reached their target and what they have achieved.
Pipeline by stage
Sales leads and executives need this KPI to track the total deals at every stage of the sales pipeline, such as closed lost or won, negotiation, qualification, and needs analysis. The funnel chart is best to showcase a sales pipeline in different stages in a decreasing manner. This KPI will be useful to identify the possibility of winning a deal.
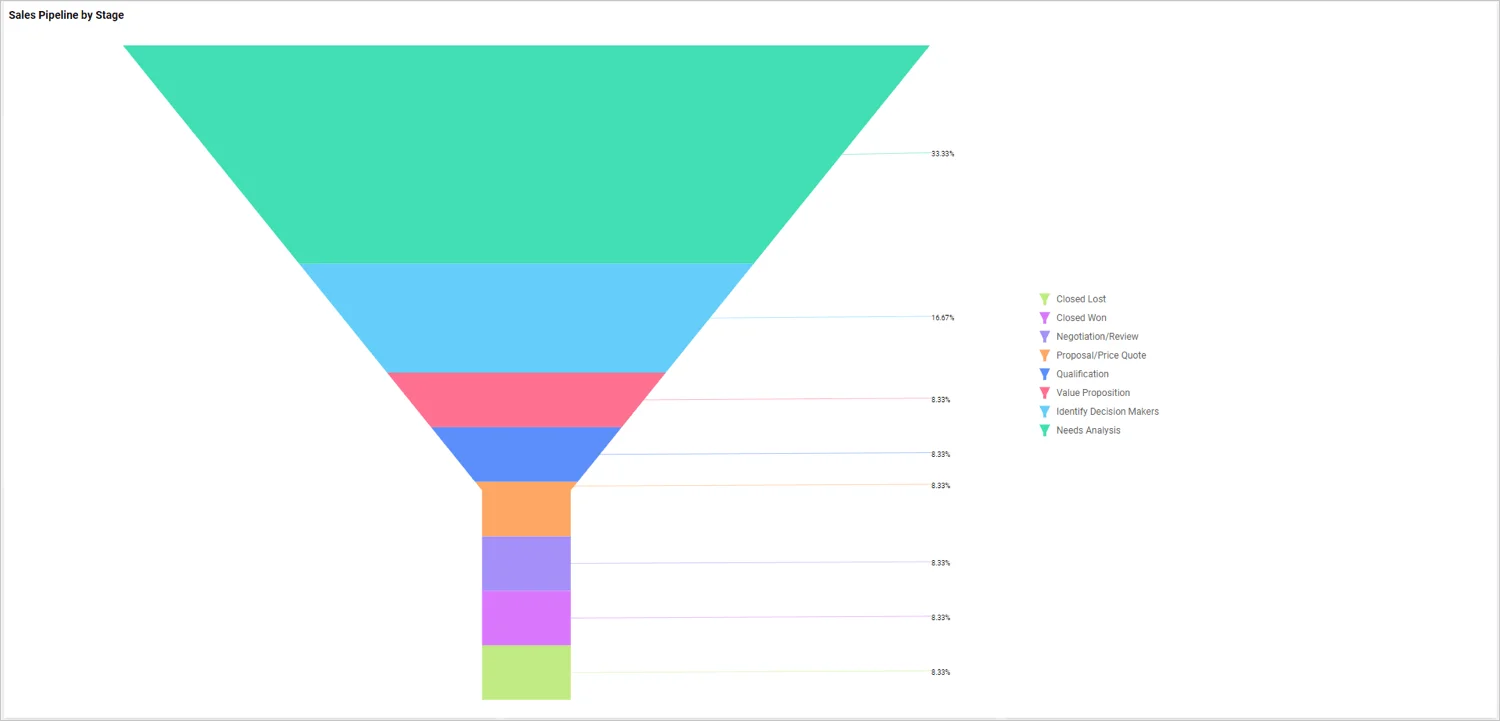
This funnel widget shows values across different stages with different colors. So, you can easily identify bottlenecks of data.
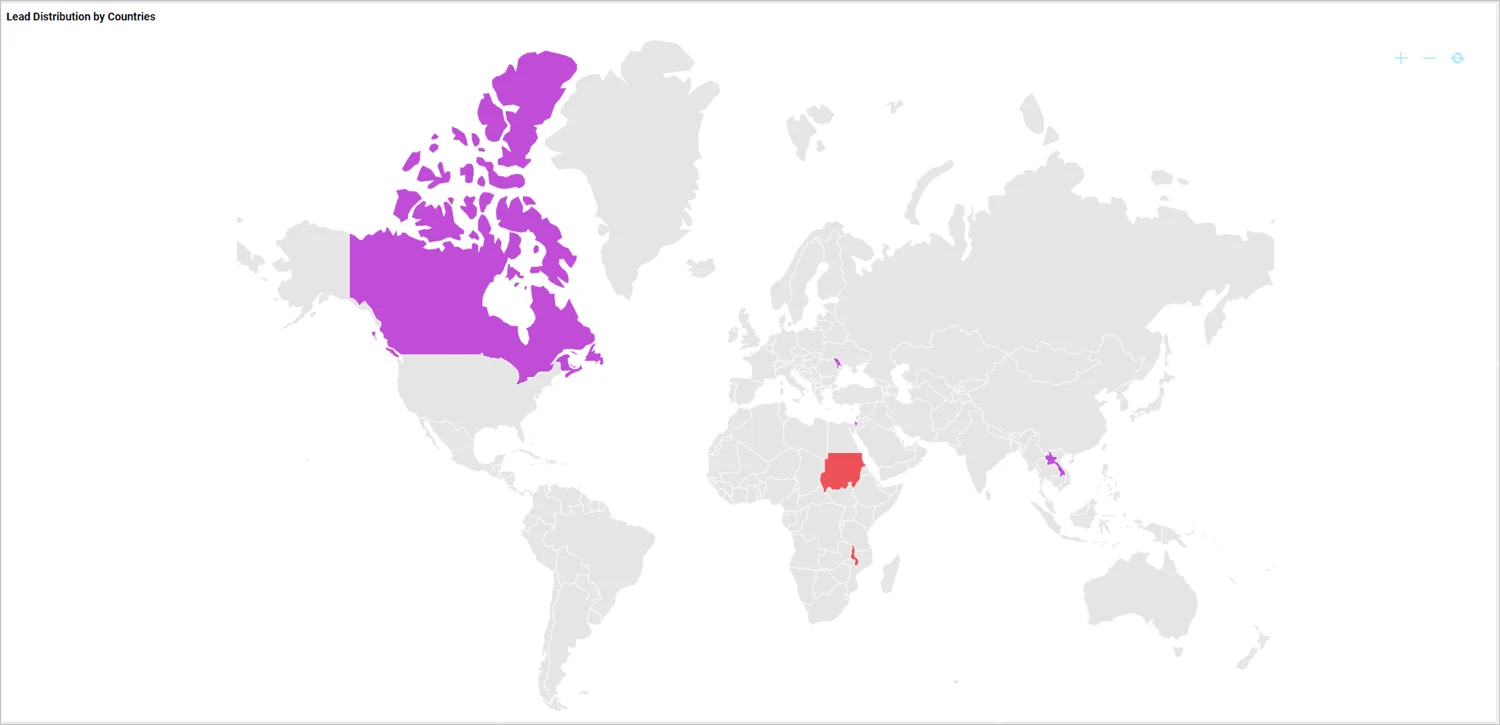
Lead distribution by country
The total count of leads by country is showcased in a map. This KPI will provide information about which countries generate the greatest number of leads.
Knowing this information, sales leads and executives can decide where to increase promotional offers and ads in order to increase leads from target countries, leading to increases in sales revenue.
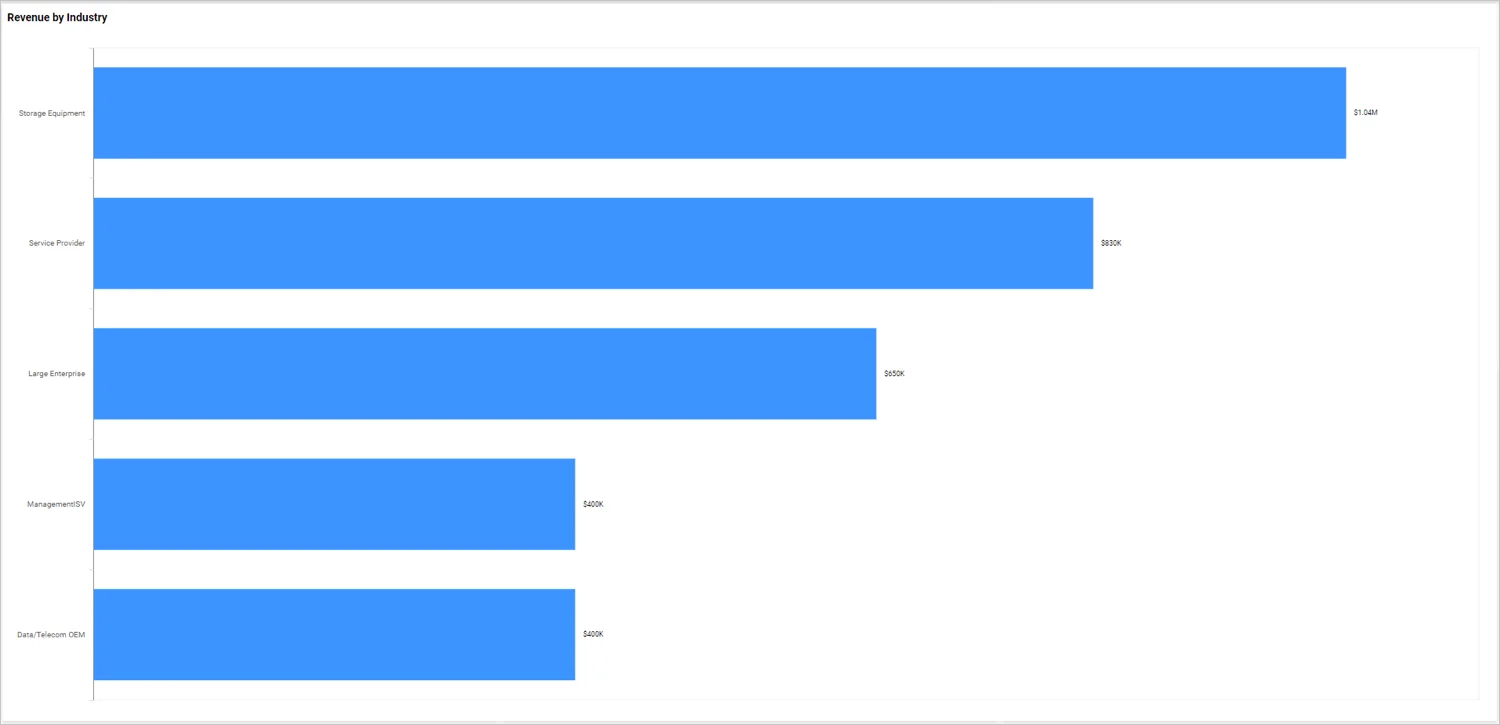
Revenue by industry
The bar chart can be used to showcase revenue by industry. With this KPI, you can identify the industries bringing in more revenue, decide where to improve targeting for more revenue, and apply successful patterns from the high-revenue industries.
Deals overview
The grid widget is good for visualizing a deal’s details, such as the deal name, its stage in the sales process, and expected revenue. This KPI lets you identify possible revenue and helps you make decisions that lead to more successfully closed deals.

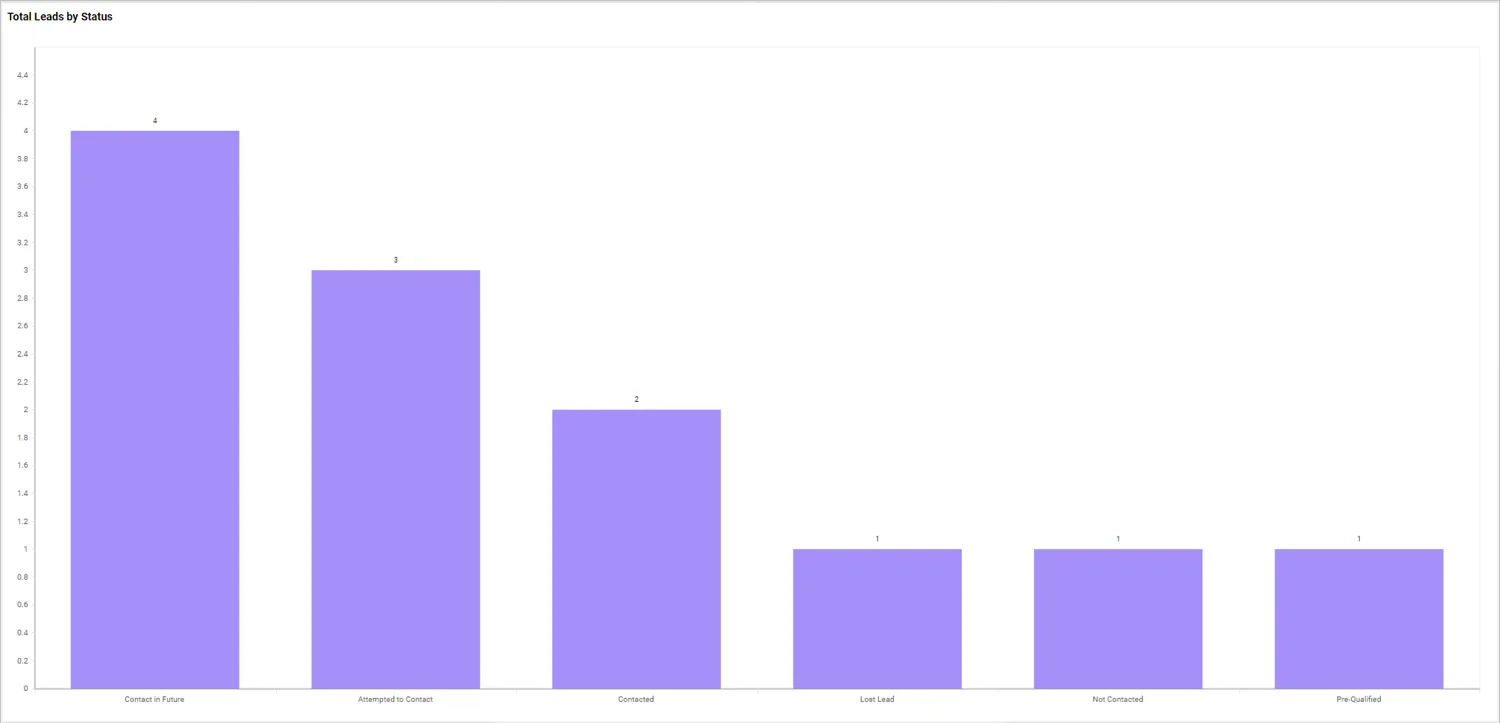
Total leads by status and source
The column chart visualizes the leads count by status. With this KPI, sales leads and executives can make decisions on how to deal with those leads and improve their revenue performance.
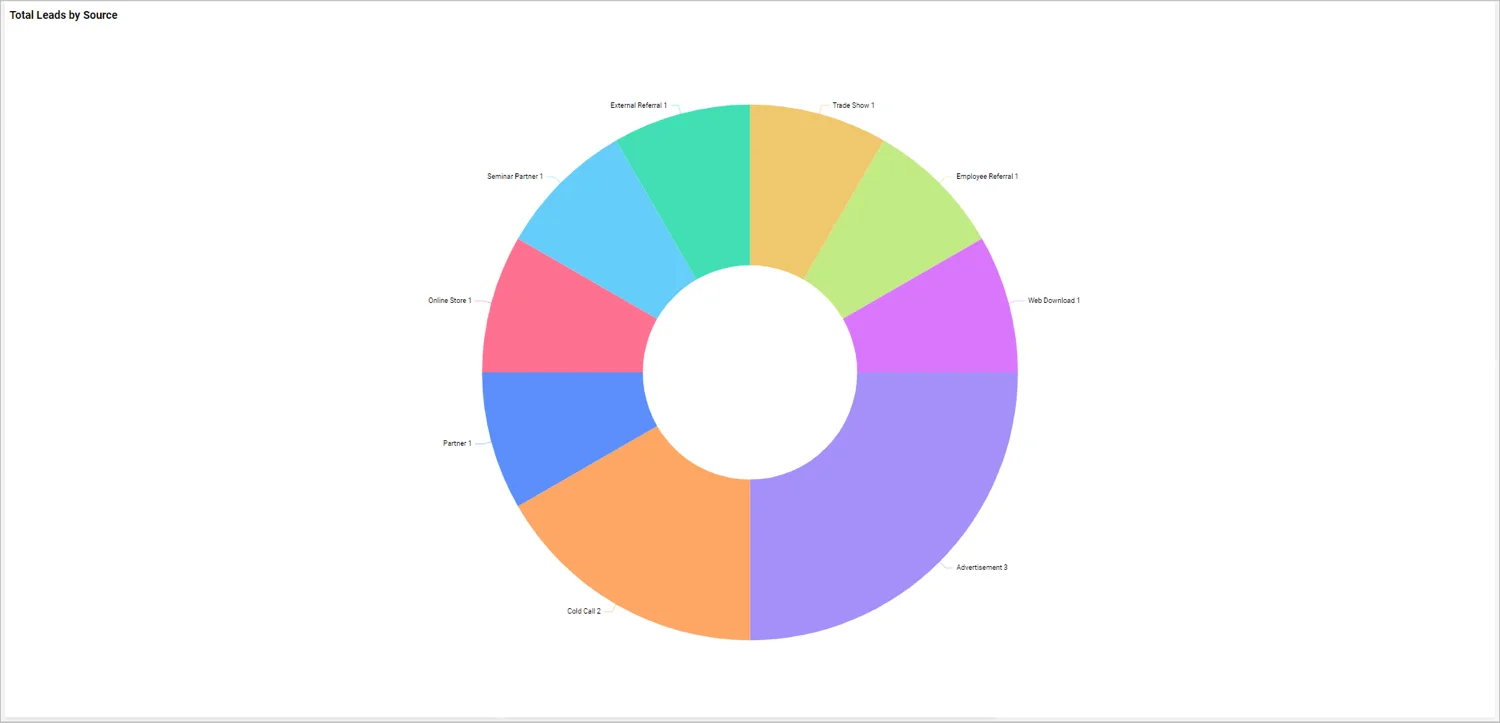
The total number of leads by source is visualized in a pie chart. This KPI will let you know where your leads are coming from. It helps the sales team improve campaign targeting to get more leads and convert them into deals.
Fetching Zoho CRM data
Zoho CRM provides REST APIs to fetch data from a Zoho CRM account. Connect to Zoho CRM and create a data source with appropriate APIs like in the following table.
| Accounts | https://www.zohoapis.com/crm/v2/settings/modules/ Accounts |
| Leads | https://www.zohoapis.com/crm/v2/settings/modules/ Leads |
| Deals | https://www.zohoapis.com/crm/v2/settings/modules/ Deals |
| Contacts | https://www.zohoapis.com/crm/v2/settings/modules/ Contacts |
Let’s see how to create a dashboard to visualize the discussed KPIs using Bold BI.
Creating Zoho CRM sales dashboard
Let’s start creating a Zoho CRM sales dashboard with Zoho CRM data. Check out our tutorial video to learn how to create a dashboard from scratch.
Creating Zoho CRM data source
To a create Zoho CRM sales data source from the dashboard designer, follow the steps described in “Choose Zoho CRM data source” from Bold BI’s documentation. Then, use the steps in “Authentication with Zoho CRM” to authenticate with Zoho CRM.
After successful authentication, the NEW DATA SOURCE configuration panel opens. Specify a unique name for the Zoho CRM data source. Choose one of the REST API endpoints from the drop-down list. The corresponding URL will be displayed in the URL text box. If you want to connect with other endpoints, you can enable the Custom URL check box and provide the URL in the text box manually.
Leave the default value GET for the REST API under the Method section. Set the time interval for Refresh Settings so that the dashboard can refresh itself with the latest data updates.
Let the data format be JSON since the all REST API endpoints return results in JSON format. Zoho CRM will be set automatically in the Authentication Type section, since OAuth is used for authenticating with the Zoho CRM account.
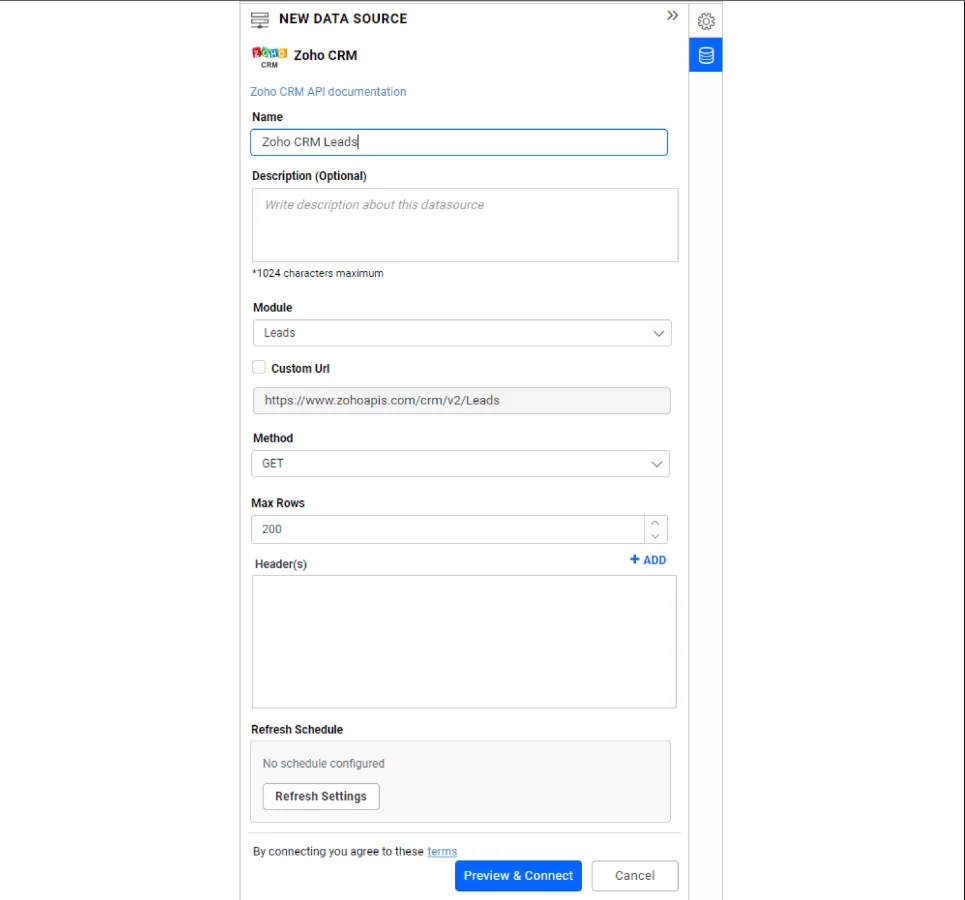
Click Preview & Connect. As a result, a window opens listing the data results as seen in the following image.
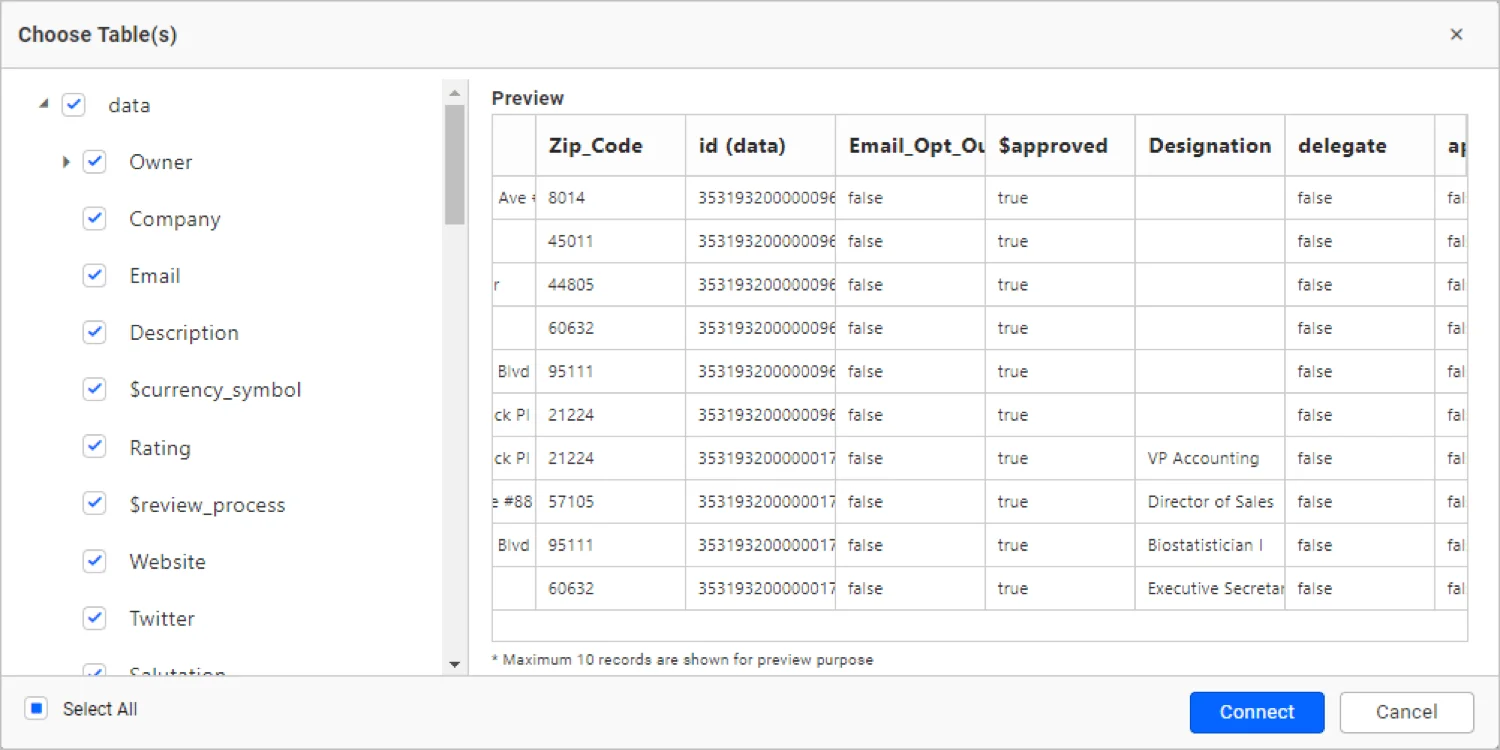
Choose the desired columns and click Connect. Drag and drop the table and save the data source. Finally, the created data sources will be added in the DATA SOURCES panel.
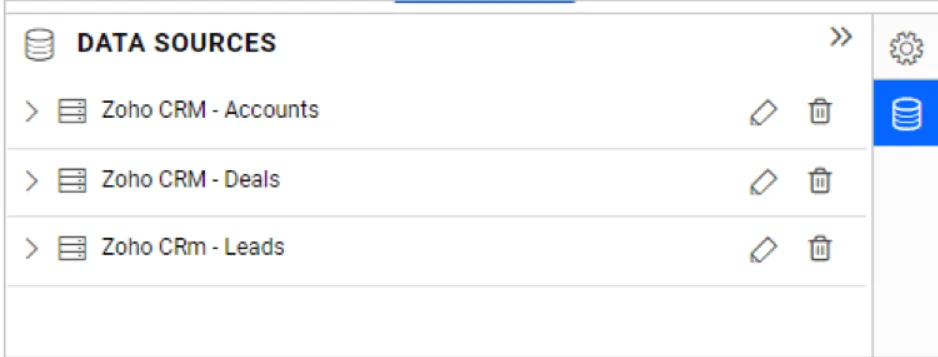
Once the data source is created, add the required widgets to your dashboard and connect data to them to visualize the metrics.
Conclusion
We hope this article guides you in connecting Zoho CRM data and visualizing important metrics from your sales pipeline with Zoho CRM using a Bold BI® dashboard. If you have any questions on this blog, please feel free to post them in the following comment section. Get started with Bold BI by signing up for a free trial and create more interactive business intelligence dashboards. You can also contact us by submitting your questions through the Bold BI website or, if you already have an account, you can log in to submit your support question.


