

Bold BI Enterprise and Embedded – April 2020 Release

Today we released Bold BI® Enterprise and Embedded v3.2. It’s a huge release since it delivers many much-awaited features, enhancements, and improvements. We’ll look at each of them in this post.
You can download the latest version of Bold BI from your account page. If you are new to Bold BI Enterprise, sign up for a free trial on our website. New users to Bold BI may download one from this page.
New dashboard widgets
In a text widget, you can replace the existing label widget with rich text editing functionalities such as font, paragraph, links, tables, and embedded code.
The spline area chart widget comes as an alternative for the area chart widget. It has smooth curves connecting data points instead of straight lines.
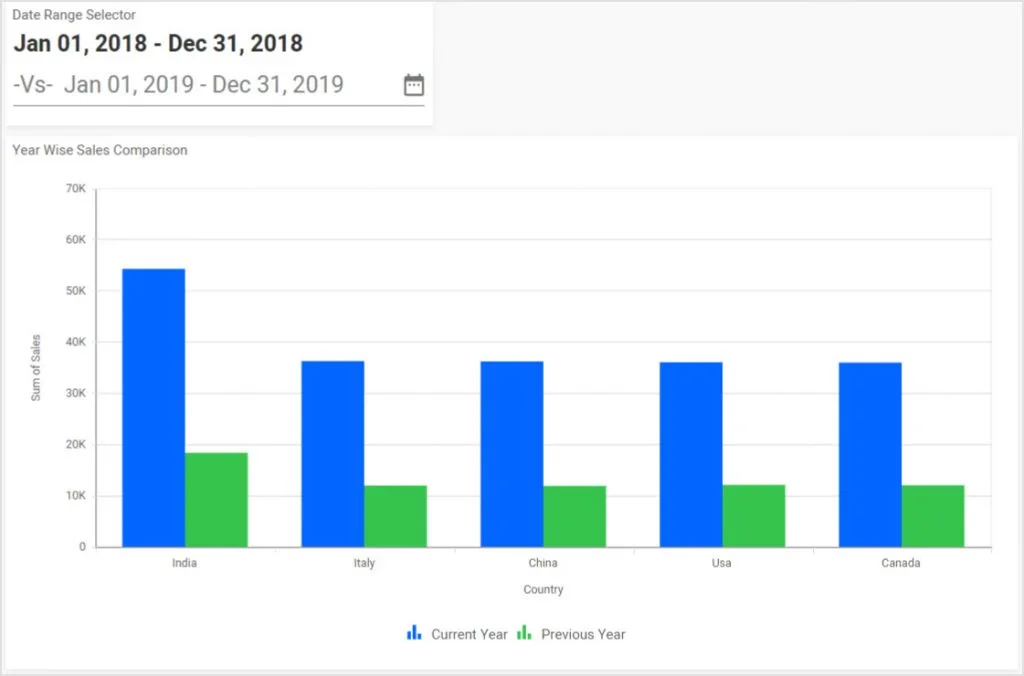
A period-over-period widget lets you compare two different date ranges and show the comparative data in charts.
New data connectors
The Amazon Relational Database Service (Amazon RDS), with any of its database engines (Amazon Aurora (MySQL, PostgreSQL), PostgreSQL, MySQL, MariaDB, Oracle Database, and SQL Server), can be connected using Bold BI.
Also, Google Ads, ProofHub, Gmail, and RavenDB can now be connected.

Pinboards
Pin visualization widgets from any of your dashboards into a pinboard comprising one-column, two-column, and three-column layouts.
Open query mode for stored procedures
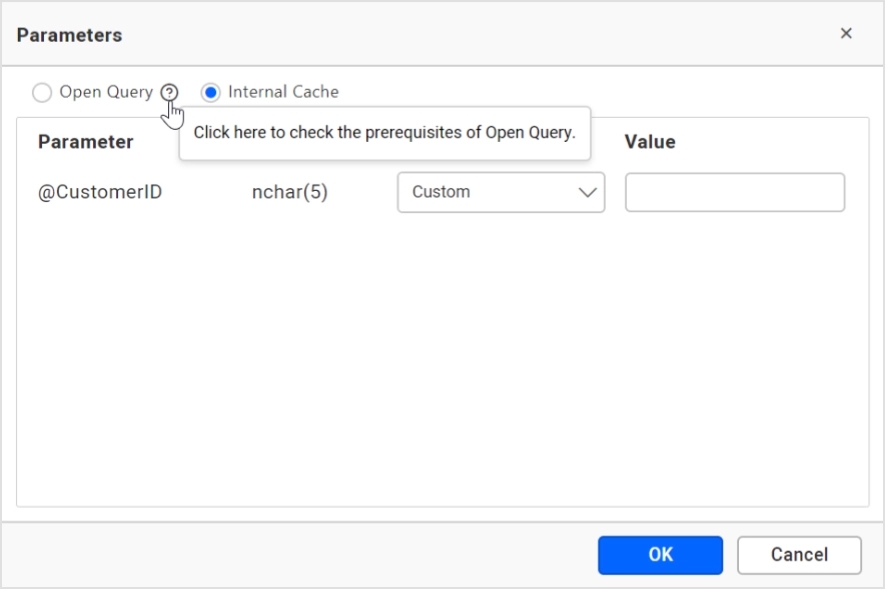
SQL Server Stored Procedures’ query execution can be improved now by enabling open query mode. This mode is not applicable for Azure SQL Database (other than managed instances) or Azure Synapse Analytics (SQL DW).
Live mode for Web API data connector
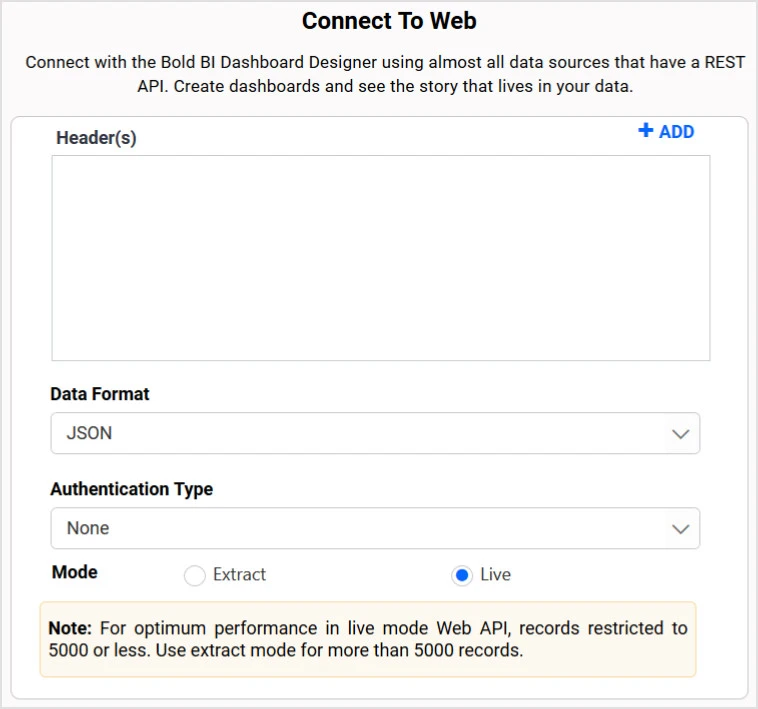
The Web API data connector now supports live mode. So, it is not mandatory to configure an intermediate data store for data processing that takes place in cached mode.
Custom widget
A custom widget can be configured in Bold BI. It can be any user-defined JavaScript component, Syncfusion Essential JS 2 component, or D3 component.

Dashboard parameters
Define parameters based on a literal, a list, or a data source and use them for dynamic querying of REST API endpoints in a web data source, SQL-type databases in code view, and calculated field expressions.
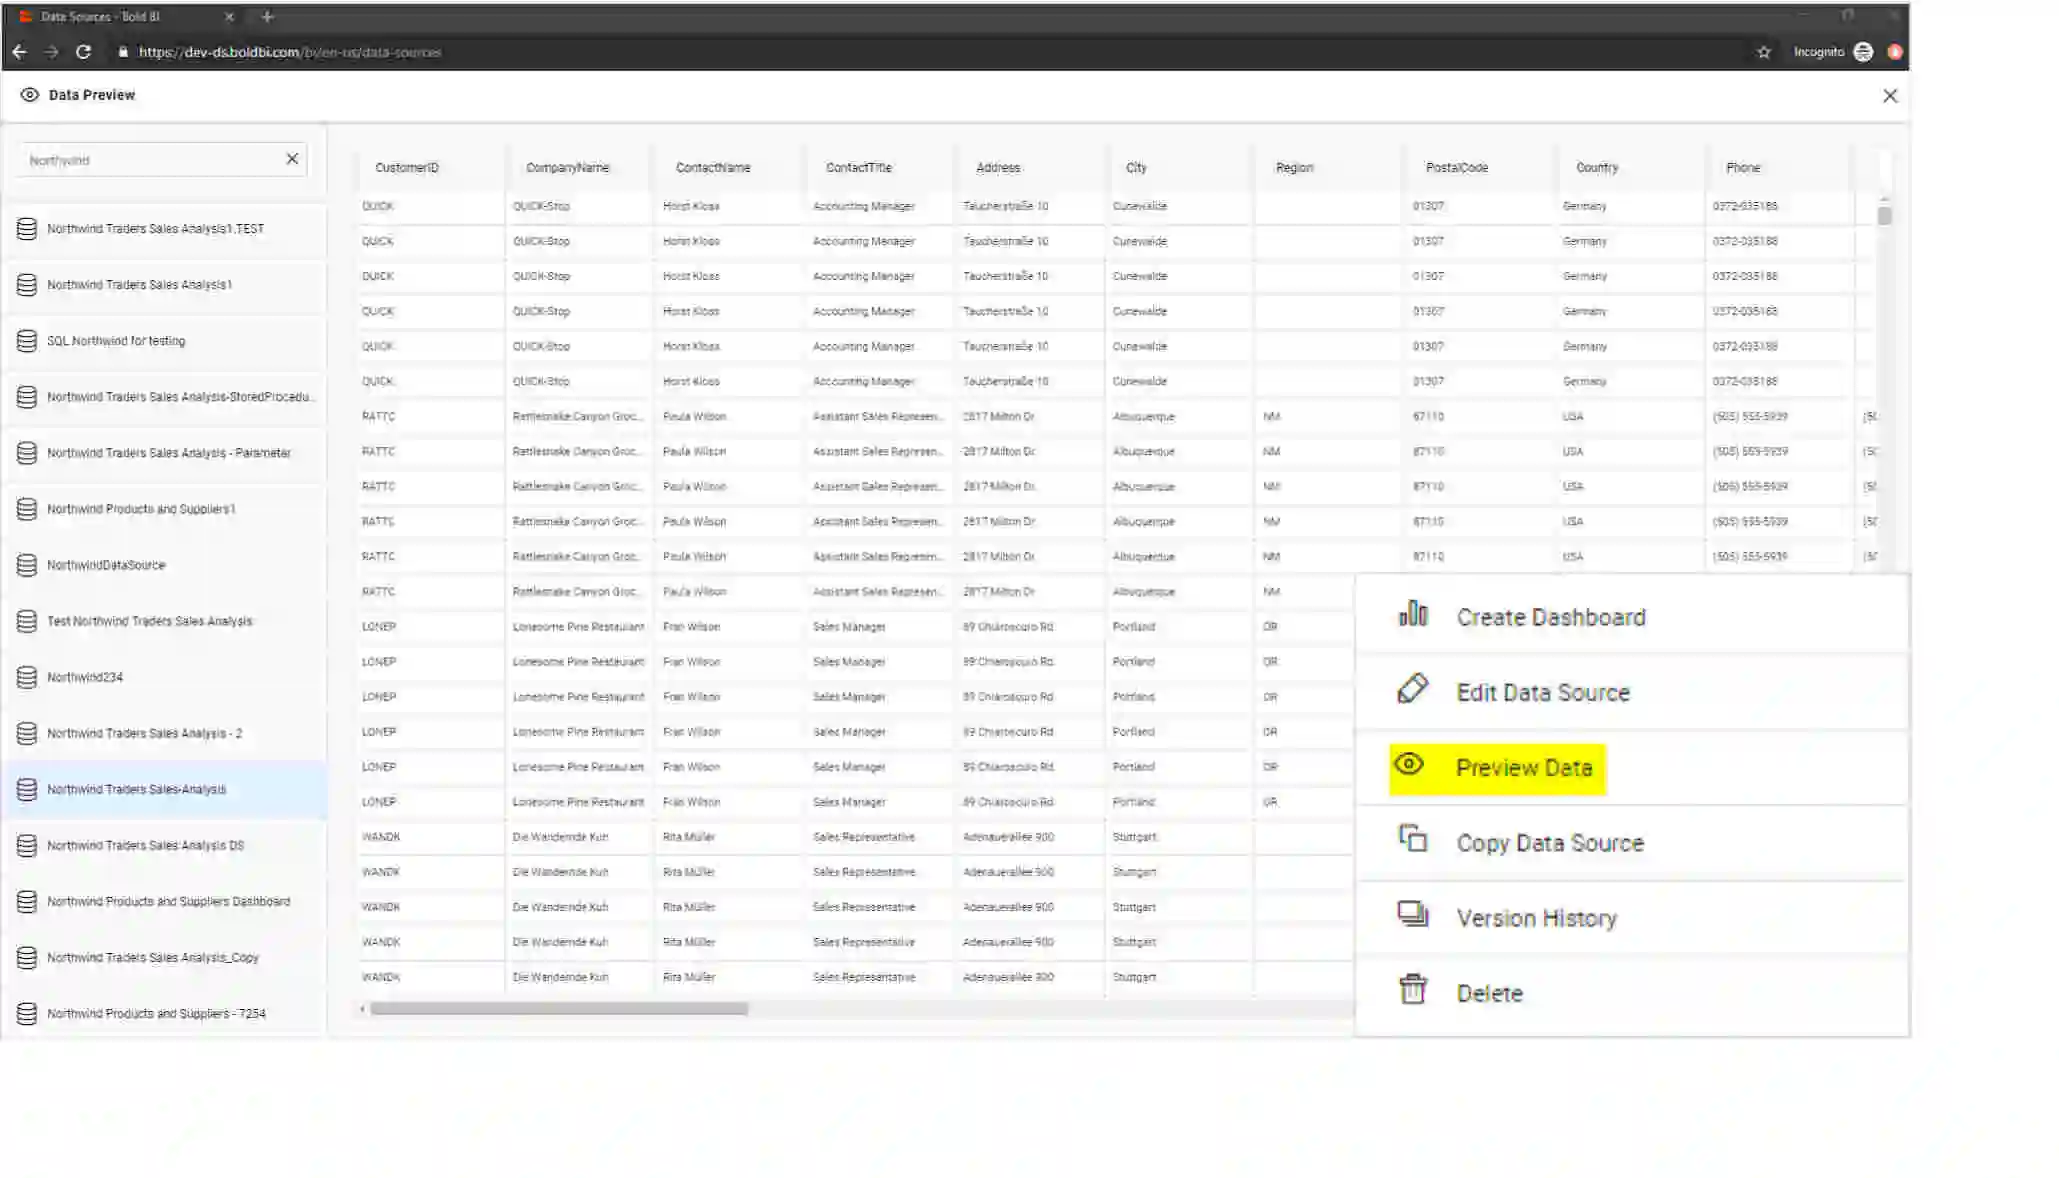
Data source preview
Preview the data directly from the data sources’ listing view in the Bold BI server.
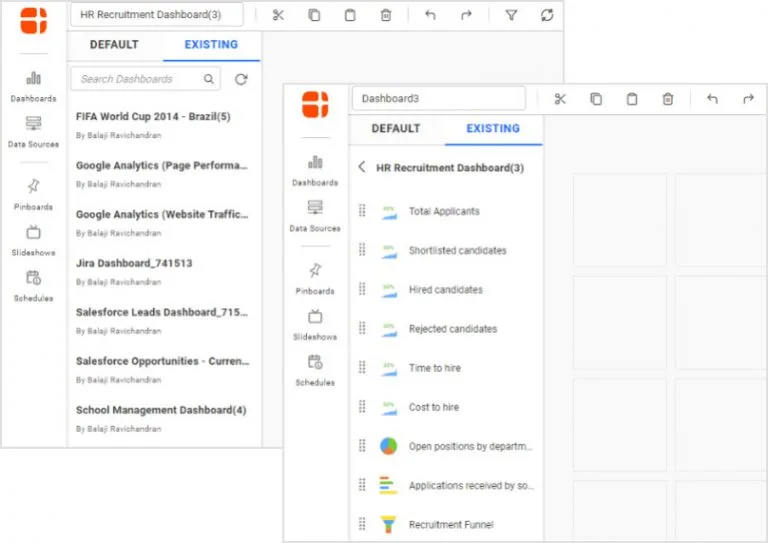
Reusing dashboard widgets
Reuse widgets from your other dashboards. Instead of creating them from scratch, you can import an already created widget along with its bounded data connection from another dashboard into your current dashboard. Doing so will create a new copy in the current dashboard.
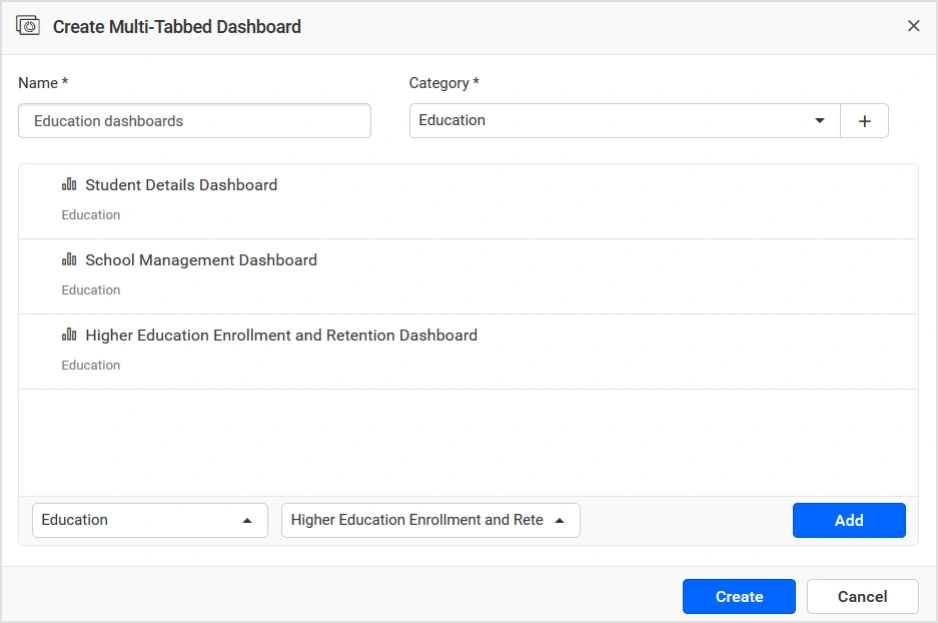
Tabbed dashboard
Create a story linking related Bold BI dashboards organized as separate tabs and share them with your team.
JS component for embedding
This release offers a new JavaScript SDK a native, client-side component for embedding dashboards in your website or web application. The SDK also includes embedded APIs for passing filters as parameters to the dashboard URL, theming, and more.
Row-level security
Enable row-level security based on login emails and full names to restrict data access at the data source modeling level.
Setting filtered view as default
A dashboard setting has been added to define a filtered view as the default view. So, opening that dashboard anytime will render the set default view.
Autosaving view
An automatic save option has been added to enable you to save any changes in a dashboard that occur with dynamic user interactions automatically.
Other usability improvements
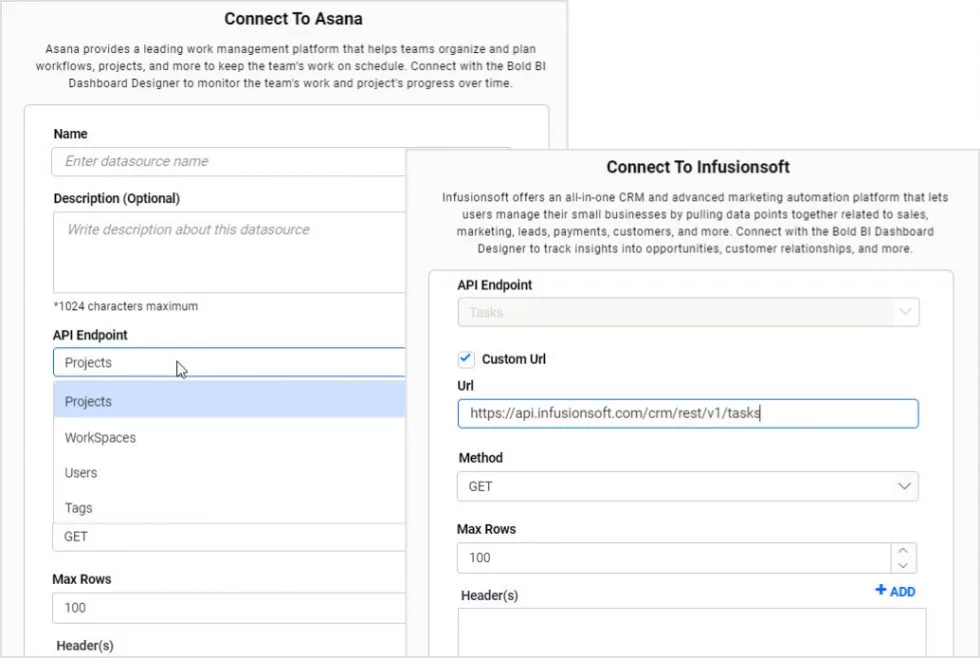
Asana and Infusionsoft data connectors were improved to generate URLs based on the endpoint chosen.
We hope this post is helpful to you in learning about the new features and improvements in Bold BI® Enterprise and Embedded v3.2. If you have any questions, please use the comments section available below. You can also contact us by submitting your questions on the Bold BI contact page or, if you already have an account, you can log in to submit your support question.





