


SurveyMonkey Survey Overview Dashboard
Effortlessly monitor important survey insights, such as response rates, number of surveys, and completion rates.
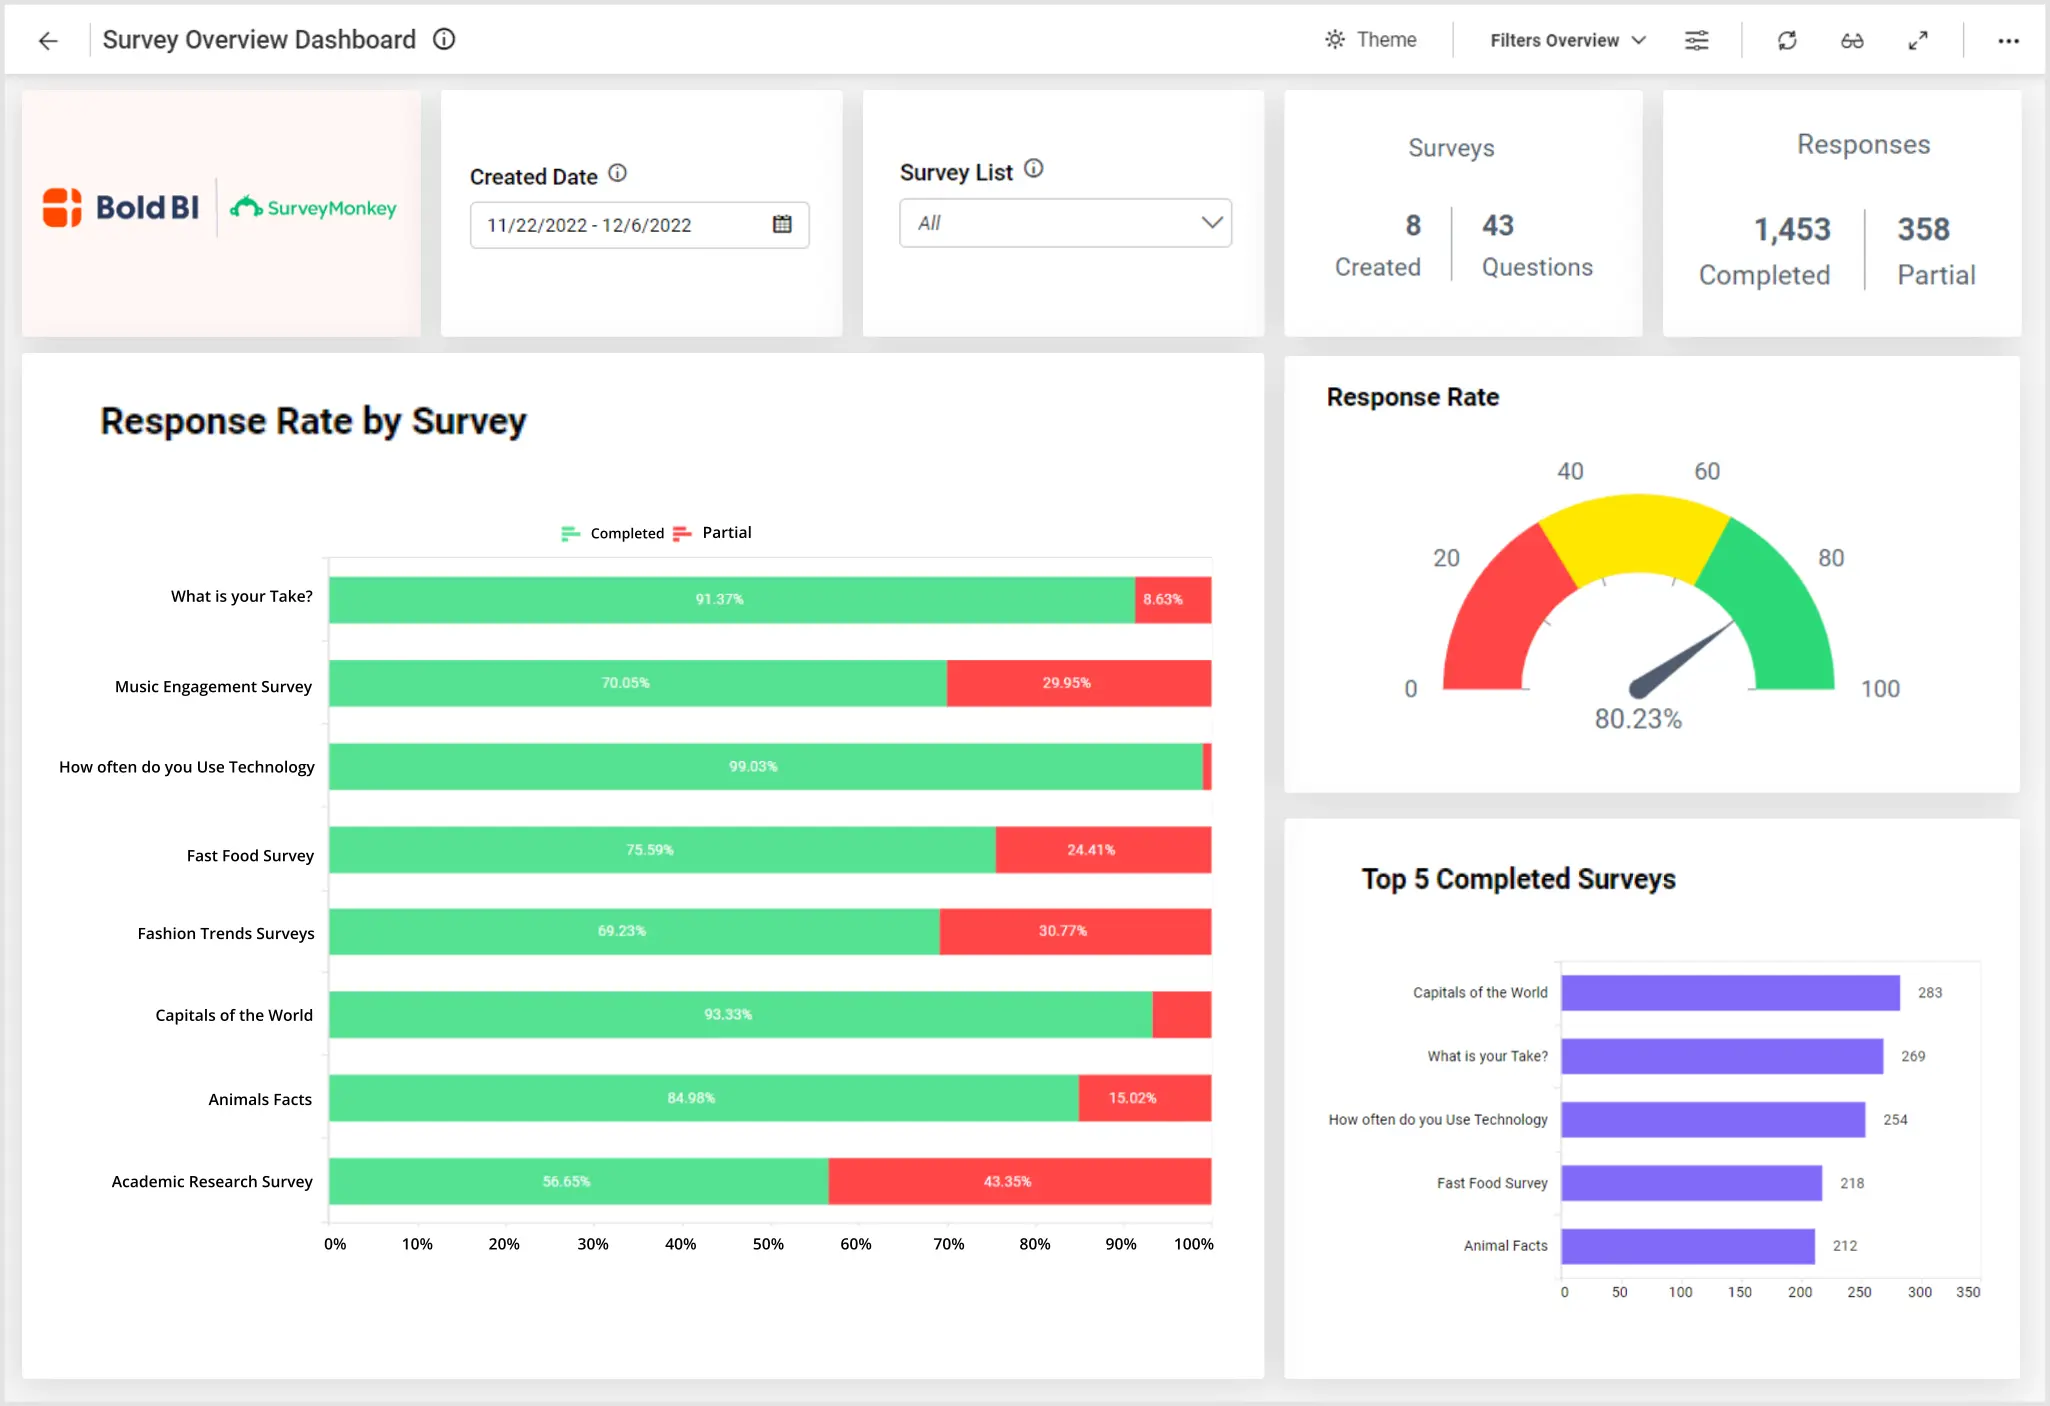
Bold BI’s survey overview dashboard displays metrics monitor to surveys by category, survey responses and metrics related to survey responses. For example, with this dashboard, we can answer the following questions:
-
Firstly, how many surveys are completed versus partially completed?
-
Secondly, which surveys had the highest response rates?
-
Thirdly, what categories of surveys received the greatest draw?
-
Finally, how long does it take for our respondents to complete our surveys?
Track Key SurveyMonkey Metrics
This dashboard gives a wide range of eye-catching graphics to best display SurveyMonkey data. From number cards to doughnut charts, business professionals can track total surveys, total questions asked, and surveys by categories. In addition, the bar charts clearly show the number of respondents and the top five completed surveys by responses. Also, the line charts communicate the number of surveys by week and respondents and status by month.
Next, leaders can track trends as a means of future growth and improvement. Our embedded dashboard offers two trend charts. For example, professionals can see the number of completed responses and the number of respondents over the past fifteen days. In summary, these trend graphics help with future survey processing and systems.
Finally, the summary grid, located at the bottom of the dashboard, provides a wealth of insights relative to a specific survey. Leaders can access the title of a survey, total questions asked with each survey, and total responses. In addition, tracking response status and completion rates can be easily seen on the summary grid. In conclusion, this robust embedded dashboard offers a great deal of graphs and charts to track survey data.
Filter Your Data
Tracking specific data relative to one survey is made simple in our SurveyMonkey embedded dashboard. With our easy to access filter options, business professionals can track their data to a specific survey and date range . As a result, leaders, like yourself, can simplify how you view your data. Check out this embedded dashboard example for employee details to learn how Bold BI’s solutions can help your team.ssasked

