Solutions for Social Media
See what content really drives engagement In Real Time.
Building a strong online presence is about more than increasing follower counts. Social media teams need clear, reliable data to understand what content resonates, how audiences engage, and which strategies drive real results.
Social Media
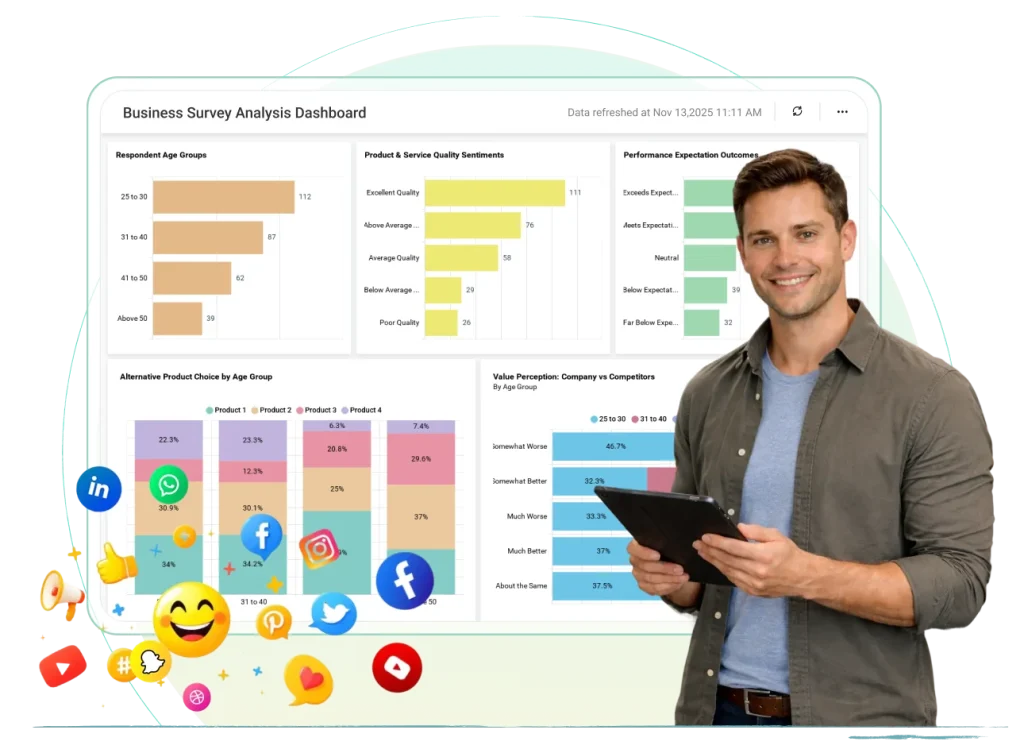
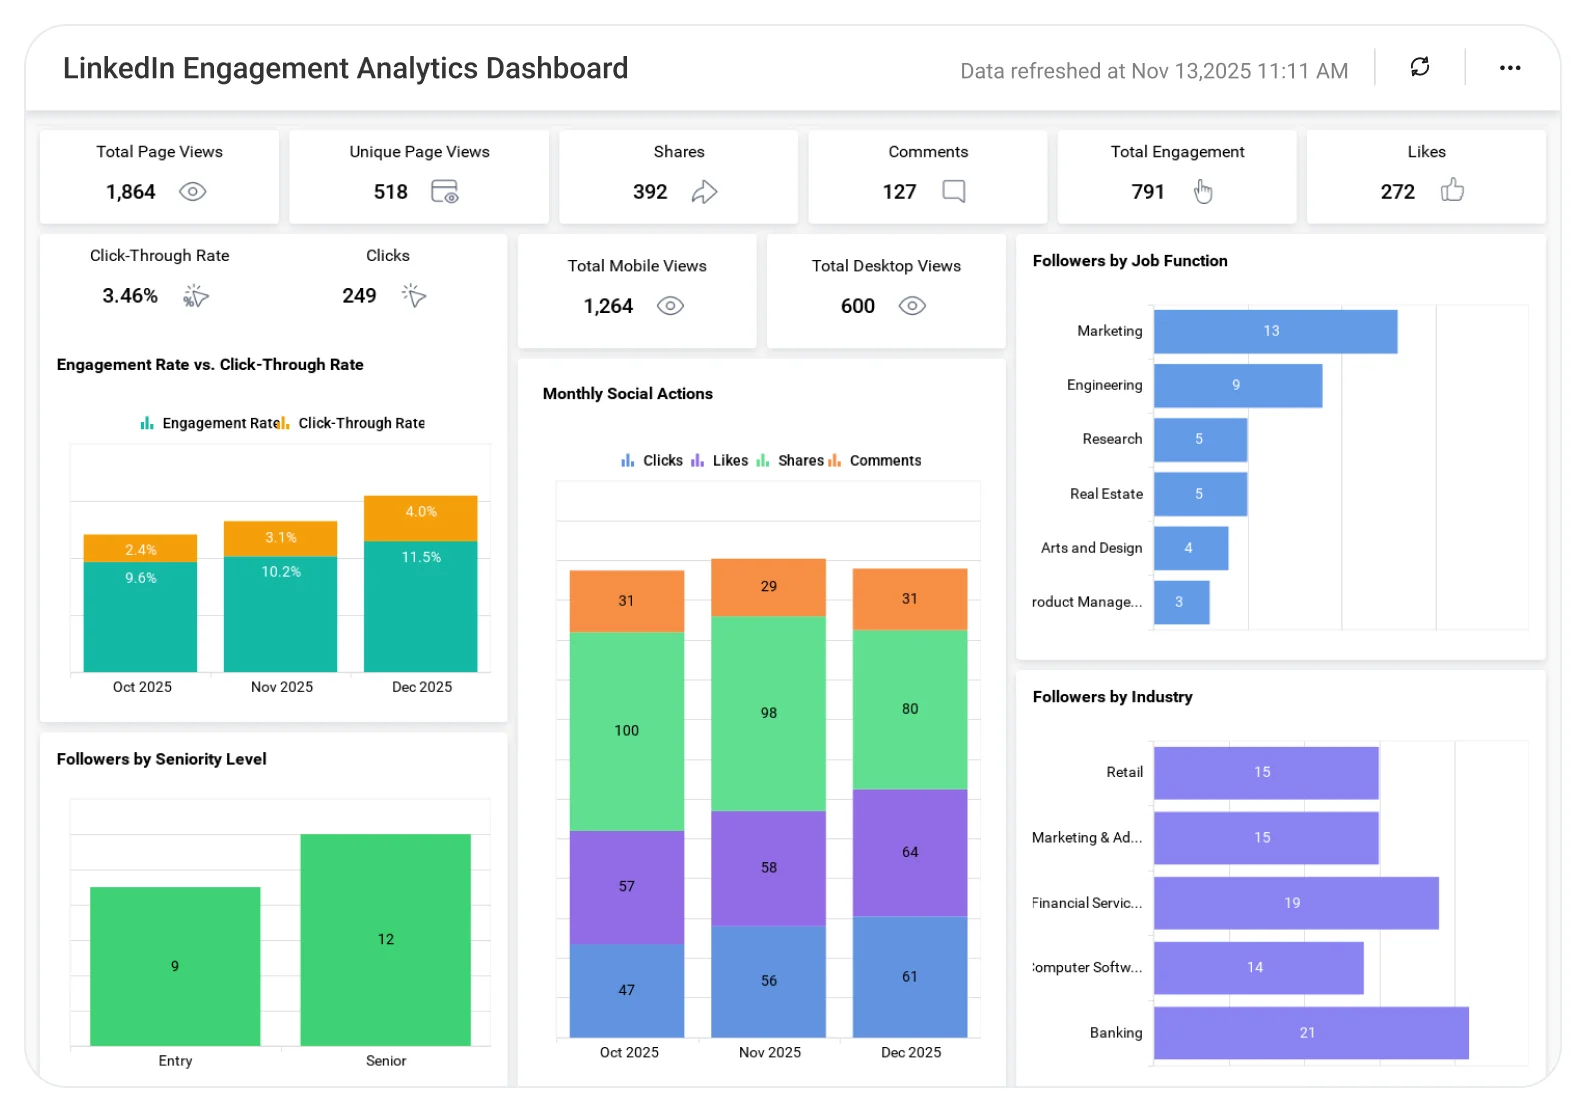
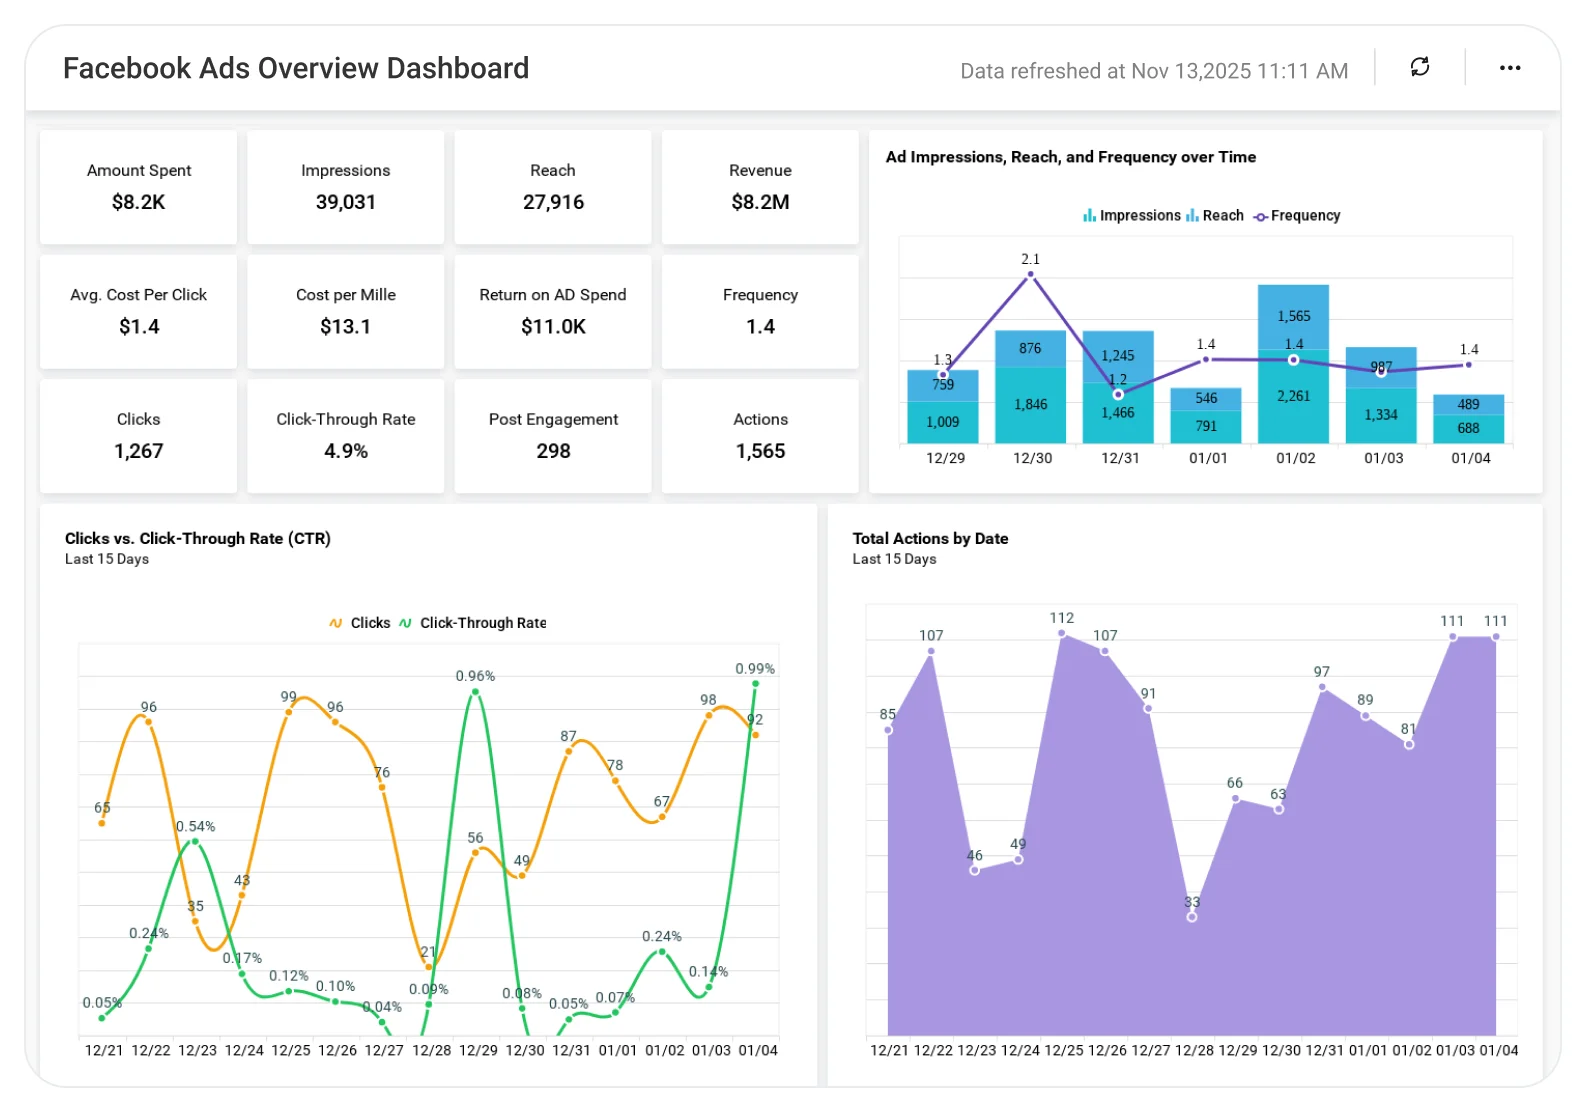
Bold BI helps social media managers visualize critical KPIs, such as page views, clicks, shares, and comments in one centralized dashboard. Interactive charts, KPI cards, and trend visuals, make it easy to spot trends hidden in raw data and make smarter content decisions.
Why Social Media Teams Choose Bold BI
Social media data often lives across multiple platforms and tools, making performance analysis fragmented and time-consuming.
Bold BI solves this by delivering:
- Unified social media visibility: Track engagement, reach, and interaction metrics across campaigns in one place.
- Clear content performance insights: Identify which posts, formats, or campaigns generate the most traction.
- Trend & pattern discovery: Spot engagement spikes, drops, and recurring patterns over time.
- Visual, decision-ready dashboards: Use charts, gauges, and KPI cards that surface insight instantly.
- Scalable analytics for growing channels: Support single accounts or multiple social platforms as teams and audiences grow.
What You’ll Track
- Engagement & interaction metrics: Monitor likes, shares, comments, clicks, and overall engagement rates.
- Content & post performance: Analyze how individual posts, formats, or campaigns perform over time.
- Audience growth & behavior: Track follower growth, repeat engagement, and audience interaction patterns.
- Trend & comparative analysis: Compare performance across time periods, campaigns, or user segments to guide strategy.
All dashboards are fully customizable so you can add KPIs or metrics as needed.
Bold BI for Social Media – Common Metrics
With fully customizable social media dashboards, teams can track KPIs such as:
- Page views and impressions
- Clicks, shares, likes, and comments
- Engagement rate and interaction trends
- Follower growth over time
- Post-level and campaign-level performance
- User-level or audience-segment interactions
Dashboards can be tailored to social media managers, marketing teams, content strategists, and leadership.
How It Works
Trusted & recognized
Analytics that wins awards and users
Recognized by G2, TrustRadius, and Visual Studio Magazine for delivering standout performance and value.
I appreciate Bold BI for making it easier to provide reporting for our customers, allowing both our analysts and customers to easily build and publish reports. The ability to build dashboards and modify queries for specific outcomes is very user-friendly. I value the mobile readiness of the app and its integration capabilities with API structures. The addition of AI features is impressive. The economic pricing model and the effective partnership, which includes consistent and helpful support, make it an invaluable tool for our OEM model.
The support from Bold is unmatched. They do not charge extra for support and it is excellent anyway. All our tickets and questions are quickly answered with authoritative and precise guidance. This is important at the product is complex, powerful and mature. To get the most out of the tool, the level of support they provide is essential.
It was easy to implement data visualizations into our product. The standard widgets allowed us to build professional looking dashboards, and a robust API provided excellent control of the development and runtime process from within our application.



Recognition






Frequently Asked Questions
More Articles About Social Media Dashboard Examples
- Social Media Analytics Dashboards
This blog explains how social media dashboards help teams track engagement, reach, clicks, and interaction trends across platforms to improve content and campaign performance.
- Storytelling with Social Media and CRM Data
This blog shows how combining social media metrics with CRM data helps teams uncover deeper audience insights and present data-driven stories using visual dashboards.
- BI Unleashed: Data-Driven Solutions for Business Growth
Discover how business intelligence (BI) can optimize sales strategies, enhance customer segmentation, track marketing ROI, streamline supply chain operations, improve inventory management, and elevate customer experiences for sustainable business growth.
Ready to Get Started?
Start your 30-day free trial instantly
Easy integration, AI-Powered Dashboards and 24x5 real-time support.