Top 5 Embedded Business Intelligence Tools for 2026
TL;DR: Comparing business intelligence (BI) tools for 2026? Here’s how Bold BI®, Looker, Tableau, Sisense, and GoodData stack up on embedding options, multi-tenancy, security, and deployment flexibility, plus practical criteria to help you evaluate the right fit for your SaaS application or embedded analytics strategy.
Introduction
Organizations are accustomed to generating and analyzing vast amounts of data, but turning that data into actionable insights is still difficult. Product teams switch between multiple dashboards, engineers spend time building internal analytics tools, and business users rely on analysts for recurring questions. It doesn’t take long for these arrangements to slow decision-making and increase operational overhead.
Embedded business intelligence tools bring analytics into the applications people already use, enable self-service exploration, and streamline how teams deliver insights. In this blog, we explore embedded BI software options for 2026 and outline practical criteria to help you evaluate their fit for SaaS applications, embedded analytics, and scalable data strategies.
What is an embedded business intelligence tool?
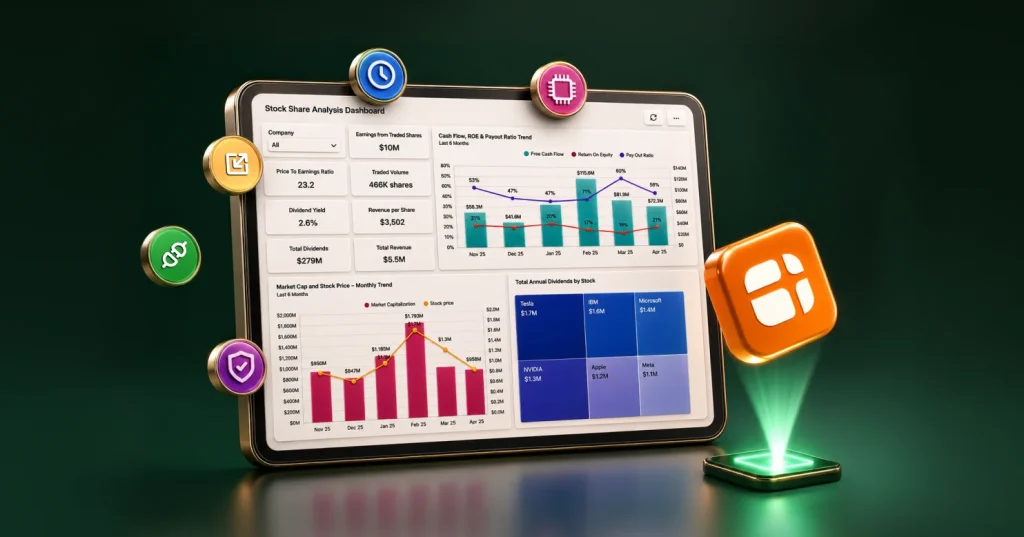
An embedded business intelligence tool is software that integrates analytics directly into applications, products, or workflows. It collects, analyzes, and visualizes data from multiple sources to support better decision-making within the tools users already work in. Instead of switching between platforms, teams can use dashboards to monitor performance, identify trends, and act on insights in context.
Here’s why embedded BI matters in 2026.
Why businesses need embedded BI tools in 2026
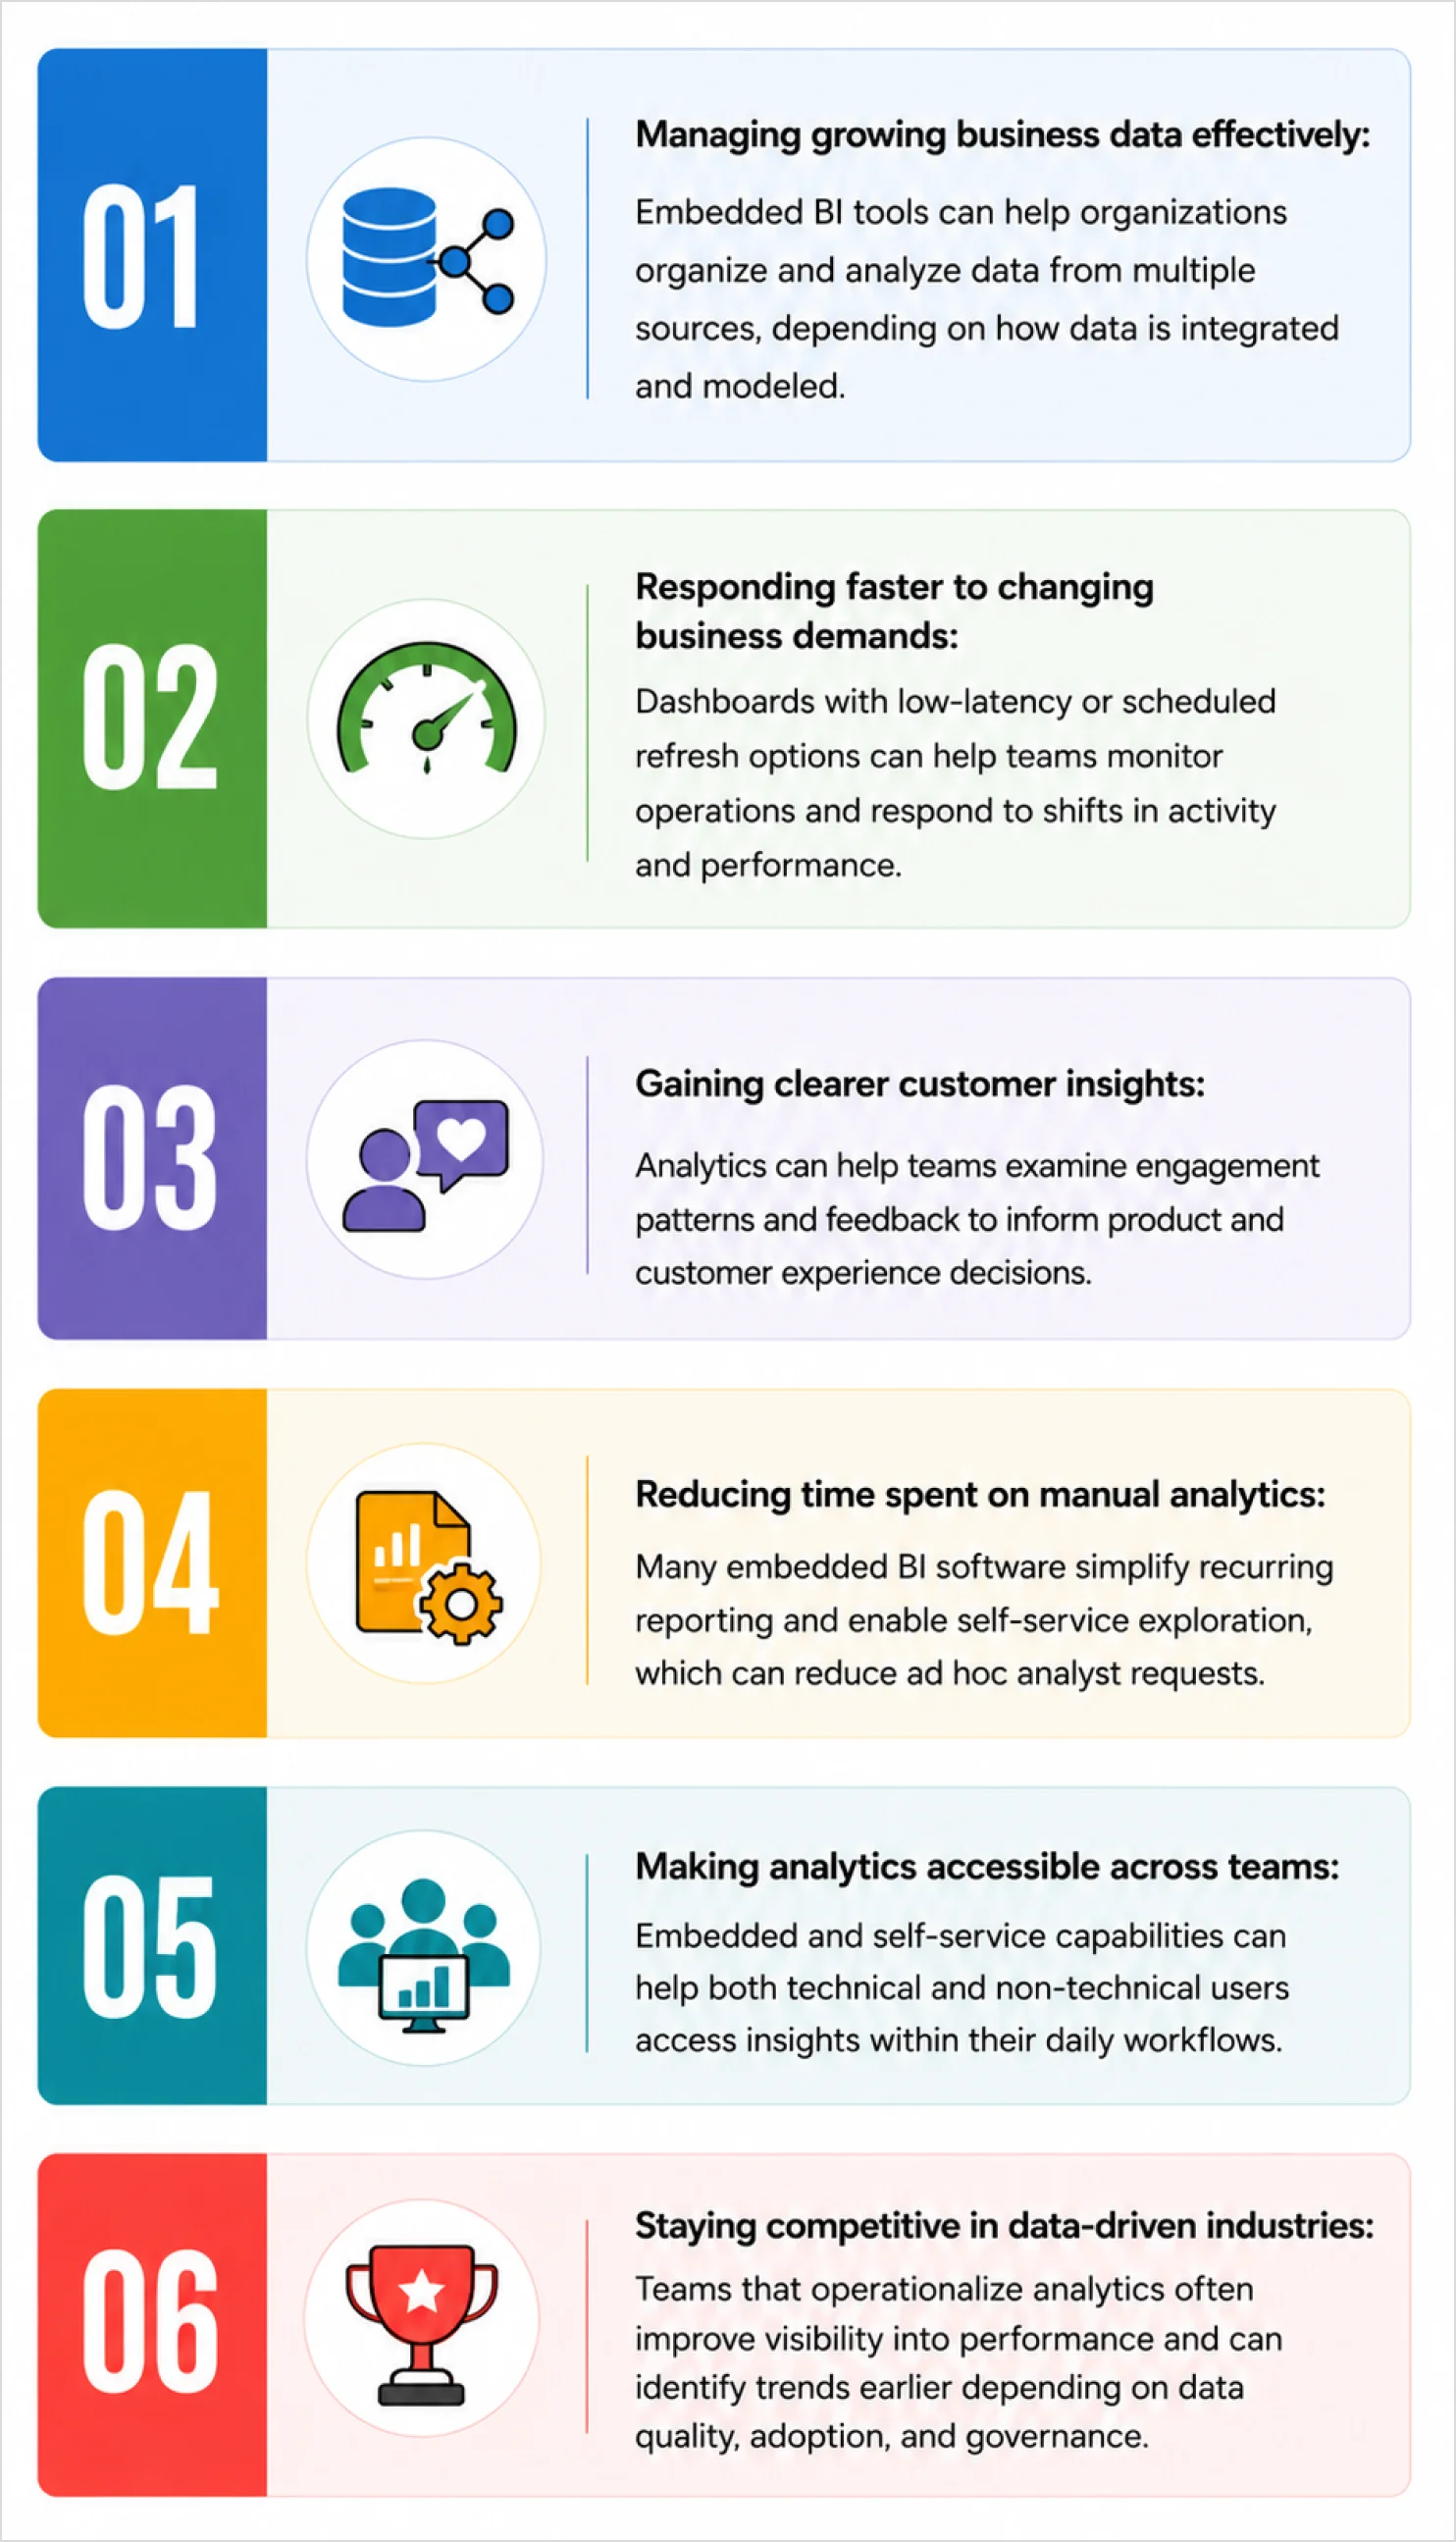
As customer demand grows, businesses generate more data across applications, interactions, operations, and digital platforms. Embedded BI software can help teams use that data more effectively in the following ways:
Next, let’s see what to look for when choosing embedded BI software in 2026.
Key features to look for in an embedded BI tool
Modern BI platforms are designed to solve analytics challenges related to scalability, fragmented data, slow decision-making, and low analytics adoption. To evaluate tools quickly, use these features as a checklist during a short proof of concept with real data. Test how well each platform supports your embedding needs, security requirements, data refresh expectations, user experience, and long-term scalability.
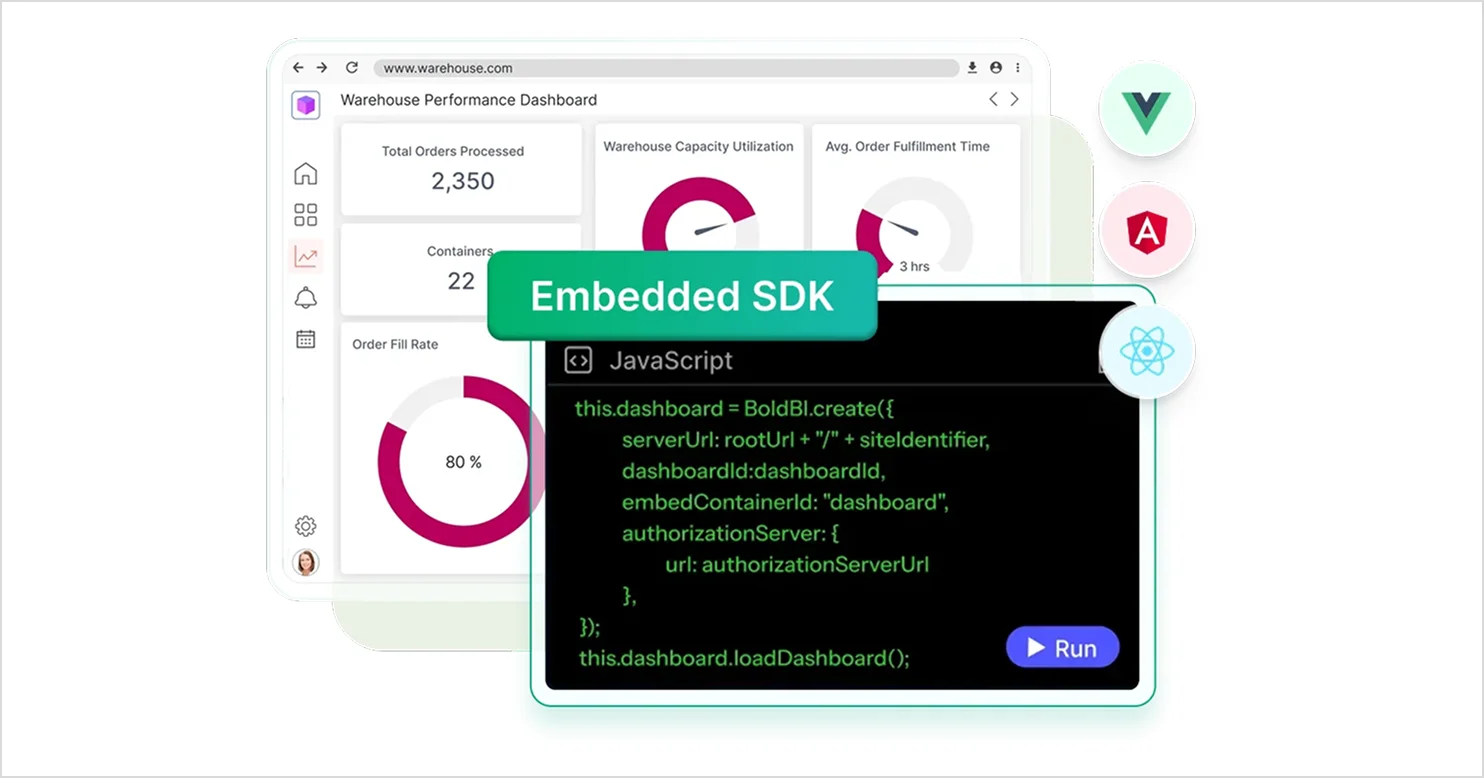
- Varied embedding support: Wide support for embedding dashboards in SaaS apps, portals, and internal tools using iframes, SDKs, APIs, or UI components, with authentication and permission controls.
Embedded analytics - Multi-tenant architecture: Evaluate tenant-level access controls, such as row-level security, delegated administration, and branding across tenants or workspaces.
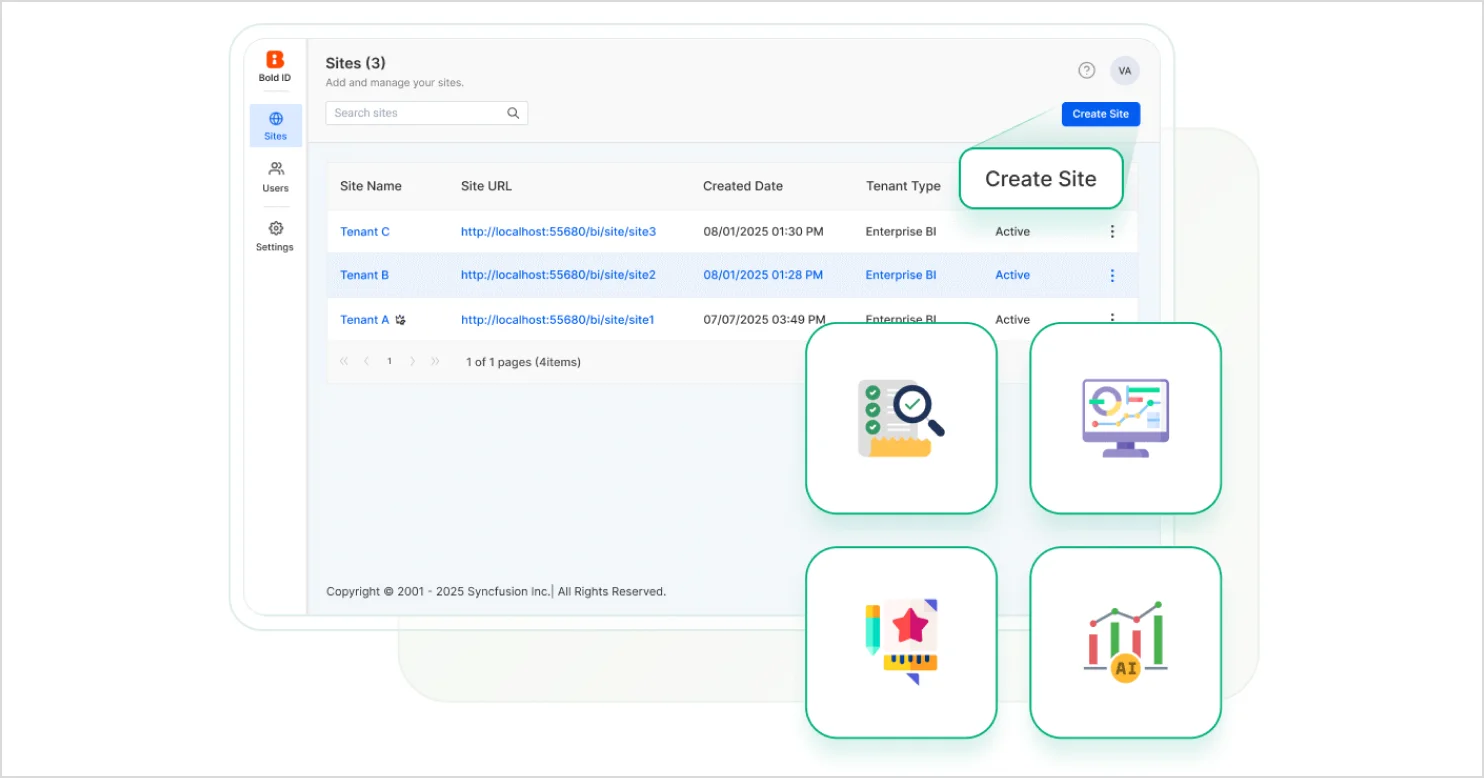
Multi-tenancy support - Deployment flexibility: Support for cloud or on-premises deployments, along with network and security requirements based on your compliance and infrastructure constraints.

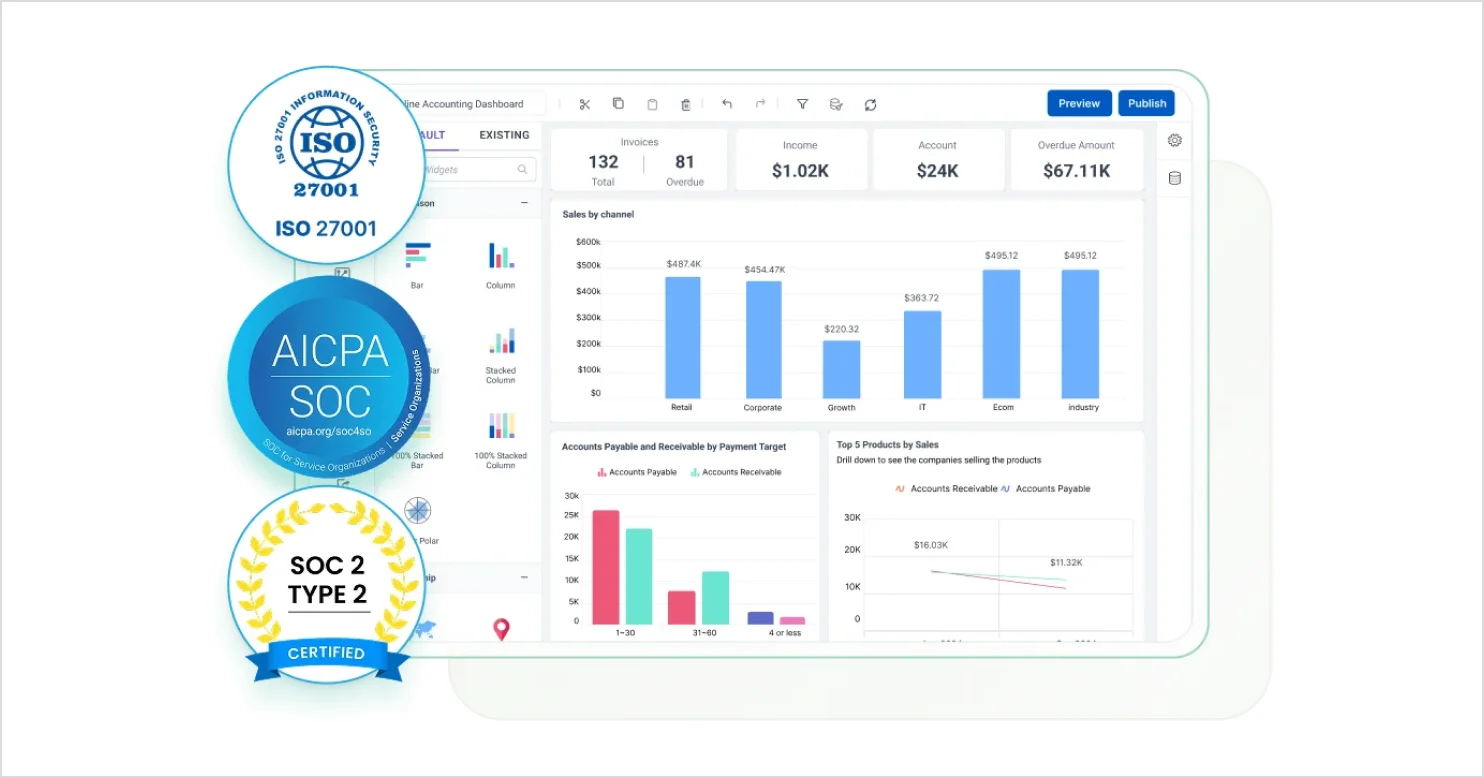
Flexible deployment - Security and governance: Features such as role-based access control, SSO options, encryption, audit logs, and governance controls aligned with your data sensitivity and regulatory needs.
Enterprise-grade security - Self-service analytics: Tools that enable users to explore data, build and interact with dashboards with minimal reliance on engineering or IT, within governed boundaries.
Self-service analytics - AI-powered analytics: Capabilities such as natural language exploration, guided insights, or assisted authoring. Availability and features may vary by plan, region, and data model readiness.
- Interactive data visualization: Support for filtering, drill-down, and parameterized views to encourage exploration and reduce reliance on static analytics.
Data visualization - Collaboration and analytics sharing: Secure distribution options for internal and external users, including access-controlled sharing, exports, and scheduled delivery.
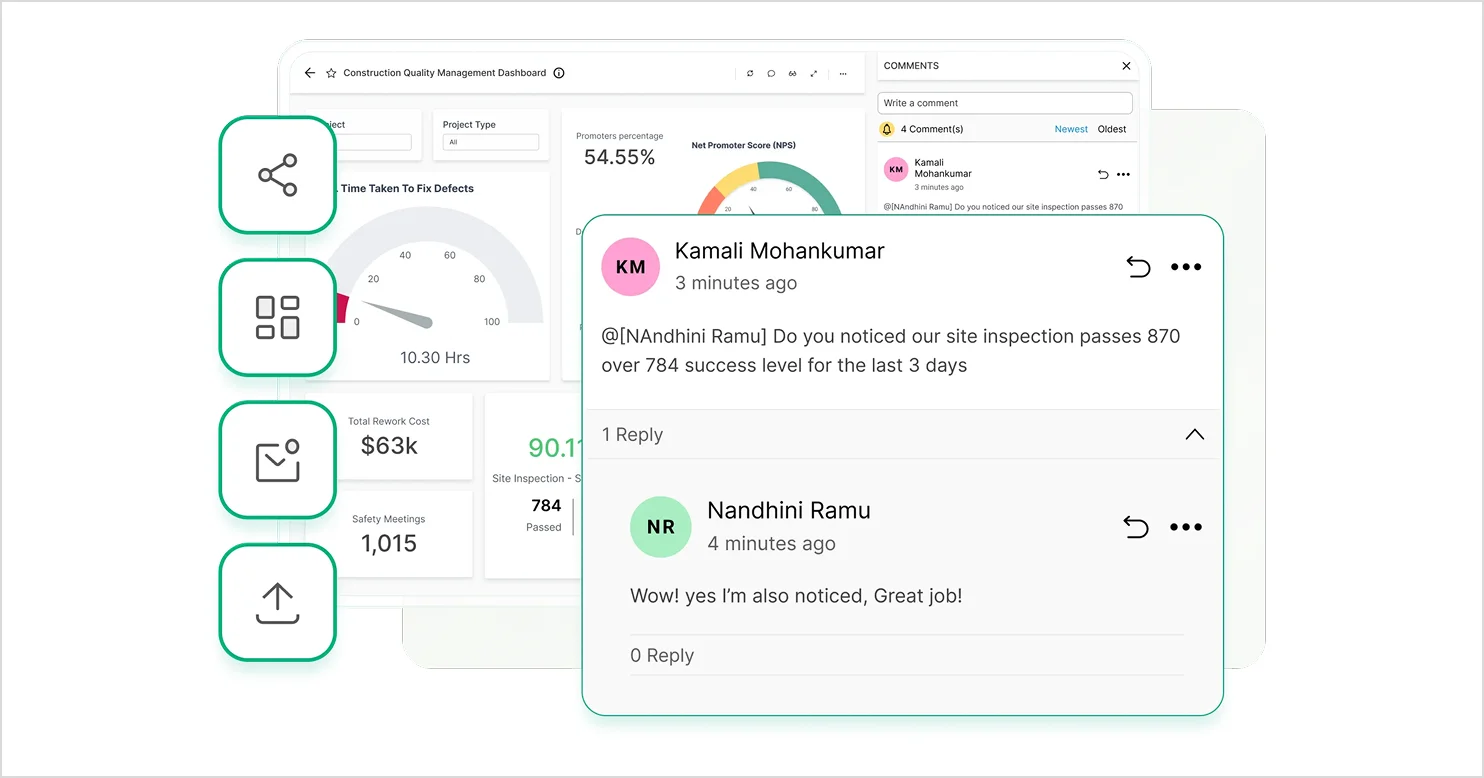
Collaboration and sharing - Pricing transparency for embedding: Clear terms for external distribution, viewer-based licensing, capacity limits, and embedded licensing so you can forecast costs as your user base grows.
- Data freshness controls: Delayed insights can lead to missed opportunities and slower decision-making. Look for near-real-time or scheduled-refresh dashboards depending on your data sources and configuration.
Now let’s look at the top embedded business intelligence tools for 2026.
Top 5 embedded BI tools for 2026
Here are five popular embedded BI tools to consider in 2026.
1. Bold BI
Bold BI provides embedded analytics and dashboarding capabilities that teams can use to deliver insights inside their applications. Its embedded analytics capabilities support different industries and roles, helping teams explore analytics solutions that fit their business needs.
Bold BI is best for:
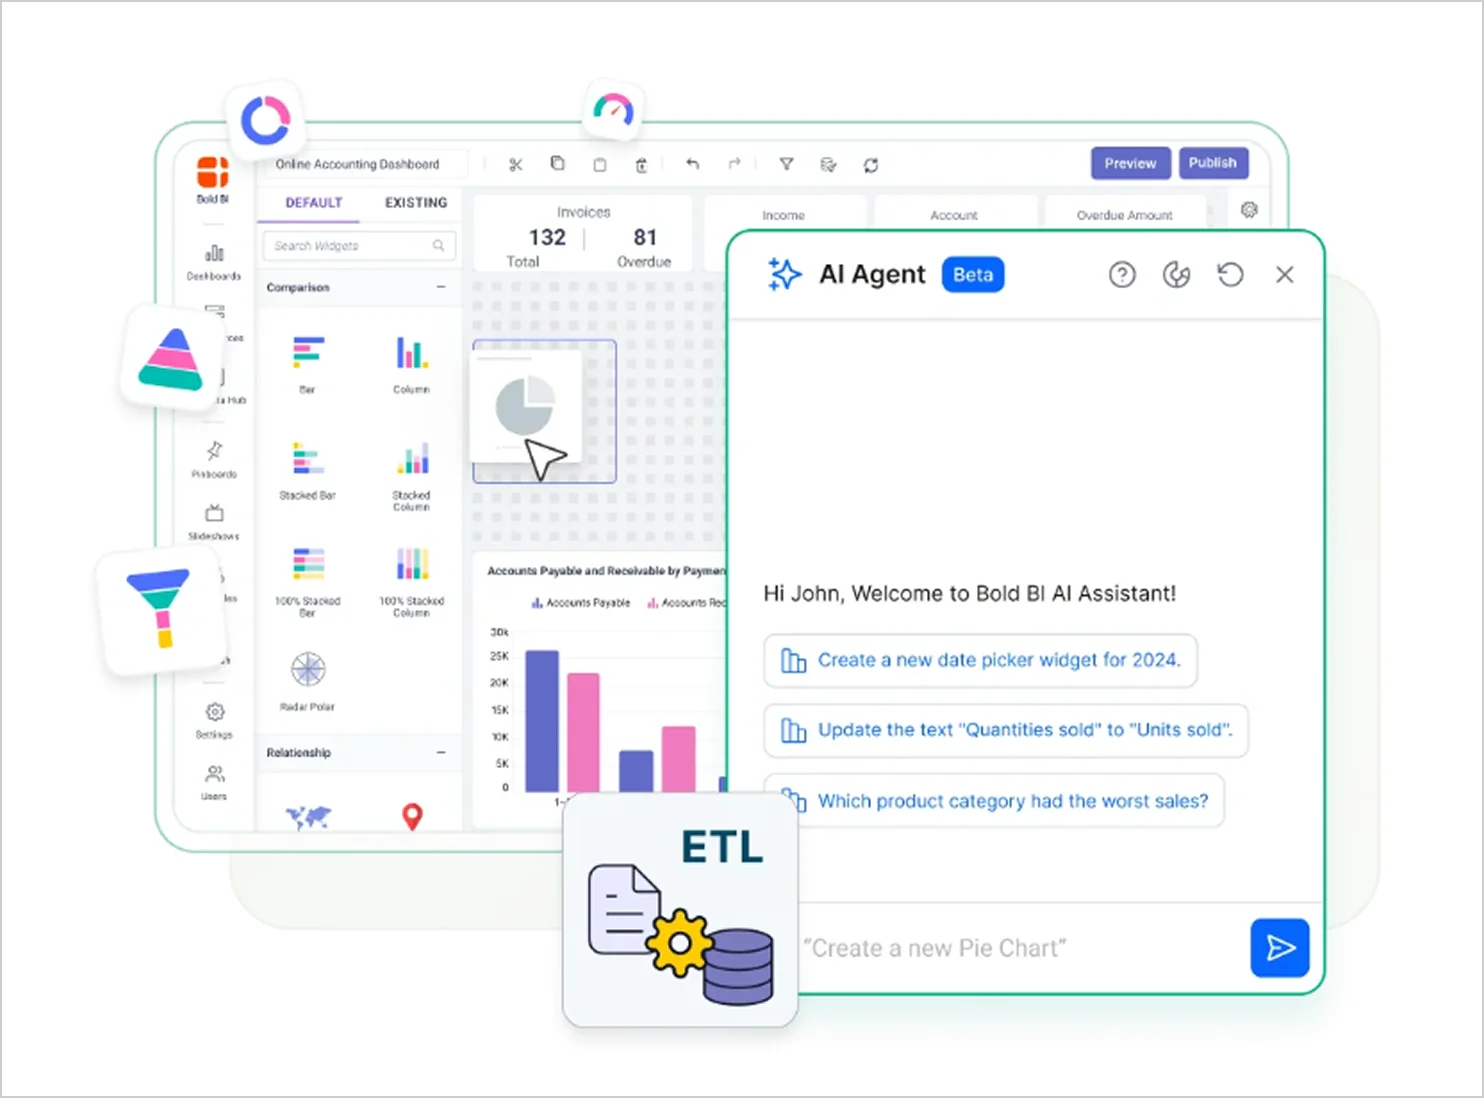
- AI-powered analytics: Ask questions in plain language, generate dashboards from prompts, and create summaries that turn complex data into actionable insights. Availability may vary by plan.
- Self-service analytics: Build and customize dashboards using a drag-and-drop designer, with governance controls to help manage access and consistency.
- Enterprise dashboards: Track KPIs and operational metrics with interactive dashboards that support filtering and drill-down analysis.
- Data connectivity: Connect to a variety of data sources, including databases, cloud data warehouses, and APIs. Connector availability may vary by deployment and version.
- Cloud and on-premises deployment: Deploy Bold BI in cloud or self-hosted environments based on security, scalability, and infrastructure requirements.
- Data modeling and preparation: Organize and model data to support consistent metrics and more reliable analytics outcomes.
To see how Bold BI supports embedded analytics for SaaS applications, read our blog, Why You Should Choose Bold BI for Embedded Analytics.
2. Looker
Looker is an enterprise platform for BI, data applications, and embedded analytics that helps teams explore and share insights in real time.
Looker is best for:
- Semantic data modeling: Define business logic using LookML to maintain consistent metrics and data interpretation across teams.
- AI-powered data exploration: Use conversational analytics to explore data, generate insights, and interact with dashboards using natural language.
Compare Looker’s features against Bold BI’s.
3. Tableau
Tableau helps organizations build trusted analytics experiences by connecting, preparing, and analyzing data across different business environments. With AI-powered insights, conversational analytics, and integrations across workflows like Slack and CRM, it supports embedded analytics and data-driven decision-making at scale.
Tableau is best for:
- Data visualization and exploration: Analyze and visualize data using interactive dashboards designed for flexible data exploration.
- Flexible deployment and data connectivity: Connect to multiple data sources and deploy analytics in cloud or on-premises environments.
Compare Tableau’s features against Bold BI’s.
4. Sisense
Sisense is an AI-powered analytics platform that helps teams model, visualize, and embed data experiences with tools designed for faster analytics workflows.
Sisense is best for:
- Interactive data visualization: Create dashboards with charts, filters, and customizable visual elements for data exploration.
- Data modeling and preparation: Combine, transform, and structure data using modeling tools and integrated data pipelines.
Compare Sisense’s features against Bold BI’s.
5. GoodData
GoodData helps organizations embed AI-powered analytics directly into applications and products while maintaining a seamless user experience.
GoodData is best for:
- Interactive data visualization: Create dashboards with filters, drill-downs, and customizable visualizations.
- Automated analytics workflows: Schedule exports, set alerts, and deliver insights across different channels.
Compare GoodData’s features against Bold BI’s.
Explore more embedded analytics and BI software options on G2.
Now that you’ve learned about popular embedded BI tools for 2026, here are common ways teams use them across industries.
Use cases for embedded BI tools in various industries
Modern businesses use BI tools to monitor operations in real time, improve visibility across systems, and deliver analytics directly within everyday workflows. Here are a few practical examples of how different industries use BI platforms in 2026.
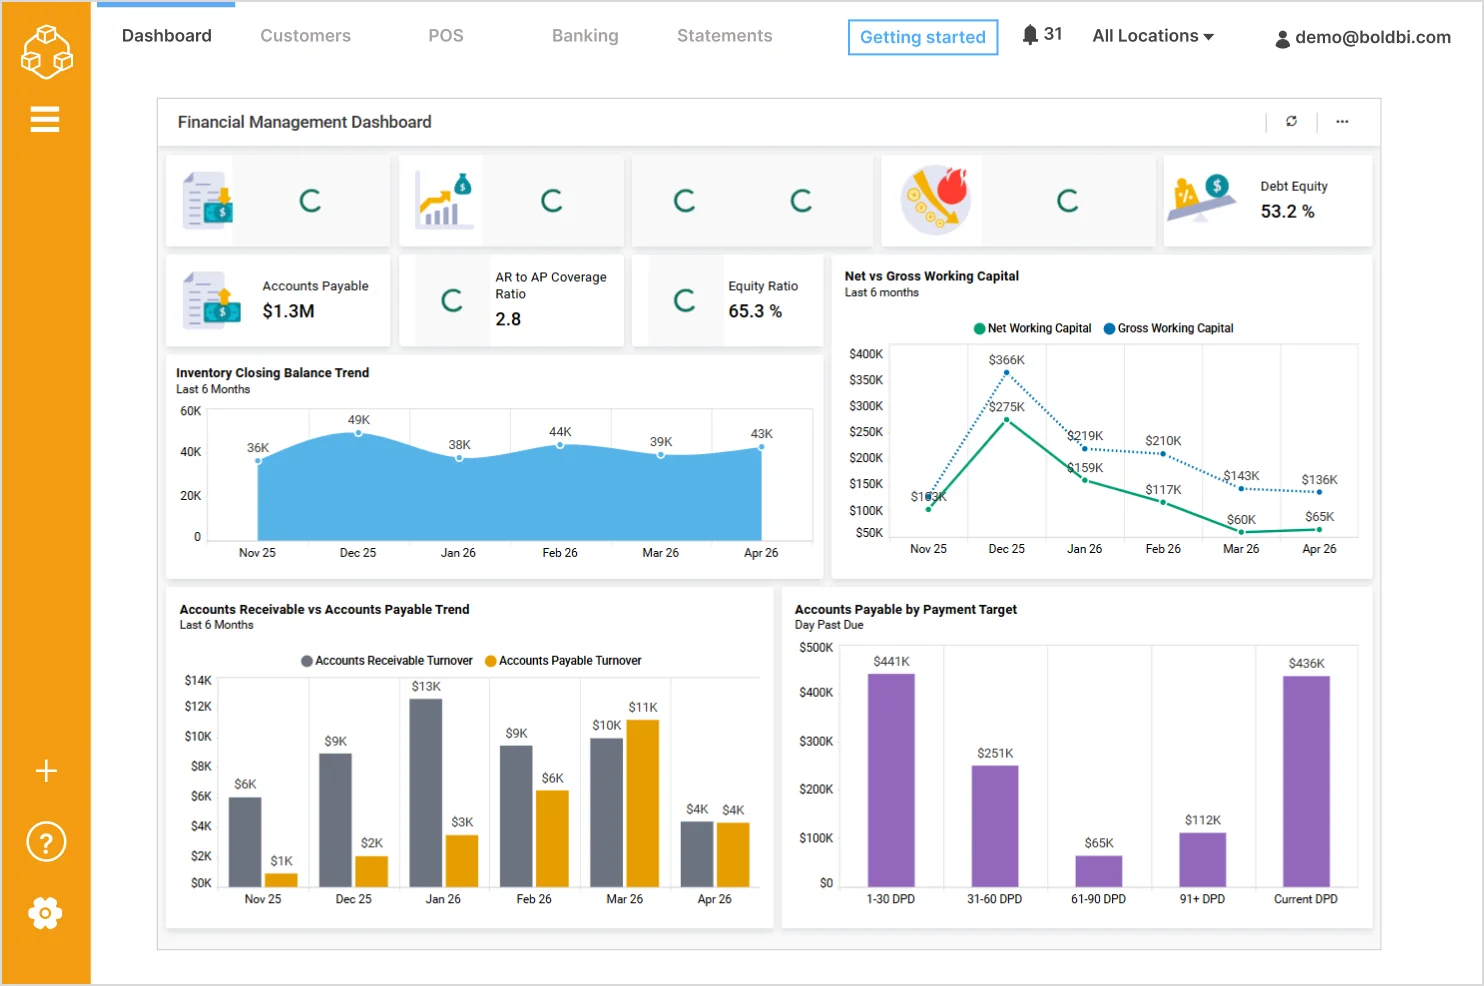
1. Finance: Monitoring financial performance in real time
Finance teams monitor revenue, expenses, receivables, and profitability across multiple systems, making it difficult to maintain a consistent and real-time view of financial performance.
When financial data is not unified:
- Teams struggle to track key metrics such as revenue, accounts receivable, accounts payable, and profit margins in one place.
- Monitoring trends like cash flow, working capital, and burn rate requires switching between multiple financial systems.
- Limited visibility into financial KPIs can delay budgeting, forecasting, and strategic planning decisions.
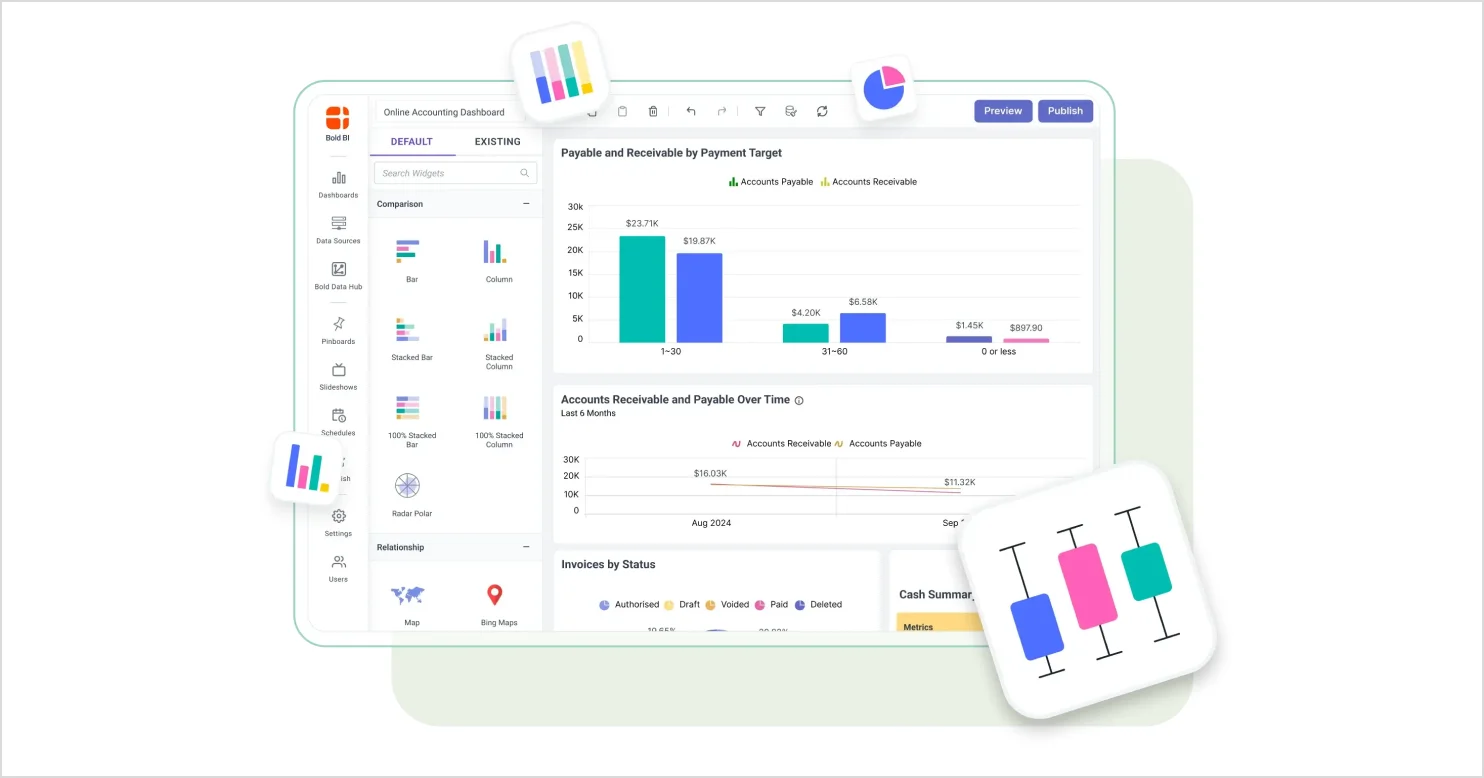
With modern embedded BI software, finance teams can consolidate data into real-time dashboards that provide a complete view of financial health. Information such as revenue, gross profit margin, working capital trends, and receivables versus payables can be monitored continuously, enabling faster analysis, better forecasting, and more informed financial decisions.
For SaaS and financial platforms, these dashboards can also be embedded directly into customer portals and finance applications, allowing users to access insights without switching between tools.
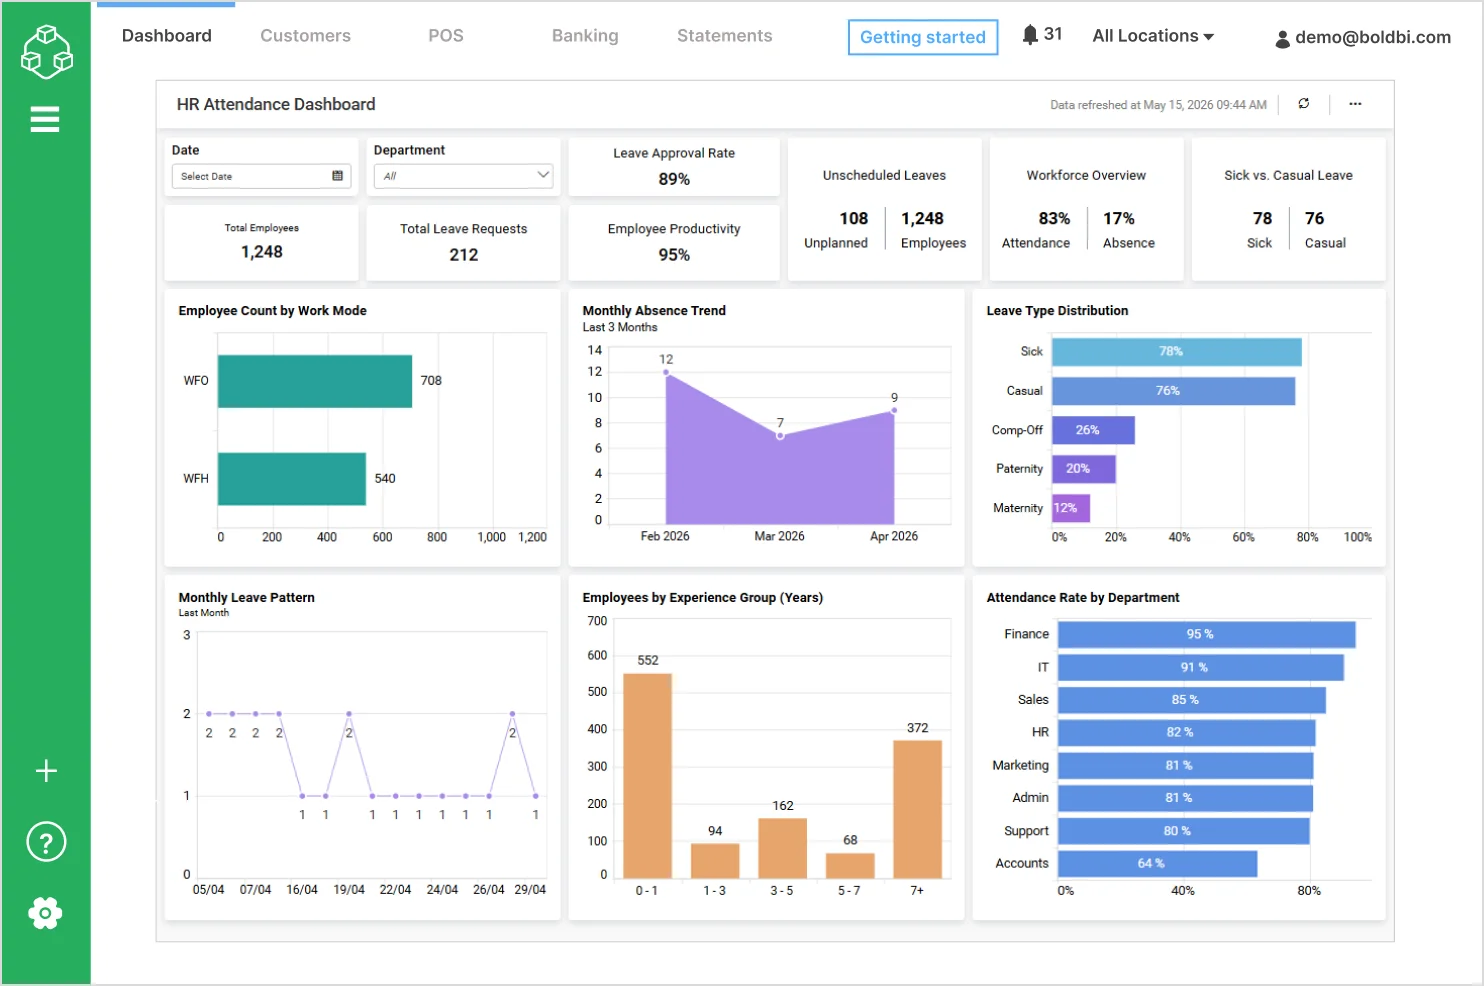
2. Human resources: Analyzing workforce trends and employee engagement
HR teams manage employee data across recruitment, attendance, performance, and engagement systems, making it challenging to maintain a unified and up-to-date view of workforce health.
When workforce data is not centralized:
- Teams struggle to monitor key metrics such as attendance rates, leave requests, and employee productivity in one place.
- Trends in absenteeism, leave patterns, and workforce distribution are harder to identify over time.
- Limited visibility into workforce metrics can delay responses to engagement and performance issues.
With modern embedded BI tools, HR teams can consolidate data into interactive dashboards to track attendance, analyze leave trends, monitor employee productivity, and evaluate workforce distribution. This enables better visibility into workforce performance and accelerates analytics workflows.
HR software providers and enterprise platforms can embed these analytics directly into employee management systems and HR portals, helping managers and employees access workforce insights within their existing workflows.
These use cases show that embedded business intelligence tools work best when insights are easy to access, reliable, and secure.
Why should you choose Bold BI for your embedded BI needs in 2026?
Choosing the right embedded BI tool depends on how well it fits your product, scales with your users, and simplifies analytics delivery. For SaaS and modern applications, the focus should be on embedding, scalability, seamless integration with other platforms, and ease of use.
Bold BI® is designed to support these needs. It helps customers solve analytics challenges with faster dashboards, live data access, and easier embedding, as demonstrated in the following customer stories:
Beyond these customer stories, Bold BI has been recognized for its ease of use, powerful integrations, embedded analytics capabilities, and responsive customer support, as reflected in G2 reviews.
Powerful, Flexible Analytics Platform with Intuitive Design and Excellent Support
“Bold BI provides a powerful and flexible analytics platform that is easy to implement and integrate with various data sources. The dashboard designer is intuitive, allowing both technical and non-technical users to build meaningful visualizations quickly. Its ability to connect directly to databases, APIs, and web services makes it highly suitable for enterprise-level reporting. I also appreciate the strong customization options, embedding capabilities, and the overall performance when handling large datasets. Customer support has also been responsive and helpful whenever assistance is needed.”
By Mohamed Zulfadli A., a G2 reviewer.
Simple, Powerful, and Works Well
“I’ve been using Bold BI regularly, and it’s been easy to use and set up. It has a clean, simple interface, but still lets you build powerful dashboards and reports. I also like that it connects to lots of different data sources and works well for embedded analytics. It feels practical and flexible, whether you’re building for a small team or a larger organization. Overall, it’s straightforward, reliable, and does what you need without being complicated.”
By Muhdin M., a G2 reviewer.
These examples illustrate how Bold BI helps teams deliver embedded analytics and streamline analytics workflows.
Ready to test Bold BI in your product? Start a free trial or request a demo to validate embedding, multi-tenancy, and performance with your real data.
Related Resources:
- 7 Business Intelligence Trends to Watch in 2026
- Why Embedded BI is Better than Custom-Built BI Solutions
- Bold BI vs. Tableau vs. Power BI: Best for Embedded Analytics
- Top Embedded Analytics Tools for SaaS Product Teams in 2026
- SaaS Analytics Platform in 2026: Why It Matters & Use Cases
- Choosing Embedded BI: Build or Buy?
Frequently asked questions
- 1.
What are embedded business intelligence (BI) tools?
Embedded BI tools integrate dashboards and interactive analytics directly into your application so users can analyze data in context without switching platforms.
- 2.
What’s the difference between embedded BI and embedded analytics?
Embedded analytics refers to the analytics experience inside the product, while embedded BI encompasses the full platform, including its data connectivity, modeling, governance, security, and administration.
- 3.
What are the most common ways to embed analytics in a SaaS product?
Teams typically embed analytics using iframes for speed, SDKs for stronger UI control, or APIs and components for the most native and customizable experience.
- 4.
What does multi-tenant embedded analytics mean, and what should I verify?
Multi-tenant embedded analytics means serving multiple customers from one setup with strict data separation. You should verify tenant isolation features such as row-level security, tenant-level permissions, and tenant-specific branding controls.
- 5.
What security features matter most for embedded BI?
Prioritize SSO, role-based access control, row-level security, encryption, audit logs, and governance controls that prevent data leakage across users or tenants.
- 6.
How much does embedded analytics cost and what pricing model is best for SaaS?
Costs vary based on per-viewer, capacity-based, or licensing-based pricing models. The best model is the one that scales economically with external customer distribution.
- 7.
How should product managers and engineering teams evaluate embedded BI tools quickly?
Run a short proof of concept using real data to test embedding UX, multi-tenancy, SSO, performance, governance, and total cost against their product requirements.