

Application Analytics: Improve Your Apps Using Embedded Analytics
Introduction
Integrating analytics into an organization’s workflow is one of the keys to being a data-driven organization. When analytics is viewed as something to be carried out along with duties, hesitancy to integrate analytics within your organization’s applications is eliminated, and using analytics will feel like a natural fit to the workflow for employees. Application analytics makes the adjustments to adopting analytics easier for an organization, but the right analytics solution must be selected to fulfill the organization’s requirements.
In this blog, I am going to give you a walk-through of why you should apply application analytics to your business by exploring the following subtopics:
- What is application analytics?
- Why application analytics?
- Benefits of application analytics
- Factors to consider before selecting an application analytics solution
- How does Bold BI help in application analytics?
What is application analytics?
Application analytics is the workflow of capturing data on application usage, analyzing it, and delivering meaningful insights within the application. It helps daily operations and provides relevant data for users to perform their work efficiently. The better the application performs, the better the company’s user satisfaction rate.
Why application analytics?
Application analytics helps you be in the right place at the right time with your data. Turning your data into an operating system (a literal one, not a computer one) requires an application that is capable of containing your data. This will give you the proper analytical tools to monitor and drive your business effortlessly.
Application analytics helps business leaders develop ideas and solutions to better manage their app, its data, and even other areas of the company. It opens a world of possibilities for your business. The thoughtful implementation of application analytics is built on a solid foundation of data transformation tools and best practices. It helps you change your organization’s culture and set the stage for enhanced efficiency, stronger strategic positioning, and improved customer satisfaction, all of which will help you drive revenue and grow your business.
Benefits of using application analytics
Here are some major benefits gained from application analytics:
- Assemble accurate data to serve unlimited users
- Track organizational achievement
- Offer data-driven insights into issues and feedback
- Improve return on investment (ROI)
Assemble accurate data to serve unlimited users

Data is essential in an application. Without data, there is no analysis. To make the data impactful, accurate, functional data should be appropriately assembled for analytics. Application analytics works to improve your business and enrich users with the best data insights. With accurate assembled data, users can smoothly run their operations and pursue their goals with ease. The data can be used to serve unlimited users working on the same project, allowing them to collaborate as needed and deliver on time.
Track organizational achievement

Application analytics tracks your organization’s spending of both time and money on each channel of the business. This helps the organization gain insights into its cash flows and identify which investments show the most promise of returning profits. With this information, the organization can monitor its operational achievement margins and foster positive growth. Application analytics encourages team leads to track their users and ensure the services users receive from the application are satisfactory.
Offer data-driven insights into issues and feedback

It is quite challenging to achieve application engagement if the organization lacks loyal customers who regularly use the application and provide feedback. Application analytics offers real-time data to learn where, when, and why problems and issues arise within the app. The analytics solution tracks the app’s operations data and detects any unique action beyond regular work. This helps the app operations team address issues. It also gives app managers opportunities to present unique offers to customers who may have encountered challenges using the app. In addition, the app team can easily monitor users to ensure all concerns and queries are responded to, increasing the product’s usability.
Improve return on investment (ROI)

Return on investment evaluates an investment’s efficiency and profitability. With application analytics, the company can understand user behaviors within the application and locate where the application experience should be enhanced. Improving the application gives the company better returns on its time and financial investments into the app.
Factors to consider before selecting an application analytics solution
Business objective
Before you implement application analytics for your business, consider how to align the power and purpose of application analytics with your work. Know the principles behind your application. How does it achieve, or help achieve, your business goals? How will analytics enhance the company’s ability to achieve those goals? By prioritizing the effective contributions of analytics, rather than treating analytics as a flashy new feature tacked on, you will have a better experience.
Pricing
Pricing is crucial when purchasing an analytical solution because it will determine the level of services you receive. Many solutions offer a free tier, but these are significantly restricted in scope and usability. Mid-level pricing tiers provide other services, but not the entire solution. The highest tier gets you the full product, but you may have to manage your own upgrades, and perhaps even use the vendor’s servers to run the analytics.
Considering pricing also helps you budget and plan your business for better returns on a quarterly or yearly basis. Accommodating the expense of an analytics solution should be well worth the price.
User interface
The user interface greatly affects how effectively users will be able to run the application analytics. Have users of different skill levels test the solution’s interface to see if it is intuitive, if some training will be required, or if it should be touched only by utmost experts. Ideally, the user interface should provide flexibility to a wide range of users to accommodate their skills and the tasks they need to perform.
Visualization
Visualizing data is essential to explaining it and understanding it in the context of your business operation. Carefully check the depth of visualizations the analytics solution supports. You want to be able to configure the visualizations in precisely the way you need. This will allow all users with access to the application to create and build their visualizations from the analytics simply and easily.
Application features
What kind of features are you ready to have in your application? Do they support your business objectives? Make sure the analytics solution includes features that empower the users in their roles and enhance their satisfaction with the application. Check whether the application easily integrates with other services or apps that are foundational to your business.
Security
Data protection is critical to any analytics solution. Carefully review the solution’s data privacy policy and the developer terms and conditions. This will help you know how safe your data is and what extra precautions you may need to take. If the policies or terms are not a good fit for your business, it’s perfectly reasonable to look for another solution.
How does Bold BI help in application analytics?
Bold BI can be the analytics solution in your business applications. Let’s discuss its benefits over other solutions.
Key features of Bold BI
Modern data architecture
Structural data assets and management pose a challenge to flexibility. With Bold BI, you aren’t required to bring all your data into our data store. Also, you don’t need to design a complex system for data integration, nor keep the embedded BI data store in sync with your data sources. With Bold BI, you connect directly to 150+ data sources and any data warehouse of your choice, such as Excel, SQL, Azure SQL, Amazon Redshift, and more. It helps you connect easily and quickly to the source of your choice.
Intuitive widgets
Bold BI allows you to understand and instantly analyze your organization’s and products’ data through easy-to-use widgets. These empower users to act based on up-to-the-minute data without having to switch contexts. Such widgets include column charts, bar charts, stacked bar charts, maps, pivot grids, pie charts, pyramid charts, and funnel charts.
Deployment
Bold BI is a flexible environment that best suits your need. You can easily deploy on our public cloud, Windows, Linux, or a content management environment such as Kubernetes. On-premises deployments are self-contained and do not require any connection to any other environment outside your control.
Multitenancy support
Bold BI goes easy on your wallet. With just one server, you can serve multiple users. This is a critical feature of Bold BI. Not only does multitenancy save you money, it also boosts the security of your data as it is controlled from one channel.
Teamwork
Efficient team operation and cooperation is a strong foundation for any business. Bold BI provides a platform that enables you to coordinate all your teams in your organization to complete projects on time and achieve business goals.
Data visualization
Visualized data is easily shared, understood, and applied to inform decisions. Bold BI provides tools to visualize your data as you desire. It allows the combination of widgets in an intuitive fashion.
To learn more about embedding analytics in your application, refer to this blog: Embed Analytics into an Application – A Step-by-Step Guide. It will help you learn how to select the right embedded analytics solution and how to embed analytics in your application with Bold BI. You can also download the sample code mentioned in that blog from our documentation.
How to embed analytical tools into applications
Embedding analytics and data visualization capabilities into your business application’s user interface improves data comprehension and usability. You can embed a KPI dashboard directly in your business software to gain insights without wasting time navigating to a separate application or website.
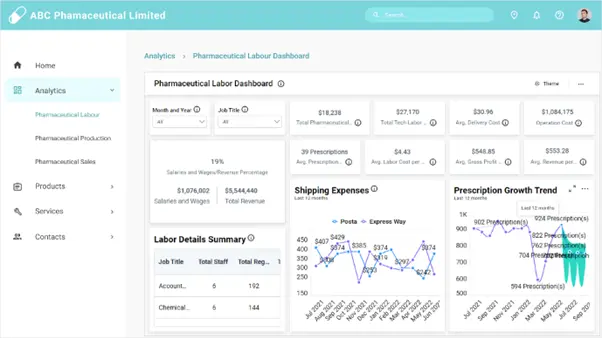
I am going to show you an example of embedded analytics in a pharmaceutical company’s React web application. This will also give you an idea of how easy it is to embed Bold BI analytics into your own day-to-day software without having to build one yourself.
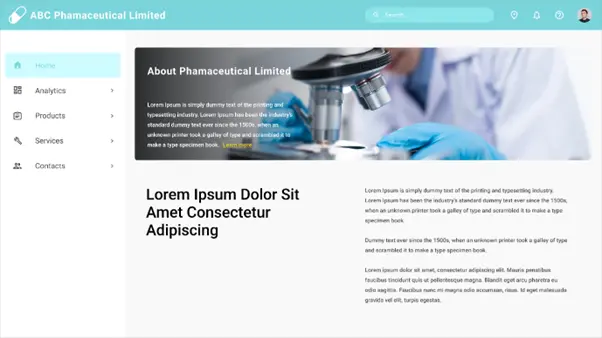
Bold BI helps you embed dashboards in more than 18 web platforms, including React with ASP.NET Core, React with Go, WinForms, Node.js, Vue with Go, and Vue with ASP.NET Core. Consider a scenario where your pharmaceutical company has a website like the one shown in the following image.
Follow these steps to embed a dashboard successfully.
Prerequisites
Download and install the Bold BI server on your local machine and create a dashboard. You can find the installation and deployment steps here.
Step 1: Create an Angular application.
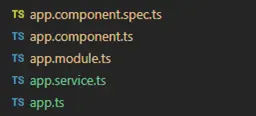
To successfully embed a dashboard in your application, you first need to create an Angular application. Create a new Angular project in Visual Studio Code and add the necessary TS files to the project as shown in the following image.
For more guidance, refer to the sample code in the Bold BI documentation.
In this demonstration, the Angular application acts as a client, and an ASP.NET Core application acts as a server. You need to add several properties in the app.component.ts file as shown in the following table and screenshot.
| Properties | Property Value Descriptions |
| RootUrl | Bold BI dashboard server URL.
For example: https://localhost:5000/bi. |
| SiteIdentifier | For Bold BI, it should be something like site/site1.
For Bold BI Cloud Analytics Server, it should be an empty string. |
| Environment | Your Bold BI application environment.
If using Bold BI Cloud Analytics Server, you should use cloud. If using Bold BI, you should use enterprise. |
| User Email | The Bold BI server will use an email address to authorize the authorization server. |
import { Component, Injectable } from '@angular/core';
import { Router, ActivatedRoute } from '@angular/router';
import { appService } from './app.service';
import { Item } from './app';

@Component({
    selector: 'app-root',
    templateUrl: './app.component.html',
    styleUrls: ['./app.component.css'],
    providers: [appService]
})

@Injectable()

export class AppComponent {

    //ASP.NET Core application would be run on http://localhost:61777/, which needs to be set as "apiHost"
    public apiHost = "http://localhost:5000";

    //Dashboard Server BI URL (ex: http://localhost:5000/, https://demo.boldbi.com/bi/)
    public rootUrl = "http://localhost:5000/bi";

    //For Bold BI Enterprise edition, it should be like 'site/site'. For Bold BI Cloud, it should be empty string.
    public siteIdentifier = "site/site1";

    //Url of the GetDetails action in ValuesController of the ASP.NET Core application
    public authorizationUrl = "/api/home/getdetails";

    //Url of the GetDashboards action in ValuesController of the ASP.NET Core application
    public getDashboardUrl = "/api/home/getdashboards";
    public baseUrl = "";
    public dashboardServerApiUrl = "";
    public dashboards: Item[];
    constructor(private _app: appService) {
    }
    ngOnInit() {
    }
}

After adding these properties, we need to create the Bold BI instance.
Step 2: Create a Bold BI instance.
After the Angular web application is created, you need to create a Bold BI instance to communicate between the server side (any web application) and the client side (Angular application), which allows us to embed a Bold BI dashboard in the Angular application.
Step 3: Create an authorization server to authenticate the Bold BI server.
Every application that embeds a Bold BI dashboard or widget must be authorized with the Bold BI server. This authentication step requires sending confidential information to the Bold BI server, such as users’ email addresses, group data, and embed signatures. So, in your server application, implement this authentication flow and provide the URL for connecting to your server in the Bold BI instance.
Step 4: Run the Angular application to view the embedded dashboard.
In the Angular application, enter the authorization URL and dashboard URL that were defined in the ASP.NET Core application. Finally, you can that see the dashboard created in the Bold BI server is embedded in your web application.
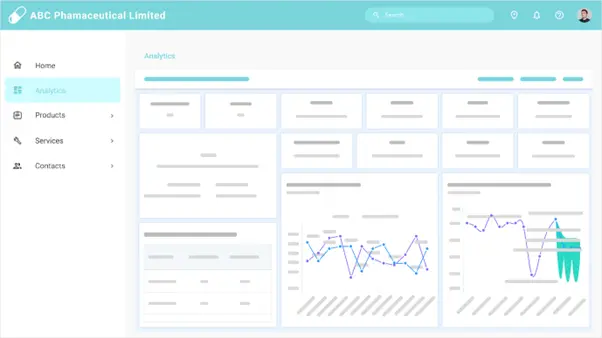
By following the previous steps, you can embed your dashboard into your Angular application.
To learn more about embedding dashboards into your Angular applications, refer to this blog. You can also download the sample code used in the previous steps from our documentation.
Application analytics with Bold BI
Bold BI helps uncover analytical insights in a straightforward way to help you make business decisions, such as altering time and resource management to improve business functions, identifying stages in workflows that can increase productivity, and more. Let me take you through some real-world cases of application analytics with Bold BI:
Retail dashboard example
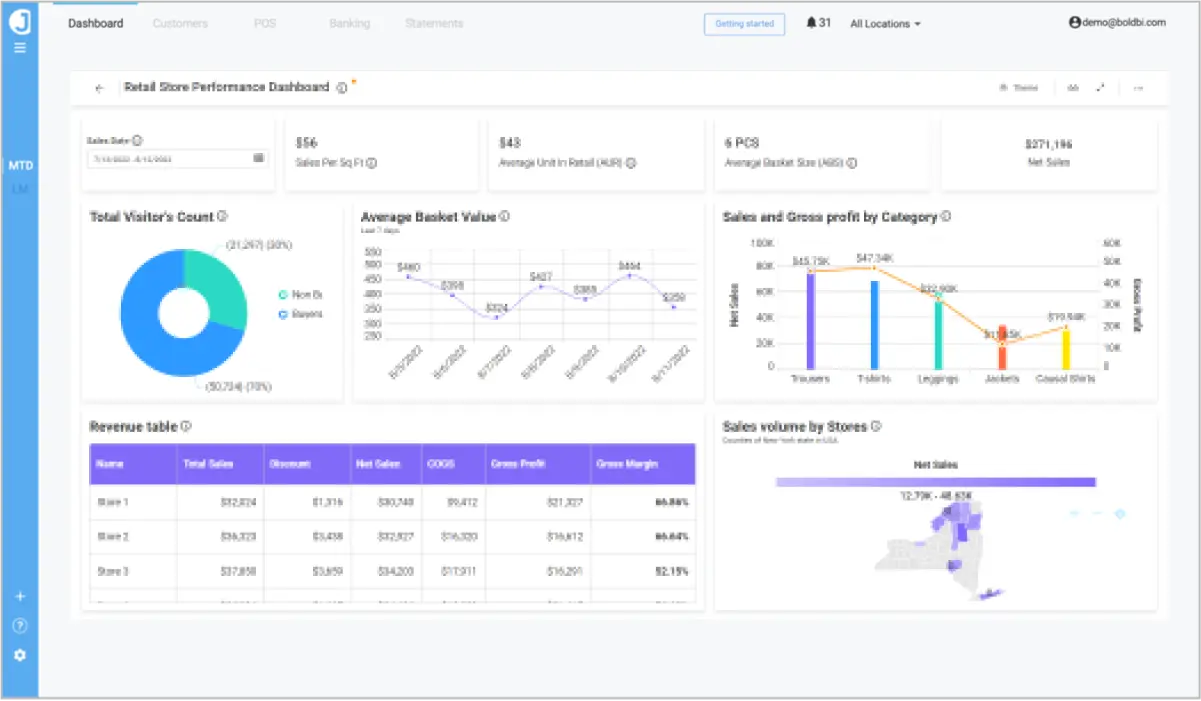
Retail Store Performance Dashboard
The Retail Store Perfor\mance Dashboard analyzes retail store sales using metrics such as sales data, total visitors, average basket value, and sales volume by store. It helps managers account for and audit the store’s sales flow.
Check out more of our interactive dashboards for retail.
Telecommunications dashboard example
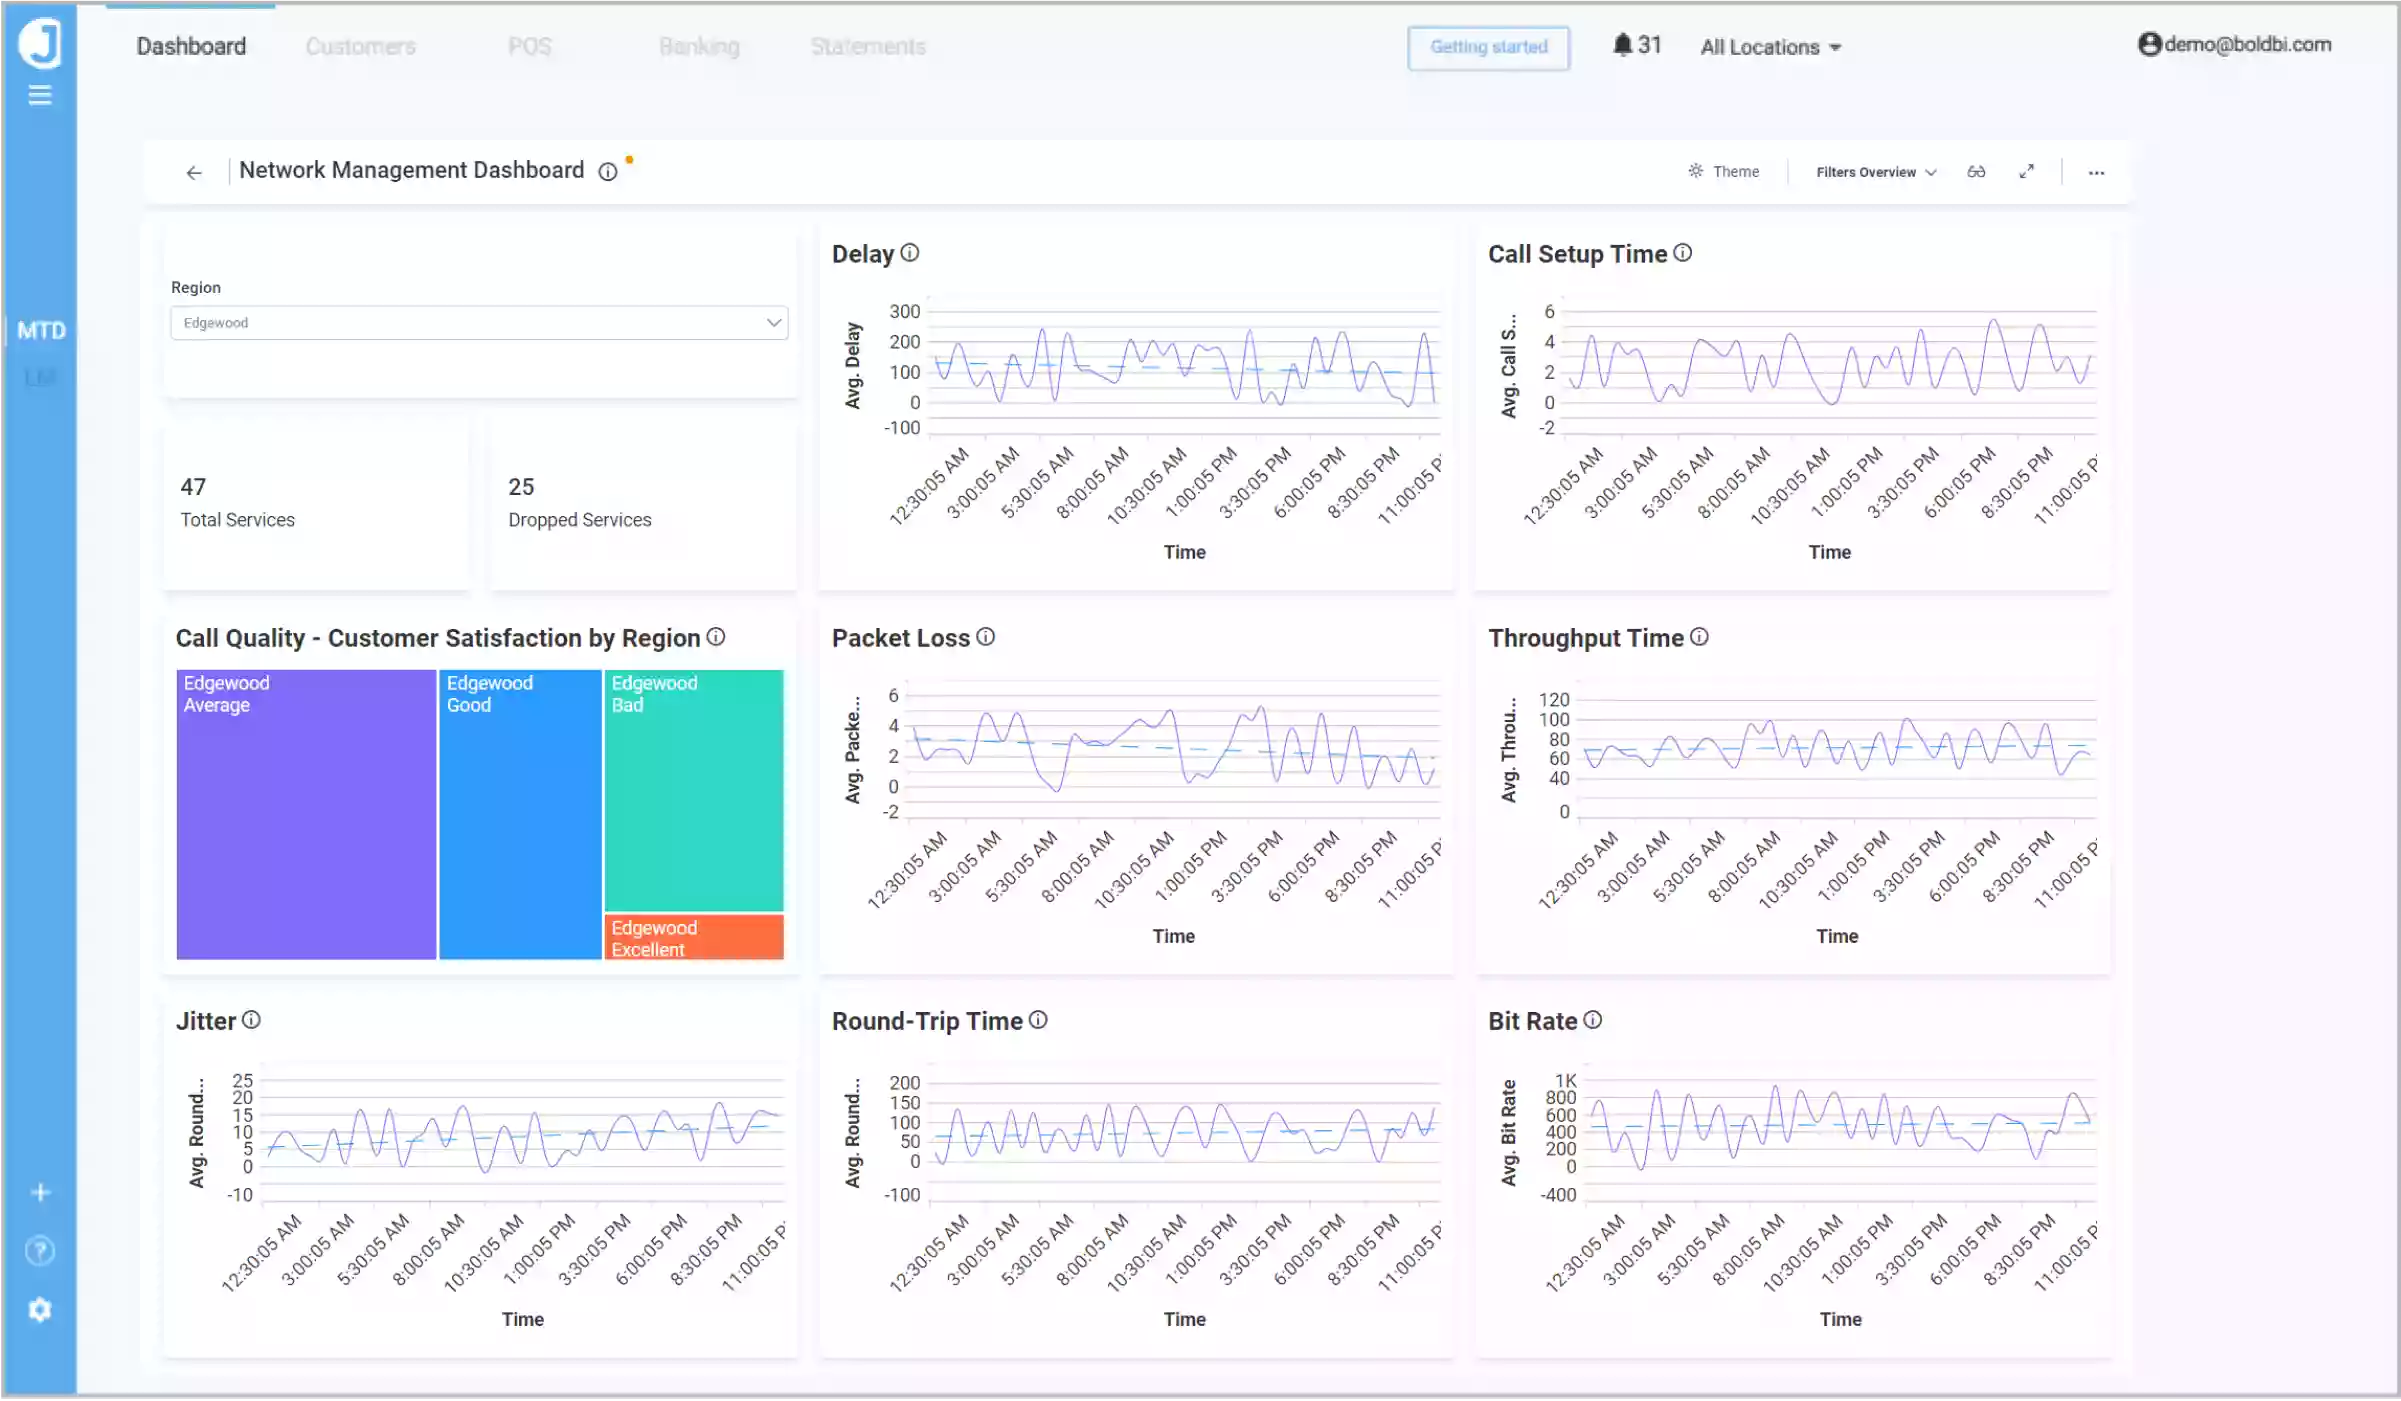
Network Monitoring Dashboard
The Network Monitoring Dashboard example showcases essential metrics for a telecom service company, such as dropped services, jitter, delay, call setup time, bit rate, packet loss, round-trip time, and throughput time.
Check out more of our interactive dashboards for telecommunications.
Agile management dashboard example
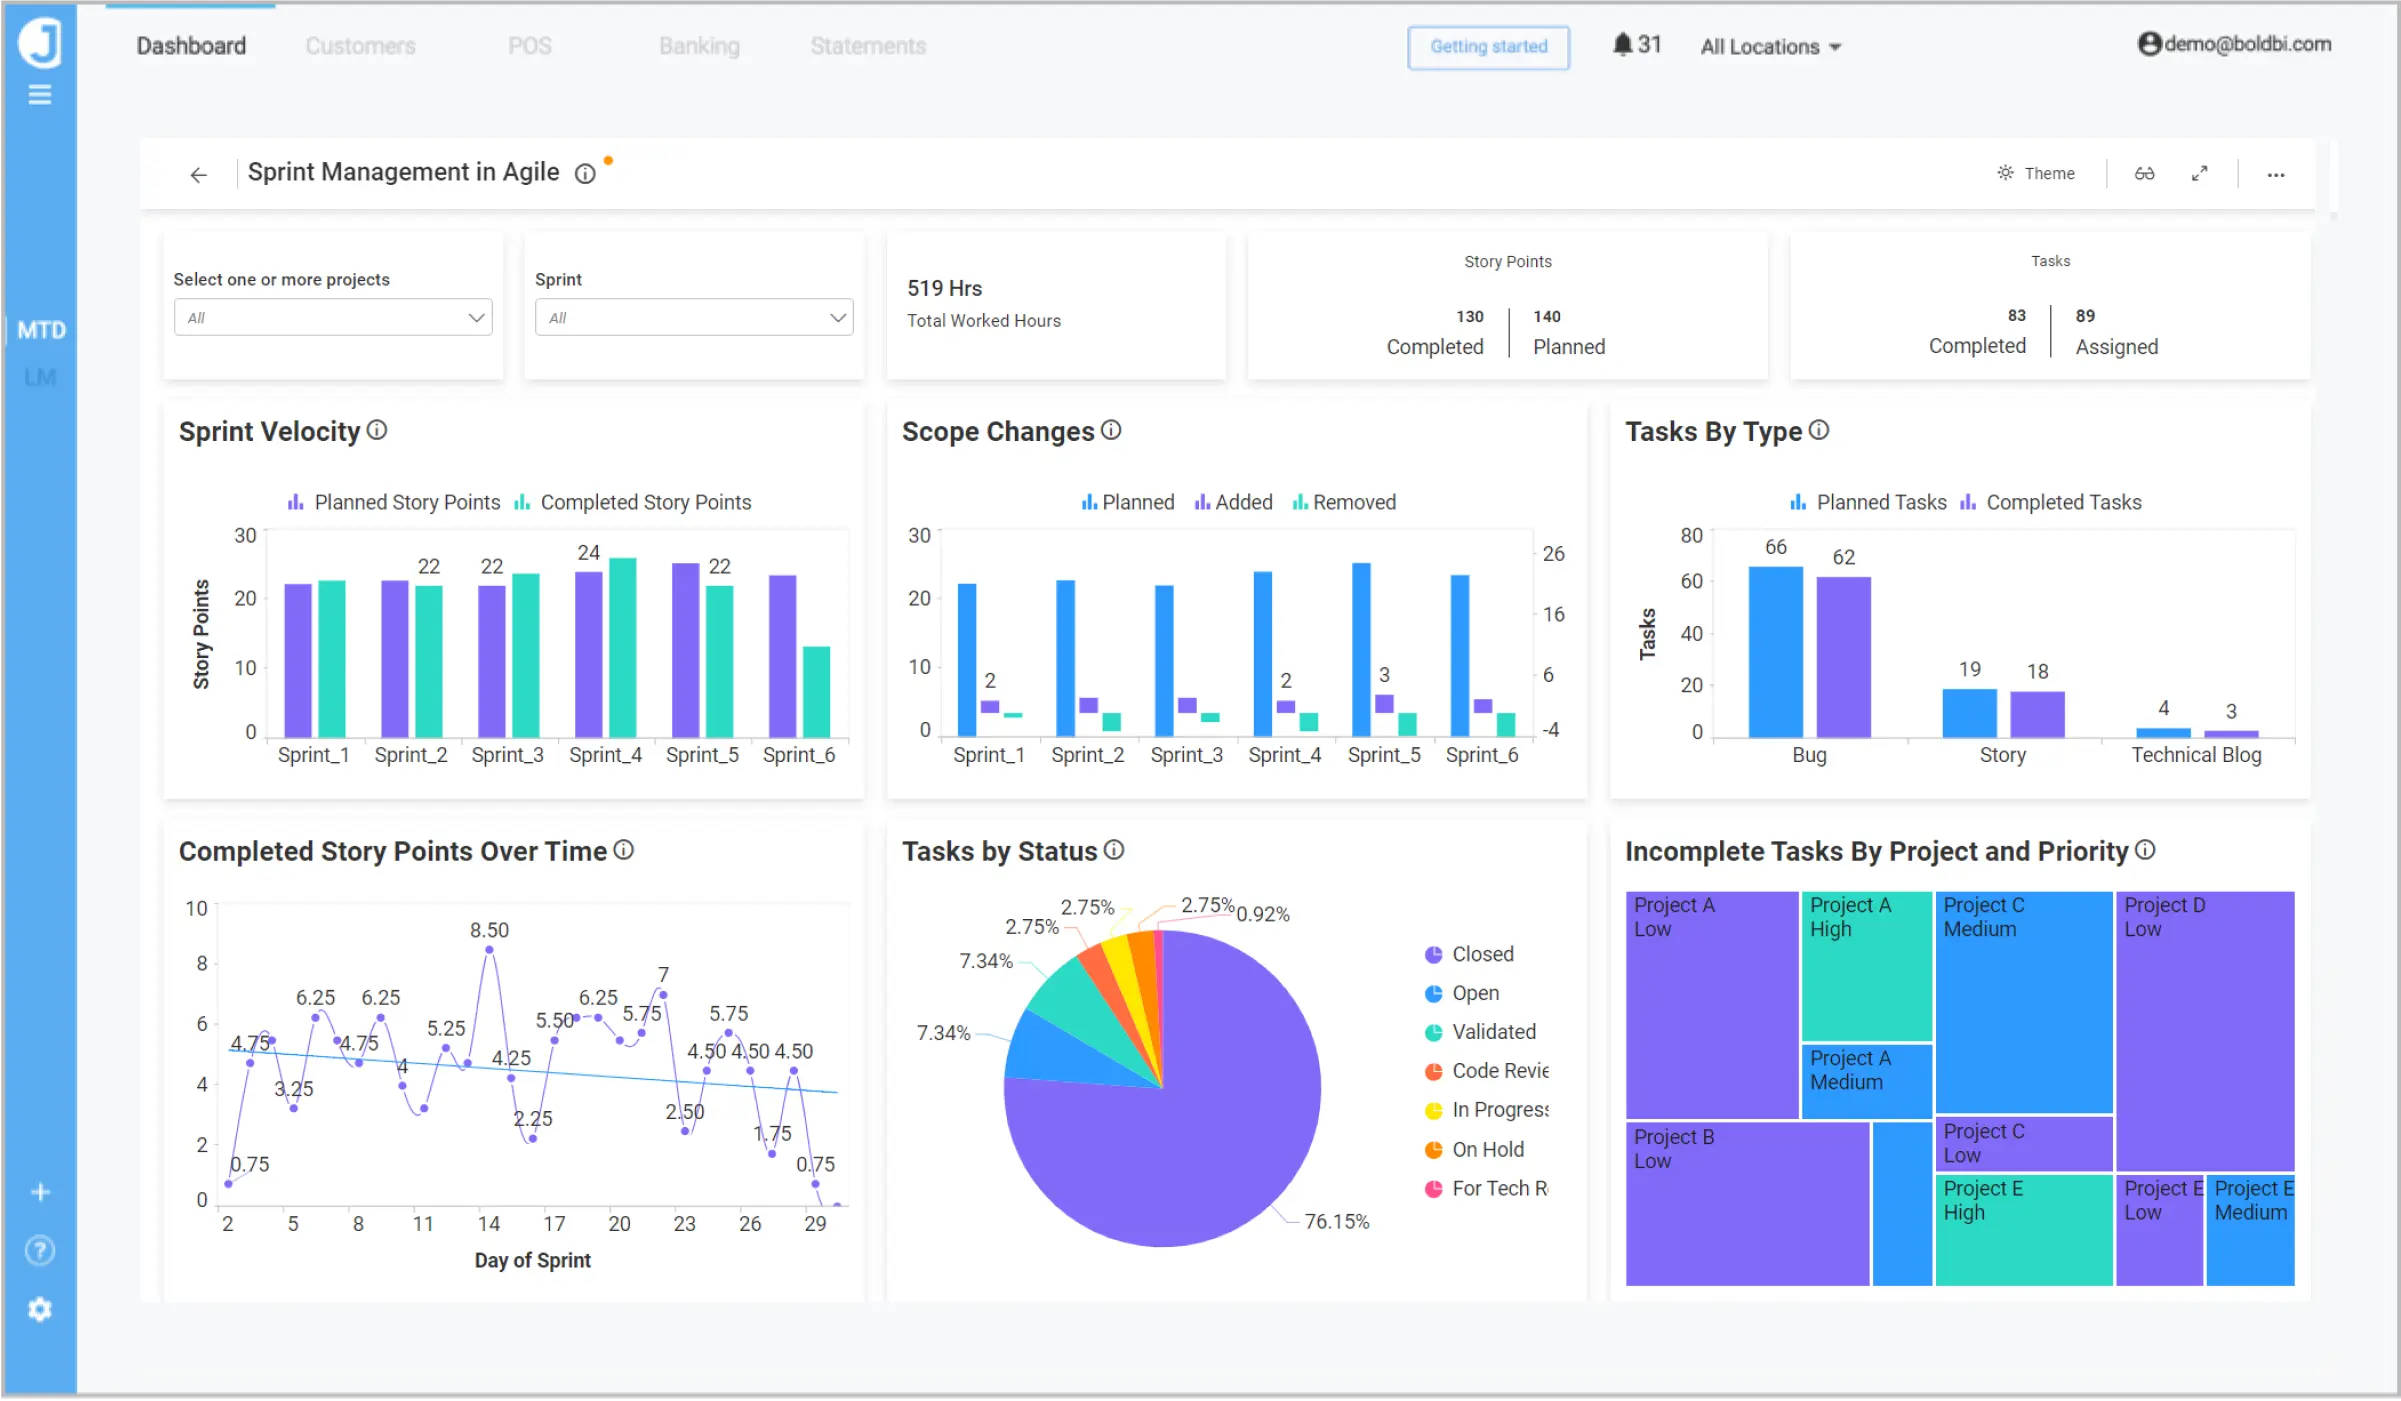
Sprint Management Dashboard
The Sprint Management dashboard tracks the daily operations of a development team completing a sprint.
Check out more of our interactive dashboards for agile management.
Pharmaceutical dashboard example
Pharmaceutical Labor Dashboard
The Pharmaceutical Labor Dashboard example provides summarized details about a pharmaceutical company’s labor management with metrics such as operation costs, labor costs, revenue and gross profit per prescription, work hours per job title, and prescription growth rate.
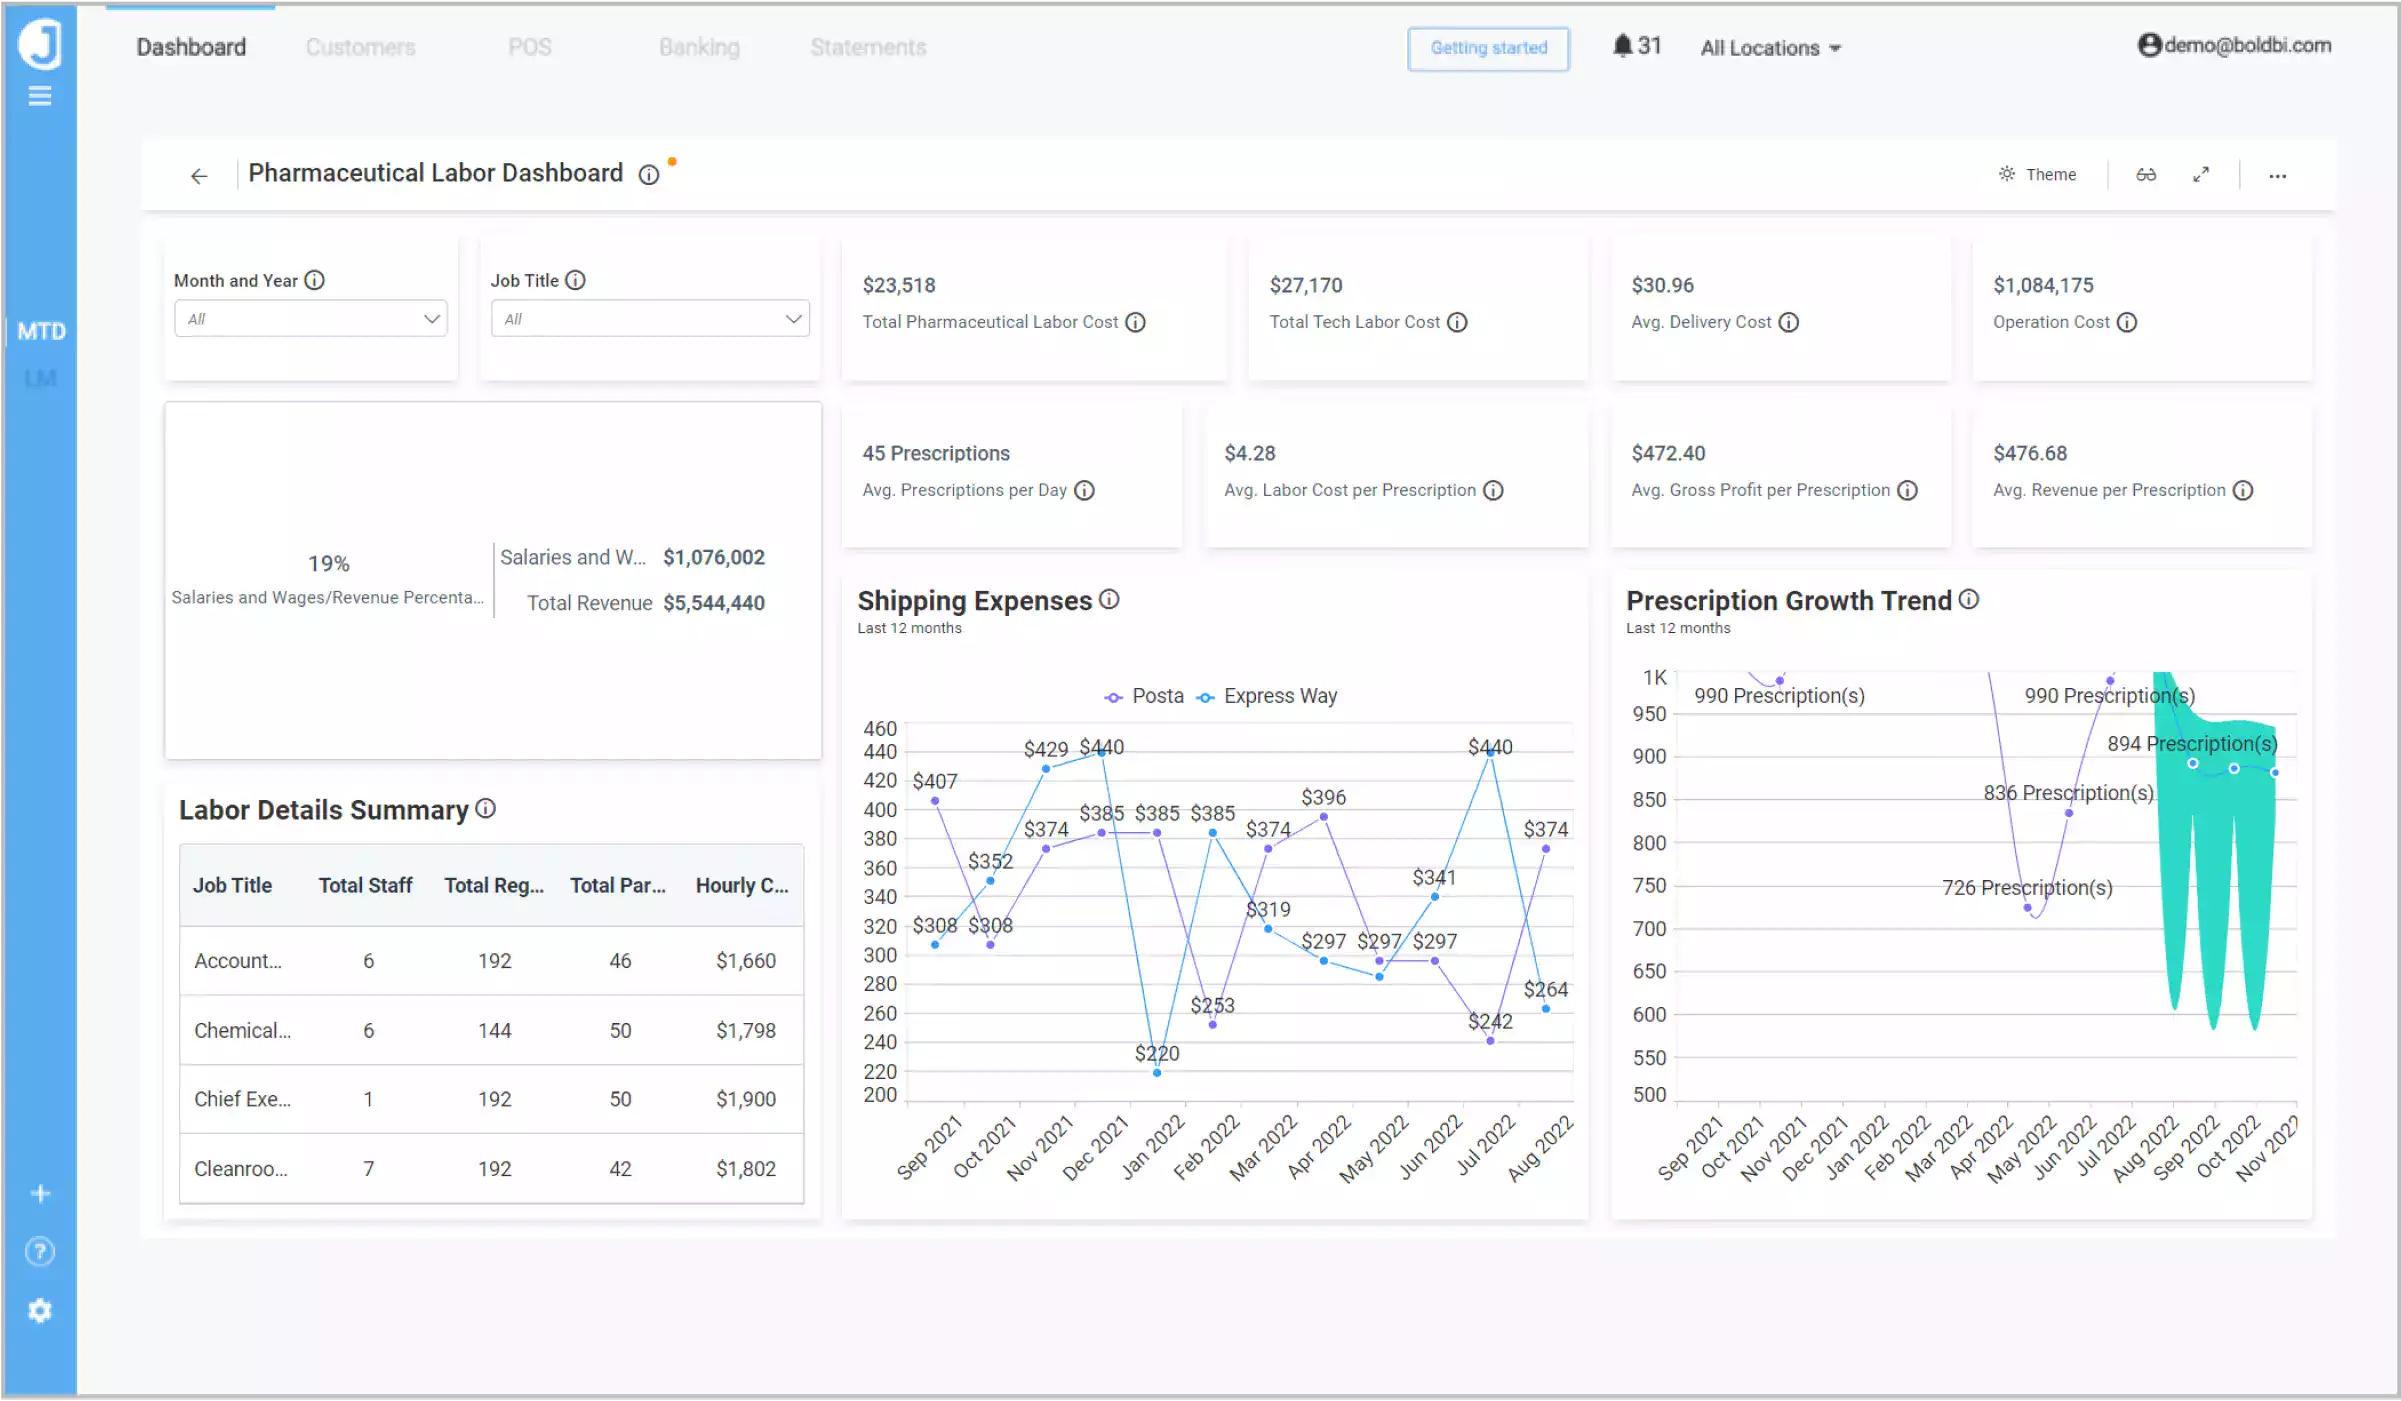
Check out more of our interactive dashboards for pharmaceutical companies.
You can explore more sample dashboards categorized by industry and department under the Solutions menu on the Bold BI home page.
Conclusion
I hope you now have a better understanding of application analytics, how it will benefit your business, and how to embed Bold BI® as an analytic tool.
Bold BI helps you visualize your data to see all your important metrics and KPIs in real time. It helps you integrate dashboards in your applications written in ASP.NET Core, ASP.NET MVC, ASP.NET, and Ruby on Rails. You’ll save time by avoiding redundant work. To learn more about embedding dashboards into your application, refer to this blog and our documentation. You can create a dashboard any way you like with Bold BI’s 35+ widgets and 150+ supported data sources.
You can contact us by submitting questions through the Bold BI website, or if you already have an account, you can log in to submit your support question. Get started with Bold BI by signing up for a free trial and create more business intelligence dashboards like the ones discussed above.





