Retail Stores Performance Analysis Dashboard
Understand store-level performance to improve sales and operational efficiency.
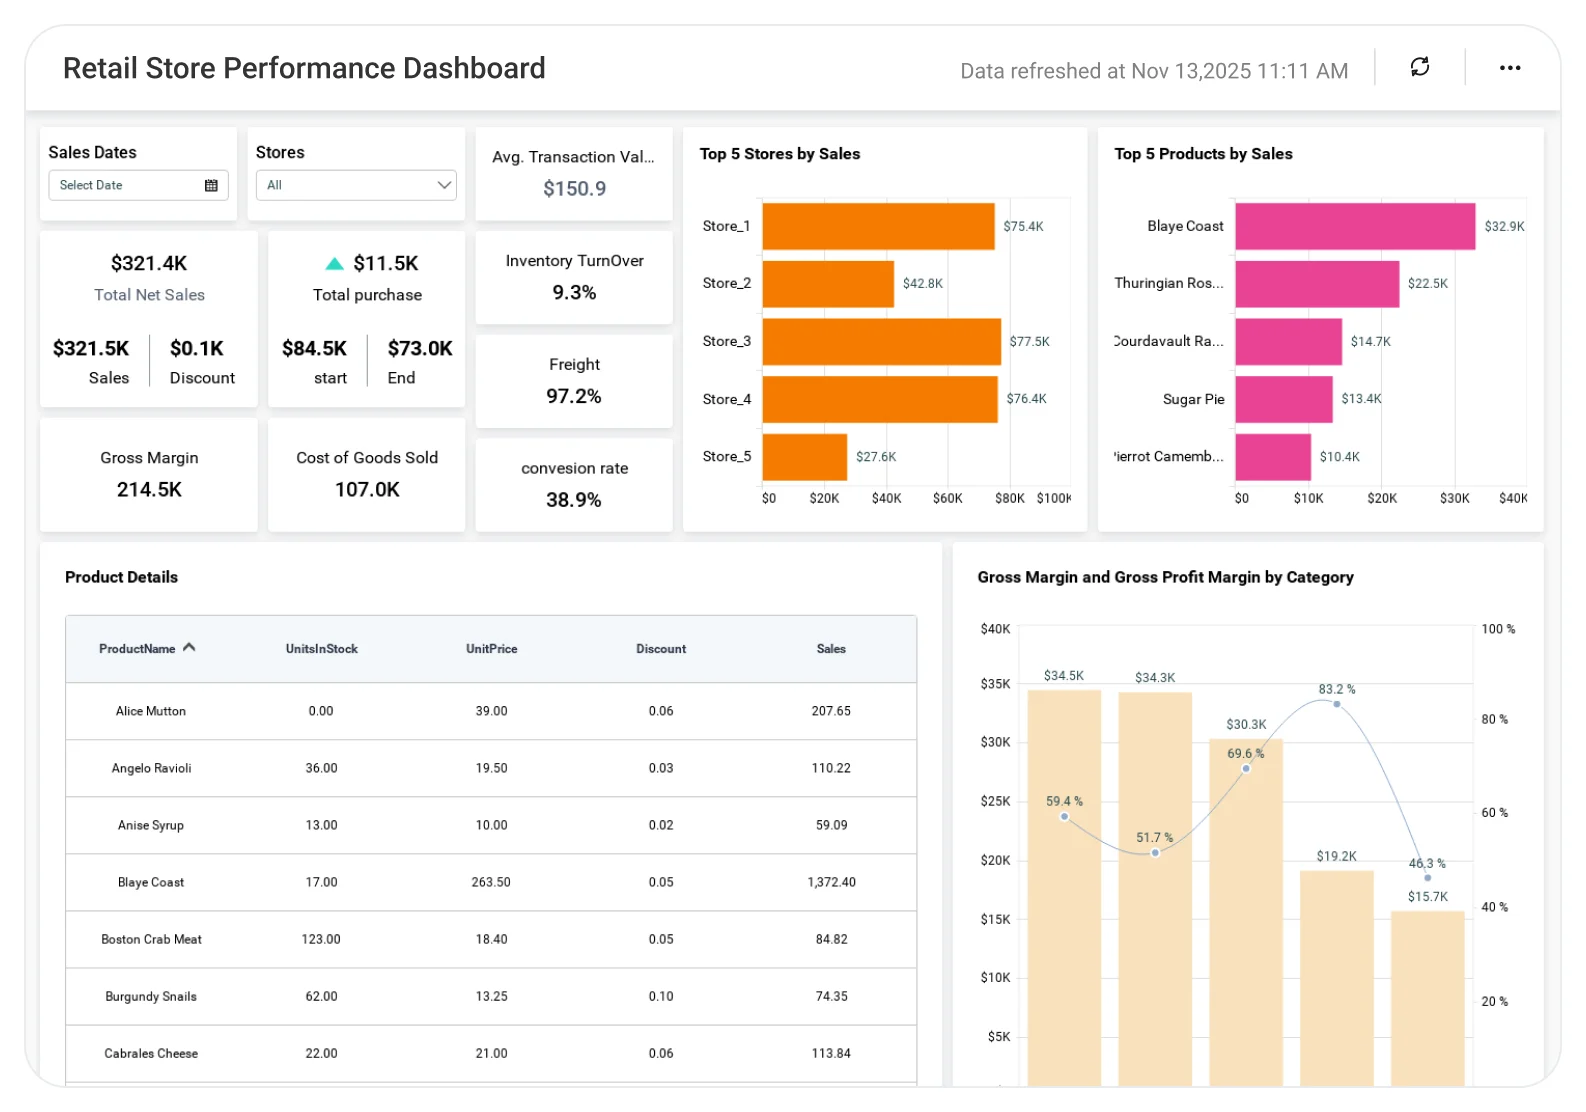
The Retail Stores Performance Dashboard helps teams analyze sales trends, store-wise performance, inventory movement, and customer activity, enabling better decision-making, optimized operations, and consistent retail growth.
TL;DR
-
Net sales and gross profits by store and county.
-
Buyer-to-visitor conversion insights. .
-
Store-level revenue, discounts, and Cost of Goods Sold (COGS).
-
Interactive maps and tables for quick drilldowns.
-
Basket metrics include average basket value (ABV), average basket size (ABS), and average units per receipt (ABR), all used for upsell analysis.
What is a Retail Stores Performance Dashboard? (30-second answer)
A Retail Stores Performance Dashboard is a visual analytics tool that tracks in-store sales, basket behavior, conversion rates, and profitability across multiple retail locations.
In Bold BI, this means interactive maps, tables, and KPIs that help teams monitor store performance over time and make data-driven retail decisions.
Why Retail Store Performance Dashboard Matters
Retail performance varies widely by location, product mix, and customer behavior.
Without a centralized dashboard:
-
High-traffic but low-profit stores go unnoticed.
-
Basket value stagnates despite strong footfall.
-
Discounting and COGS impact margins silently.
-
Store managers lack actionable, localized insights.
Bold BI provides a single, interactive view of store performance, enabling retail leaders and store managers to adjust pricing, promotions, and merchandising based on real data.
What You’ll Track
-
Store-level sales & profitability: Monitor net sales, gross profit margin, discounts, and COGS by store or county.
-
Product category profitability: Identify categories that deliver high profit even with lower sales volumes.
-
Basket metrics (ABV, ABS & ABR): Track average basket value, average basket size, and average units per receipt to measure upselling effectiveness.
-
Buyer-to-visitor conversion: Understand how many store visitors convert into buyers and how this varies by location.
-
Time-based sales trends: Analyze performance by day, week, or custom date range using the Sales Date filter.
-
Store ranking & performance comparison: Rank stores by revenue and profit margin to identify top and underperforming locations.
All dashboards are fully customizable, allowing you to add KPIs or metrics as needed.
How It Works
-
Apply the Retail Stores Performance Analysis Dashboard sample.
-
Filter performance by date, county, or individual store.
-
Drill down using interactive maps and revenue tables.
-
Share customized views with retail leaders and store managers.
Why Bold BI is the Right Fit for Retail Stores Analytics
-
Unified retail performance view: Analyze sales, basket metrics, and profitability across stores, counties, and periods in one dashboard.
-
Store-level drilldowns: Drill down from statewide or regional performance to individual stores and product categories.
-
Basket & pricing insights: Track basket value, cross-sell opportunities, and promotion impact to improve margins.
-
Location-based analysis: Use interactive maps and tables to compare performance by store or location.
-
Role-based access & sharing: Share filtered, role-specific views with store managers and leadership teams securely.
Compare Options (at a glance)
| Feature | Bold BI | POS Reports | Spreadsheets |
| Store-level performance | Yes | Partial | Manual |
| Basket analytics | Yes | Limited | Manual |
| Interactive drilldowns | Yes | No | No |
| Role-based views | Yes | No | Manual |
| Deployment | Cloud / self-hosted | SaaS only | Local |
Frequently Asked Questions
More Articles About Retail Store Performance
-
Maximize Retail Store Sales with Embedded Analytics
This blog explains how embedded analytics helps retailers boost sales by integrating real-time dashboards into daily operations. Learn how Bold BI enables tracking of sales trends, inventory levels, and customer behavior to make data-driven decisions that improve profitability.
-
How Data Dashboards Simplify Business Decisions
This blog explores how interactive dashboards transform complex retail data into actionable insights. Discover how Bold BI visualizations help store managers and executives monitor KPIs, identify patterns, and make faster, smarter decisions to stay competitive in the market.
-
15 Essential KPI Dashboard Examples for Your Business
This blog highlights fifteen powerful KPI dashboard examples designed for retail and other industries. It serves as a guide for selecting and implementing dashboards that improve efficiency, enhance transparency, and support strategic growth.
