Industry : Telecommunications

Network Performance Monitoring

Understand network performance to improve reliability and service quality.

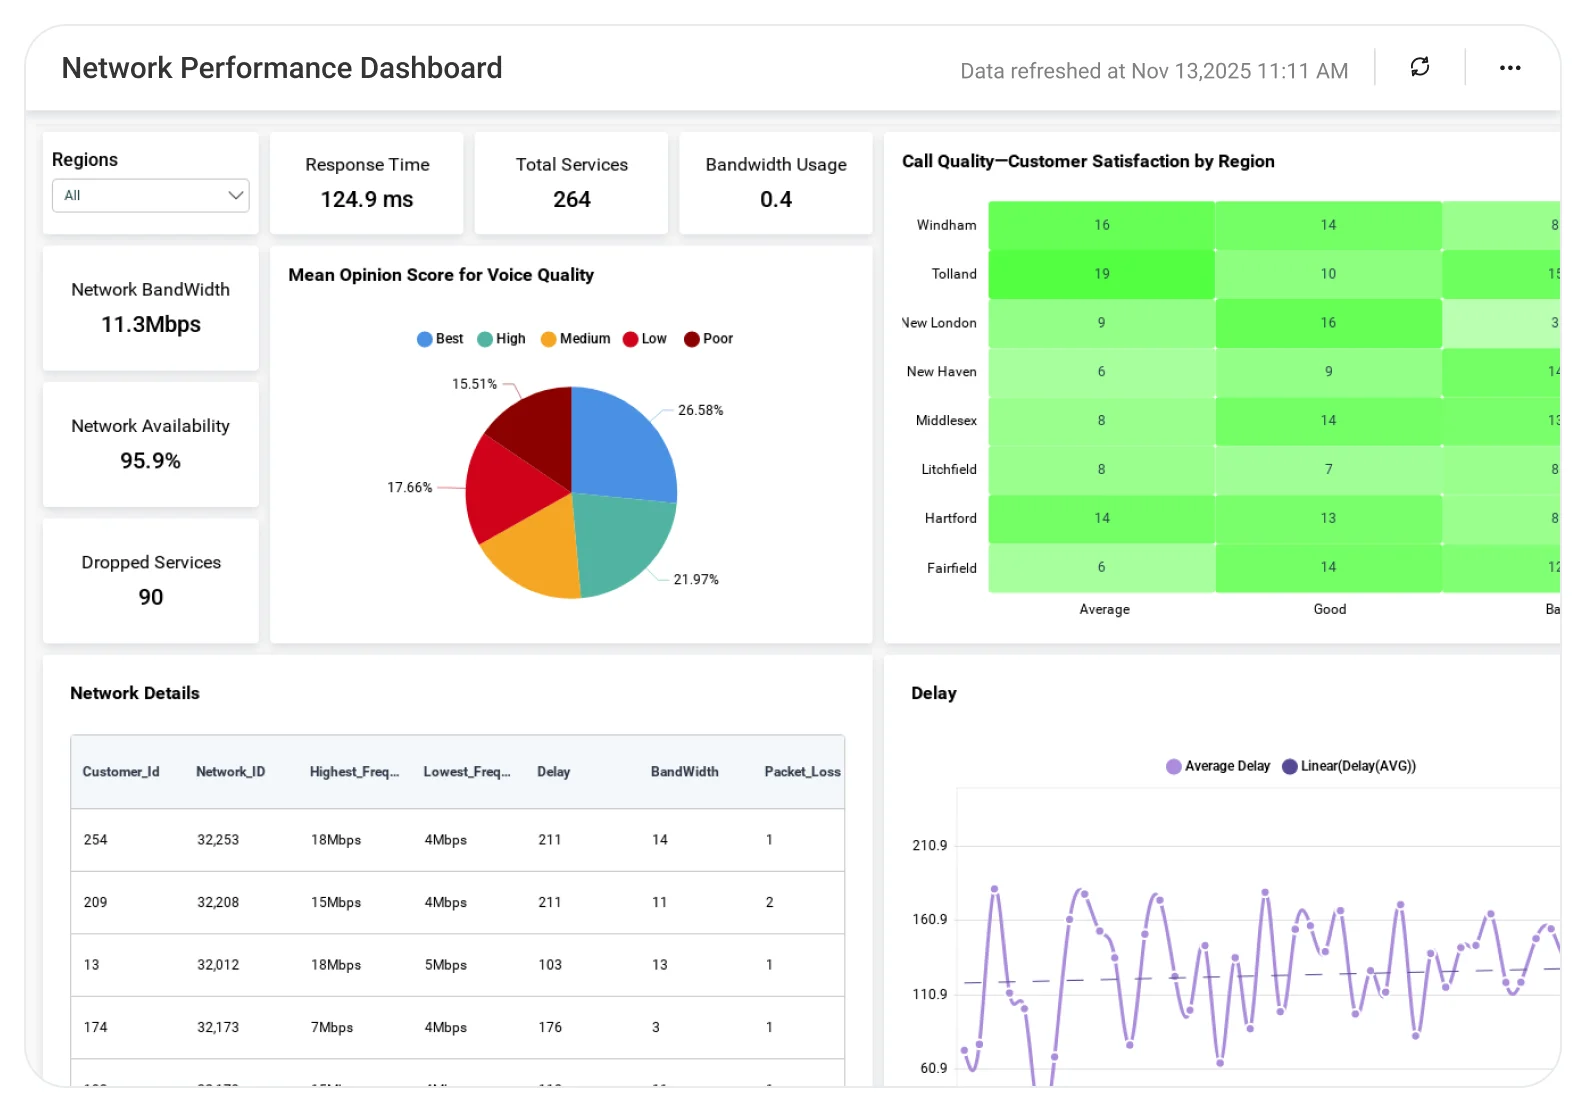
The Network Performance Dashboard helps telecom teams analyze latency, downtime, traffic patterns, and performance issues, enabling faster issue resolution, better capacity planning, and more reliable network operations.

TL;DR

  • Dropped vs. successful call metrics.
  • Customer satisfaction ratings by region.
  • Key network KPIs: call setup time, delay, and bit rate.
  • Region-based performance comparisons.
  • Executive-ready network health summaries.

What Is a Network Performance Monitoring Dashboard?

A Network Performance Monitoring Dashboard displays key telecom metrics such as dropped calls, call success rates, and customer satisfaction in one place, making it easier to diagnose issues and prioritize fixes.

In Bold BI, this becomes an interactive dashboard that combines operational and customer experience data, automatically updates, and allows filtering by region.

Why Network Performance Monitoring Dashboard Matters

Telecom networks operate on a massive scale. Even small performance issues can quickly lead to customer churn and revenue loss.

Without centralized visibility:

  • Dropped calls go unnoticed until complaints rise.
  • Regional performance issues are hard to isolate.
  • Network KPIs are scattered across tools.
  • Decisions become reactive instead of proactive.

Bold BI centralizes call quality, network KPIs, and customer satisfaction metrics into a single dashboard, so telecom teams can spot issues and act faster.

What You’ll Track

Using Bold BI dashboards, you will track important project overview KPIs such as:

  • Dropped calls & call success rates: Track total calls, dropped calls, and success percentages by region and overall.
  • Customer satisfaction metrics: Analyze customer feedback ratings, bad, average, good, and excellent, by service region.
  • Core network performance KPIs: Monitor call setup time, delay, and bit rate to assess network efficiency and quality.
  • Regional performance comparisons: Filter and compare telecom KPIs across regions to identify underperforming areas.

All dashboards are fully customizable, allowing you to add KPIs or metrics as needed.

How It Works

  • Connect network monitoring systems, CSV, or Excel/SQL databases.
  • Apply the Network Performance Monitoring Dashboard sample.
  • Filter metrics by region using interactive controls.
  • Blend customer experience and network performance data.
  • Share role-based dashboards across operations and leadership teams

Why Bold BI Is the Right Fit for Network Performance Analytics

  • Unified network & customer insights: Track dropped calls, call success rates, and customer satisfaction in one dashboard.
  • Regional performance visibility: Compare network performance across regions to quickly identify problem areas.
  • Actionable reliability insights: Spot failure patterns early and focus upgrades where performance gaps exist.
  • Secure sharing & embedding: Embed dashboards into internal telecom portals or NOC tools with role-based access.
  • Flexible deployment: Deploy dashboards in the cloud or self-hosted environments to meet telecom requirements.

Compare Options (at a glance)

Feature  Bold BI  Network Tools  Spreadsheets 
Dropped call analysis  Yes  Partial  Manual 
Customer satisfaction tracking  Yes  No  Manual 
Regional filtering  Interactive  Limited  Manual 
KPI visualization  Real-time  Tool-specific  Static 
Deployment  Cloud / self-hosted  On-prem only  Local 

Frequently Asked Questions

Yes. Interactive region filters allow quick comparisons between regions or an overall network view.
Yes. Customer ratings are displayed alongside technical network KPIs.
Yes. KPIs such as call setup time and delay can be compared across regions and against benchmarks.
Absolutely. Add or modify KPIs, filters, and widgets to match your network monitoring needs.
Yes. Real-time alerts and performance trends help detect anomalies and outages early. This enables faster troubleshooting and reduced service downtime.
Yes. Bold BI supports secure embedding into NOC systems, portals, and internal telecom applications.

Compare Options (at a glance)

Feature  Bold BI  Network Tools  Spreadsheets 
Dropped call analysis  Yes  Partial  Manual 
Customer satisfaction tracking  Yes  No  Manual 
Regional filtering  Interactive  Limited  Manual 
KPI visualization  Real-time  Tool-specific  Static 
Deployment  Cloud / self-hosted  On-prem only  Local 

Simple Pricing That Grows With You

Say goodbye to hidden costs, complex quotes, and pricing guesswork. 

Trusted by Users. Recognized by Experts.

Don't take our word for it

Here are a few kind words from some of our happy customers.

Software Advice

Frequently Asked Questions

Yes. Interactive region filters allow quick comparisons between regions or an overall network view.
Yes. Customer ratings are displayed alongside technical network KPIs.
Yes. KPIs such as call setup time and delay can be compared across regions and against benchmarks.
Absolutely. Add or modify KPIs, filters, and widgets to match your network monitoring needs.
Yes. Real-time alerts and performance trends help detect anomalies and outages early. This enables faster troubleshooting and reduced service downtime.
Yes. Bold BI supports secure embedding into NOC systems, portals, and internal telecom applications.

Start your 30-day free trial instantly

Easy integration, AI-Powered Dashboards and 24x5 real-time support.