AI Copilot · Dashboard Designer

Charts in Seconds, Not Sprints

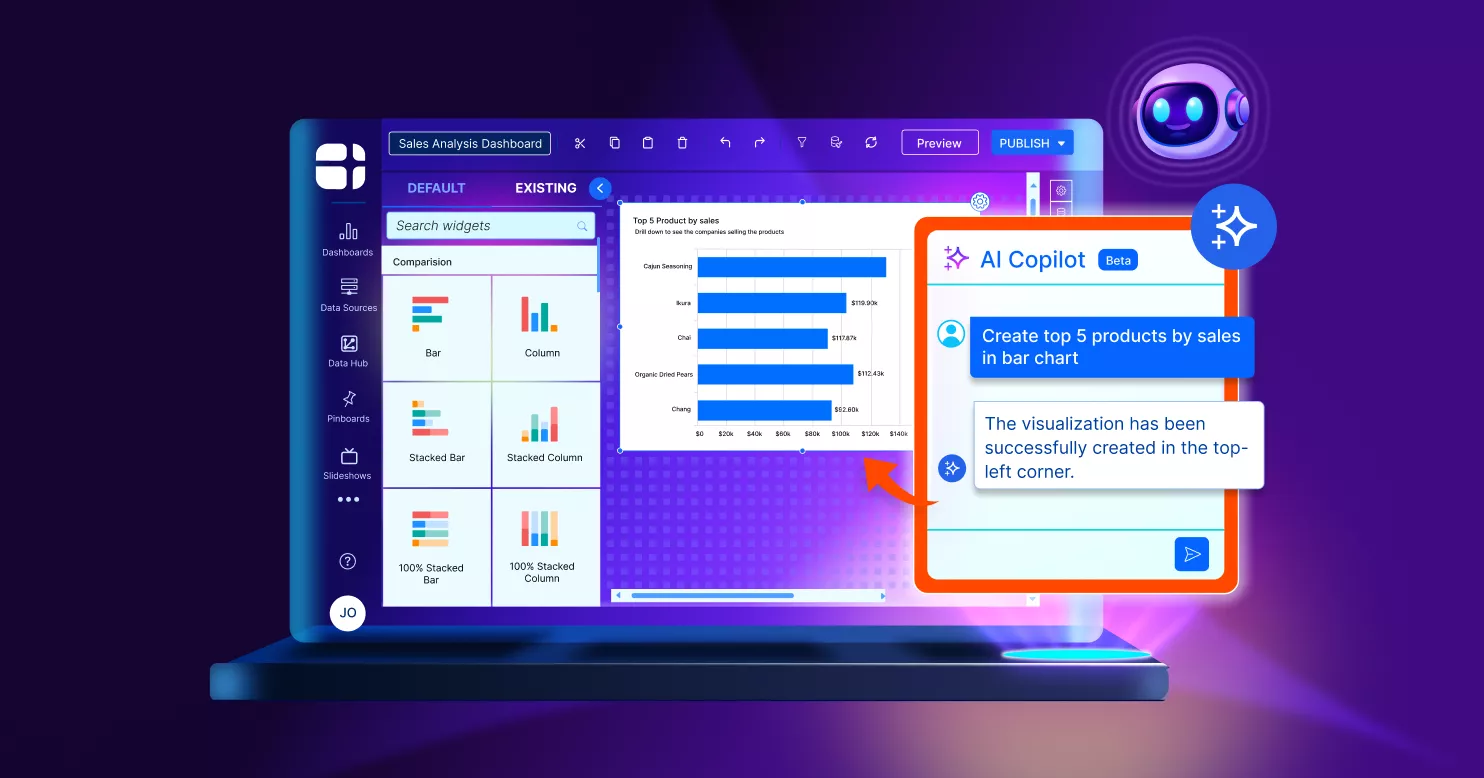
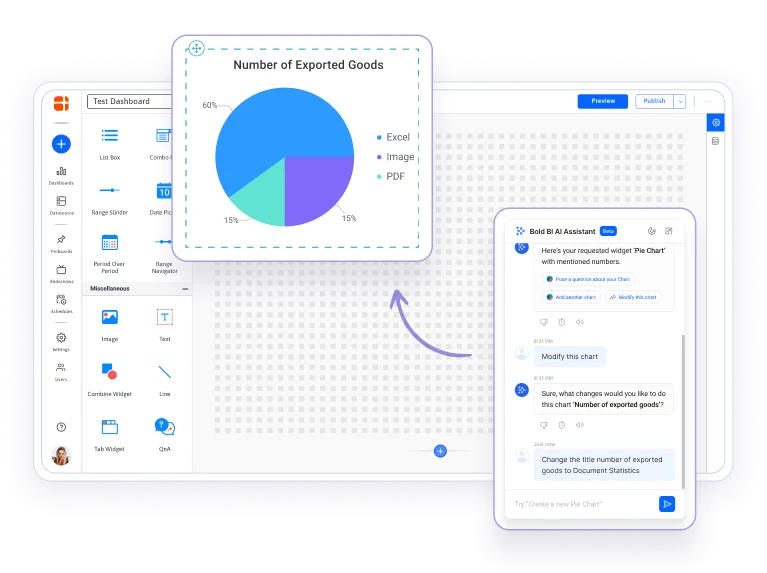
Stop waiting on a developer for every new chart. Tell Bold BI AI Copilot what you want to see, and it's on screen — built from your live data, right inside the Dashboard Designer. Then edit it by asking, or by hand, like any other widget.

AI Copilot Banner
Trusted by leading companies

Syscon

Networxc

A4B

DigiQuip

CarNow

Revver

Smartway2

GeniusVets

Talentegy

How it works

Three steps from question to widget

Copilot sits in the Dashboard Designer you already use. Ask, review what it builds, then keep refining — by prompt or by hand.

01

Ask

Type what you want in plain English — a chart, a comparison, a KPI. No SQL, no field-dragging.

02

AI Copilot builds the widget

It reads your connected data, picks a fitting chart type, and drops the visual straight onto your dashboard canvas.

03

Refine

Everything it creates is a normal, editable Bold BI object. Adjust the chart type, filters, colors, or fields by asking again — or by hand. Follow-ups build on each other.

Note Icon

Want a whole dashboard from one sentence — not one chart at a time?  That's Prompt to Dashboard, a generation workflow within the AI Assistant. Copilot is for building and refining individual visuals.

Capabilities

What AI Copilot does

Four things it handles inside the Designer — building visuals, editing them by description, holding context across a thread, and reading your schema for business terms.

Create visuals from a prompt

Create visuals from a prompt

Describe a chart and AI Copilot builds it — no SQL, no manual configuration.

Edit visuals by description

Edit visuals by description

"Make it a stacked bar chart in our brand colors" — updated in place, no re-dragging fields.

Iterate in one conversation

Iterate in one conversation

Copilot considers your recent requests, so "now group it by region" continues the thread.

Understand business language

Understand business language

Uses schema context to interpret business terminology; clear field names and explicit column references improve accuracy.

Good to know

Good to know: Copilot builds visuals from your data's schema (table and column names and types) — no raw rows are sent to the model for visual generation. Supported aggregations are COUNT, distinct COUNT, SUM, MIN, MAX, and AVG; functions like median or variance aren't supported yet. Some visual types and customizations aren't generated automatically and are done manually in the Designer.

Examples

Real prompts, real results

Three requests a business user would actually type, and what lands on the canvas.

YOU TYPE AI COPILOT DOES
"Show me monthly churn rate by customer segment for the last 12 months." Builds a line chart segmented by customer tier, using your connected data.
"Change this to a stacked bar chart, group by region, and use our brand colors." Updates chart type, grouping, and color scheme in place.
"Add a column chart of average deal size by sales stage." Generates the widget on your canvas, ready to refine or reposition.

No credit card required.

Embedding

Bring AI Copilot into your application, fully white-labeled

Embed the AI Assistant experience into your own app with the Bold BI embedded SDK. The embed token is generated on your server; standalone AI Assistant embedding requires Bold BI 14.1 or later.

Copy to clipboard
import { BoldBI } from '@boldbi/boldbi-embedded-sdk';

const assistant = BoldBI.create({
  serverUrl,
  mode: BoldBI.Mode.AIAssistant,
  embedContainerId: 'ai-assistant',
  embedToken // generated on your server
});

assistant.loadAIAssistant();
Security & governance

AI Copilot runs inside your existing security & governance model

No separate permission layer to configure. Copilot inherits the controls your instance already enforces.

User
User
Permissions check
Permissions check
AI Copilot
AI Copilot
Data source
Data source

The permission check happens before the AI response is generated — not after. For visual generation, only schema metadata leaves your instance.

FAQ

Frequently asked questions

AI Copilot grounds generated visuals in your connected data source rather than general knowledge, which reduces invented values — but it can still make incorrect field, filter, or aggregation choices, or produce ambiguous summaries. Review the selected fields, filters, aggregations, and summaries before relying on a generated visual. Every AI-created visual stays fully editable.

Yes. AI-generated visuals are standard, editable Bold BI objects — adjust chart type, filters, colors, or data fields exactly as you would with anything built manually.

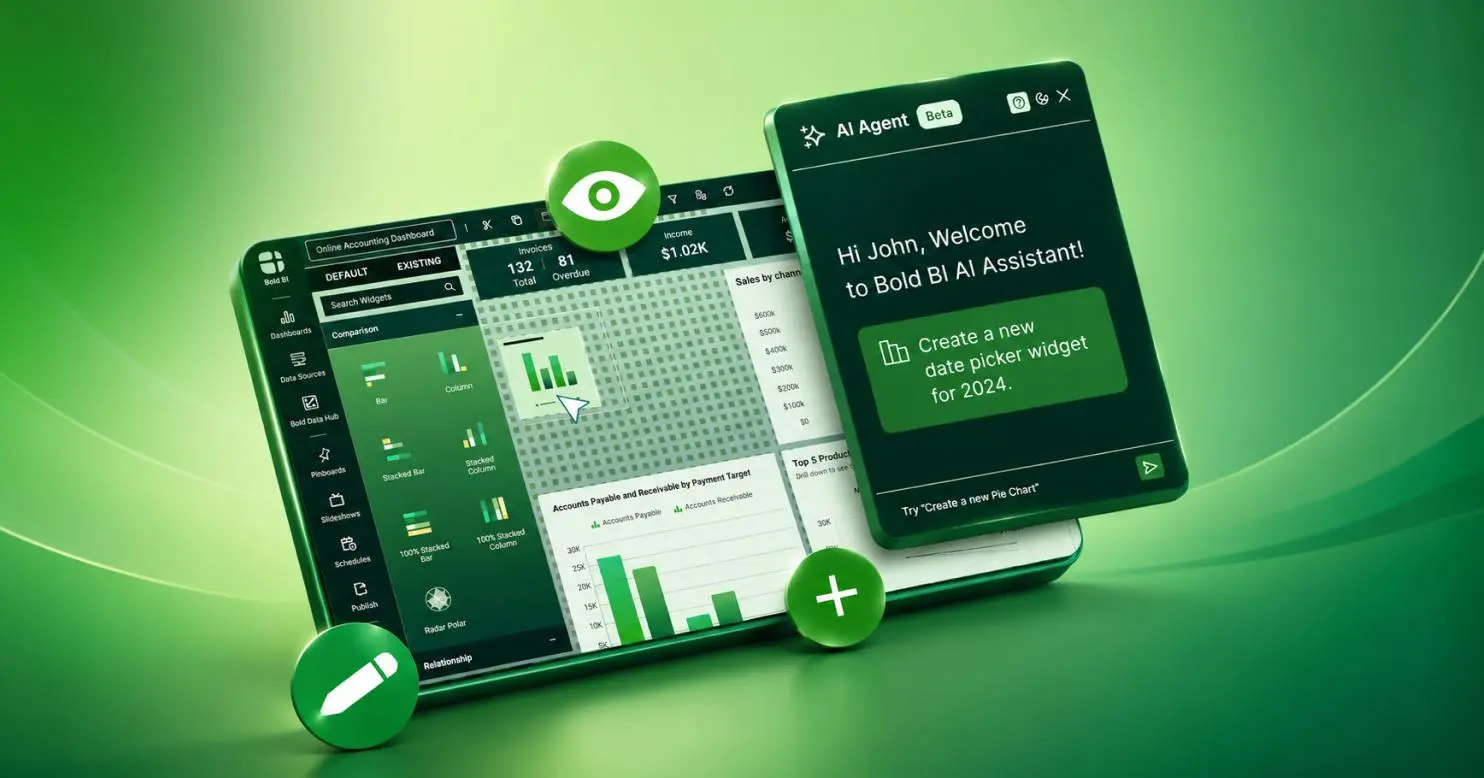
Three related tools within Bold BI’s AI Assistant, three different jobs: AI Copilot (Dashboard Designer) creates and edits individual visuals by request. AI Agent (Dashboard Viewer) answers questions about data on a live dashboard — read-only. Prompt to Dashboard generates a full starter dashboard from a single prompt on a blank canvas.

It uses your schema as context to interpret business terms. Accuracy improves when table and column names are clear; you can also reference the actual column explicitly if a term isn’t resolved as expected.

COUNT, distinct COUNT, SUM, MIN, MAX, and AVG aggregations. More advanced statistics (median, variance, percentiles) aren’t supported yet — build those manually.

Yes — Bring Your Own Key supports OpenAI and Azure OpenAI; Anthropic Claude BYOK requires Bold BI v16.1.90 or later.

Yes — cloud, on-premises, Docker, and Kubernetes, and it can be embedded via the Bold BI embedded SDK with full white-labeling (Bold BI 14.1+ for standalone AI Assistant embedding).

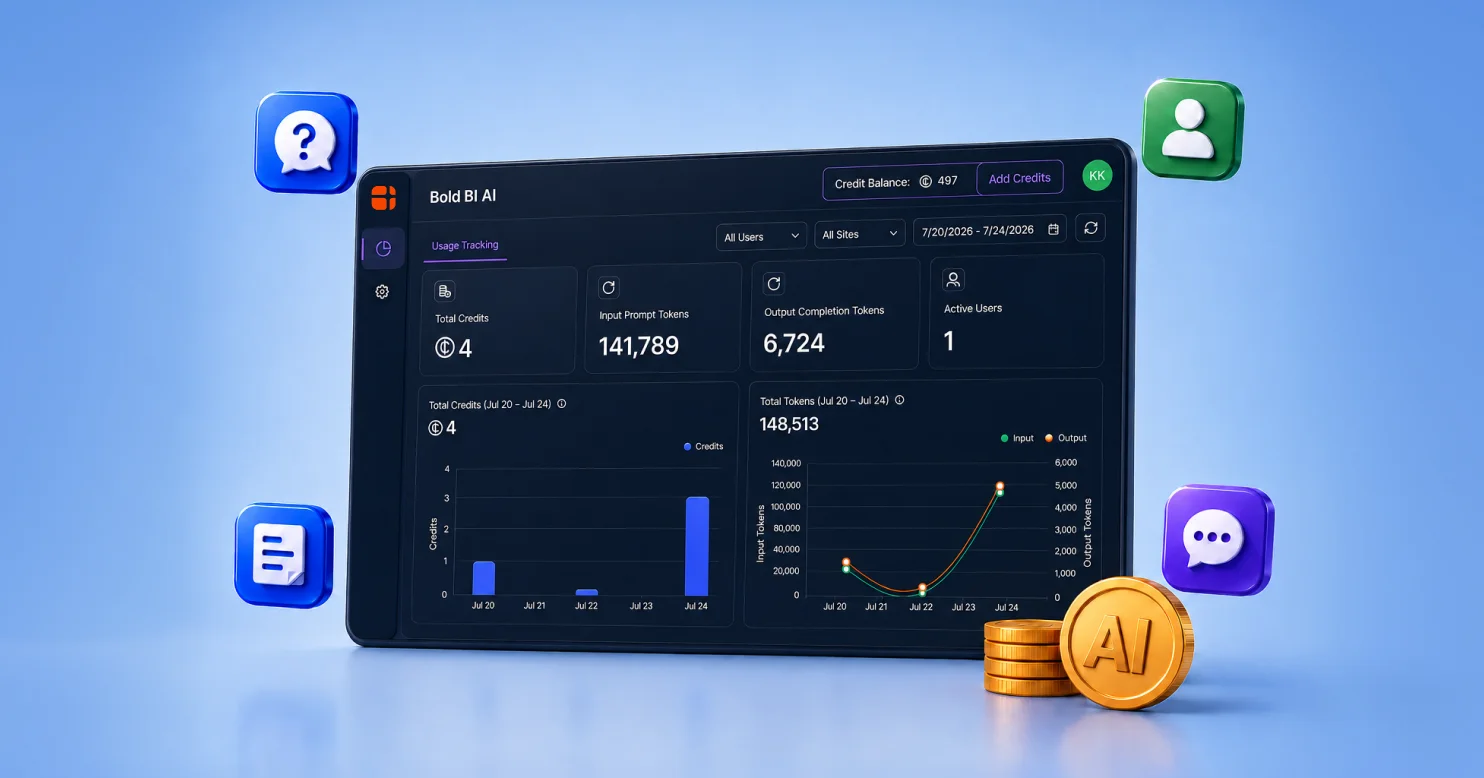
AI usage is managed at the subscription-license level. Administrators can monitor consumption and review usage by supported dimensions, and manage the shared credit balance.

Ready to get started

Let AI Copilot handle the first draft

140+ data connectors · Cloud, on-premises, Docker, or Kubernetes deployment.