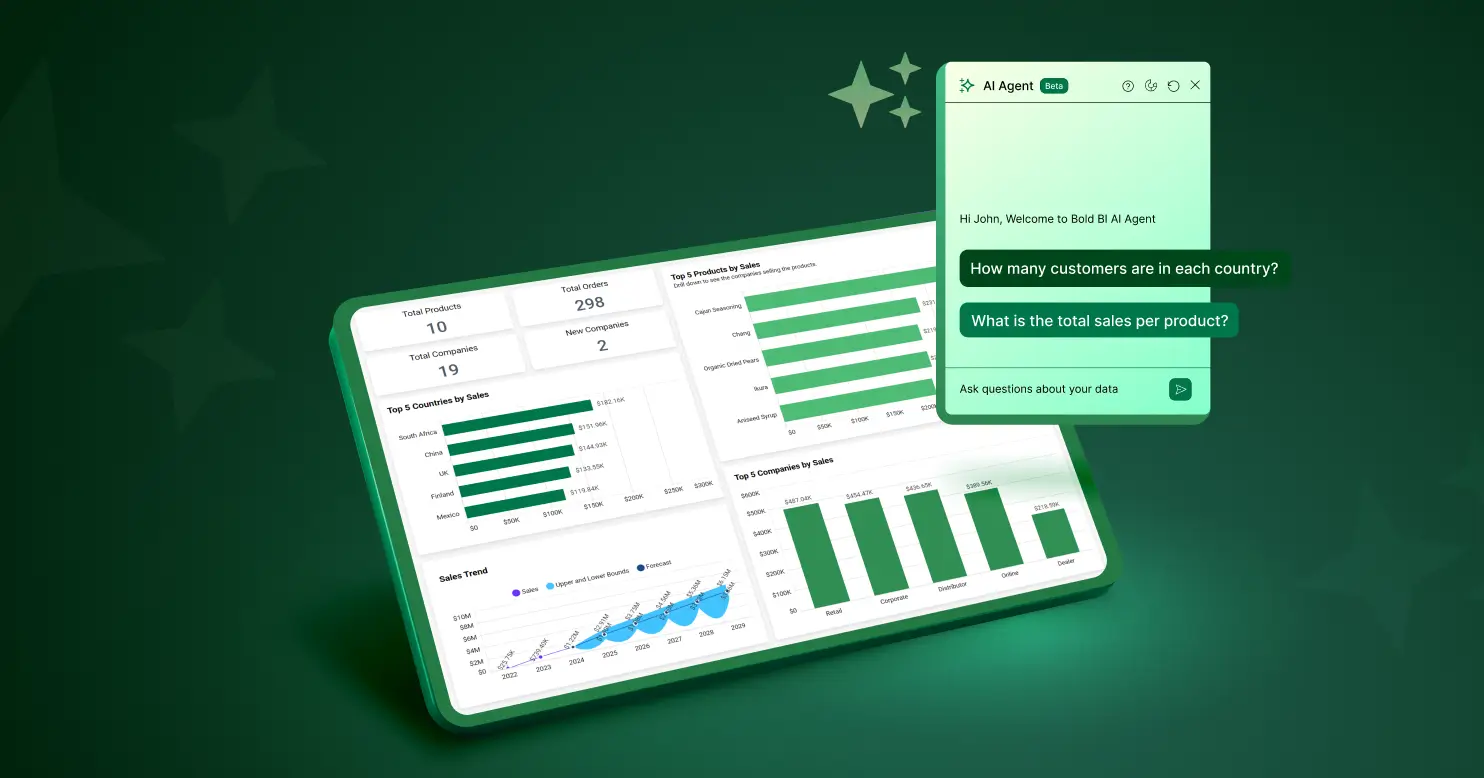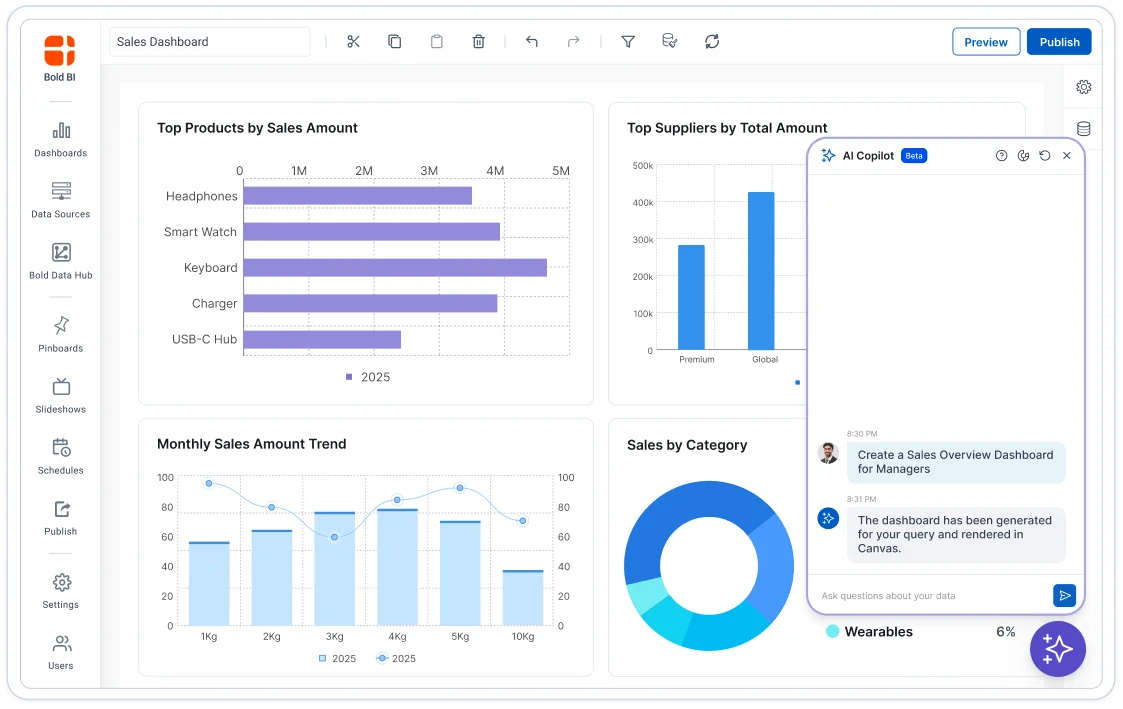
From prompt to dashboard. Instantly.
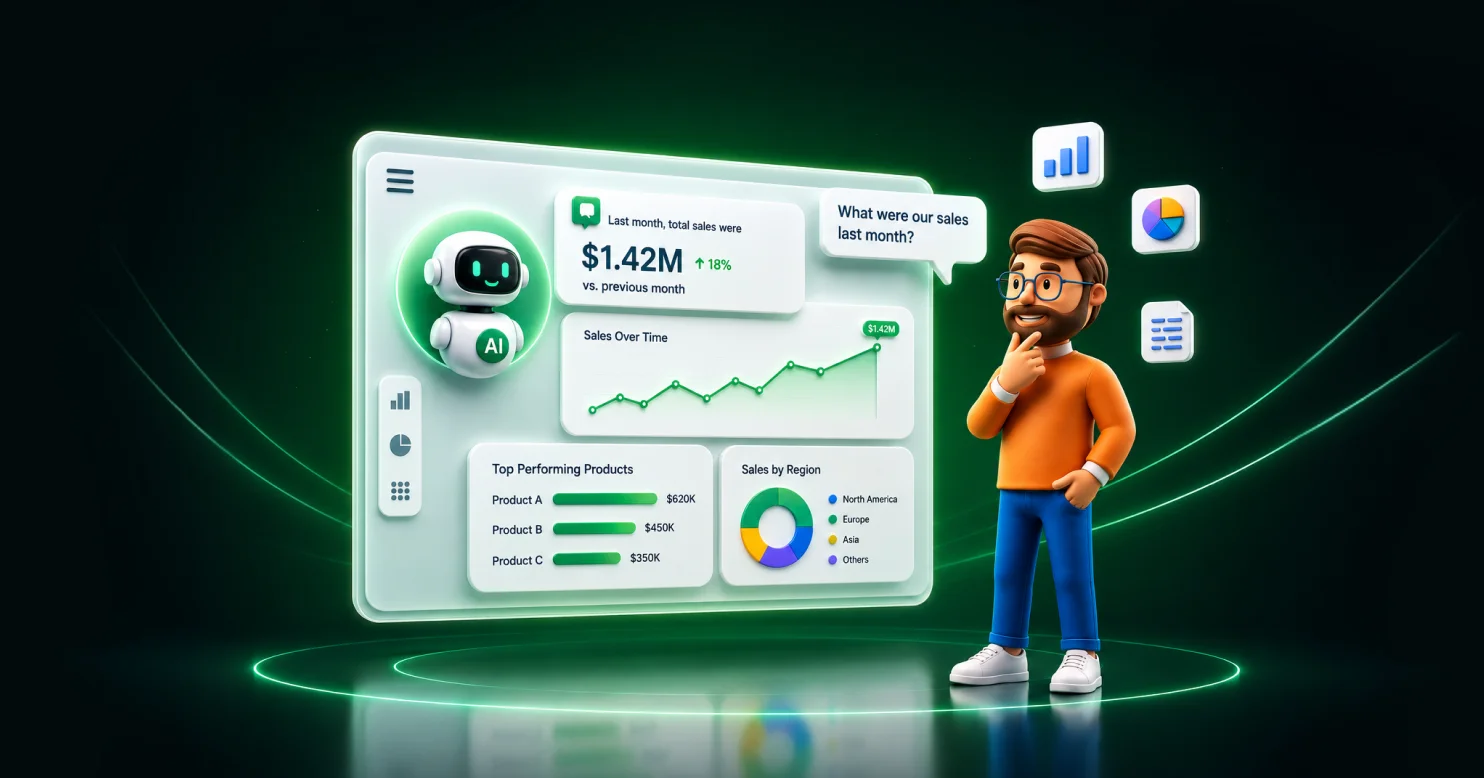
Type a request on a blank canvas. Bold BI turns it into a working, interactive starter dashboard — no manual setup. AI interprets what you're asking, finds the relevant data, and builds the visuals, so you go from question to a dashboard you can refine in seconds.
-
No manual setup — describe it, and a full starter dashboard is built
-
AI finds the relevant data and picks fitting visualizations for you
-
Every result is a real, editable dashboard — refine it or ship it
Syscon
Networxc
A4B
DigiQuip
CarNow
Revver
Smartway2
GeniusVets
Talentegy
Every dashboard used to start with a bottleneck
Getting a new view of your data usually means one of two paths: learn the query language and dashboard tooling yourself, or file a request and wait for a developer or analyst. Both are slow, and both mean the person with the question isn't the person who can answer it. Prompt-to-Dashboard removes the handoff — the person asking gets a working starter dashboard immediately.
Before
Days to weeksAfter
SecondsNo more "can someone build me a dashboard for X" tickets
No manual data modeling before a question can be answered
Non-technical users get a fast first draft without a BI developer
From prompt to dashboard in four steps
You ask in plain language, Bold BI resolves it against your actual data, builds the dashboard, and hands it to you to shape.
Ask
On a blank dashboard, type your question — "how did UK sales do this month," "break down tickets by priority." Plain language, no syntax.
Understood
Bold BI matches your words to your actual data, even when your team's terms don't match the field names. "Revenue," "sales," and "income" resolve to the same thing.
Built
Bold BI generates a complete starter dashboard — chart types and layout chosen automatically — live on your connected data.
Yours to shape
Refine any widget with AI Copilot — "make this a bar chart," "just EMEA" — or edit it by hand in the full Dashboard Designer.
One part of a broader AI Assistant
Your customers don't want a link to "open the BI tool." They want dashboards that look, feel, and behave like they were built by your team — because as far as they're concerned, they were.
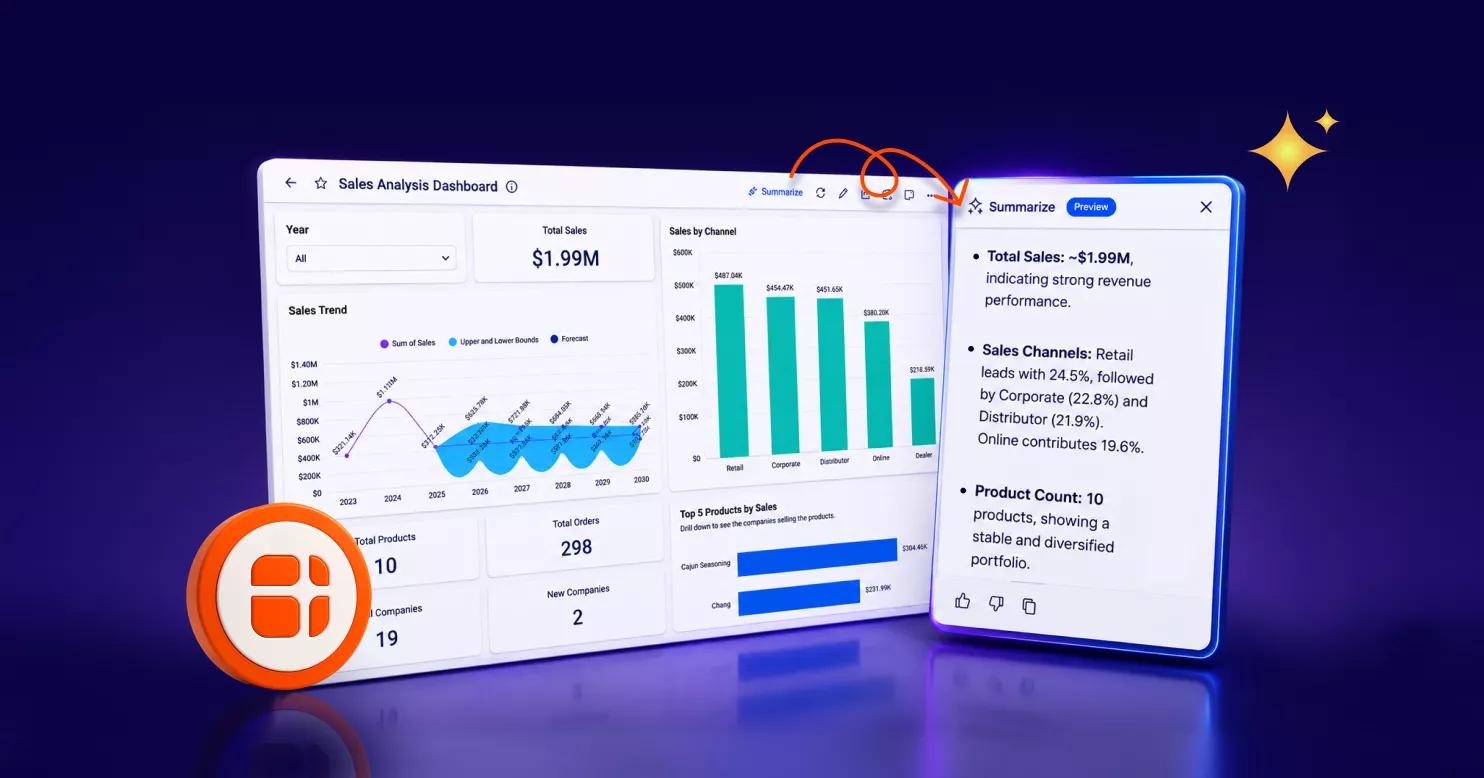
Smart Narrations
Auto-generated plain-language summaries explaining what a dashboard's metrics and trends mean.
Synonym Support
Recognizes alternate business terms and field names, so accuracy doesn't depend on knowing your schema.
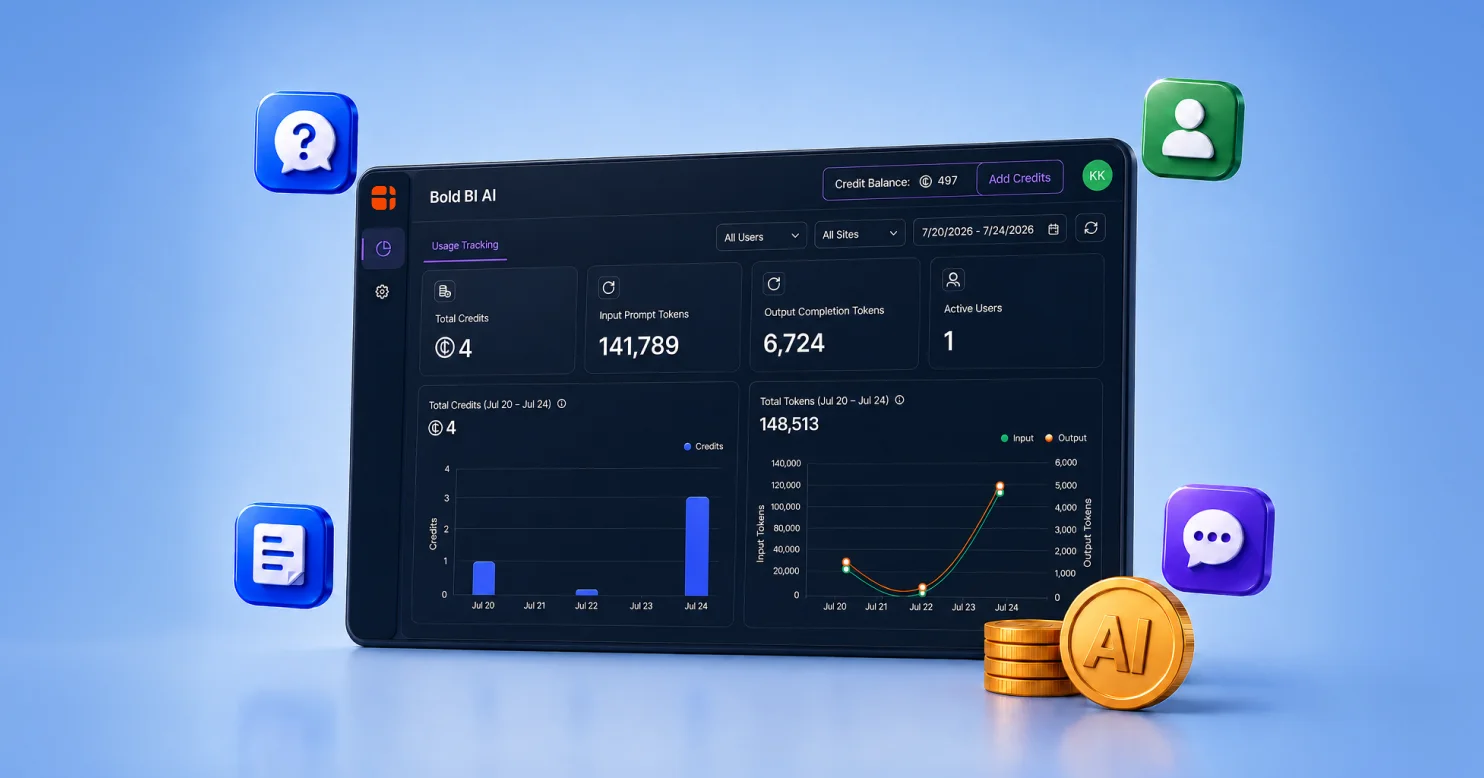
AI Credits Management
Administrators track and manage AI usage across teams, instead of an opaque usage bill.
Prompt-to-Dashboard
Convert a text prompt into a complete starter dashboard on a blank canvas, with no manual setup.
AI Copilot in the Designer
Create and adjust individual visuals — chart type, color, labels — by describing what you want.
AI Agent in the Viewer
Ask read-only follow-up questions about trends and metrics on a live dashboard and get grounded answers.
AI that respects your data boundaries
Prompt-to-Dashboard runs on your connected data across Bold BI's 140+ supported data sources. For teams with governance requirements, Bring Your Own Key (BYOK) lets you connect OpenAI, Azure OpenAI, or Anthropic using your own credentials, so AI usage, billing, and security stay under your control. Dashboard generation resolves your request against your data's schema — table and column names and types — rather than sending raw rows to the model. The same embedding architecture that powers Bold BI dashboards extends to AI-generated dashboards, so this isn't a siloed AI product bolted on.
-
BYOK: OpenAI, Azure OpenAI, Anthropic
-
Schema-only generation — metadata is sent to the model, not raw data
-
The same SDKs and REST APIs used for embedding apply to AI-generated dashboards
-
AI Credits Management gives administrators usage visibility across teams
One feature, different jobs depending on who's asking
Ask it the way your role would ask it, and get back exactly what that role needs
Stop waiting on a BI developer for every new question
Ask "show me churn by customer segment this quarter" and get an editable starter dashboard back — no ticket, no queue, no pivot table you rebuild every month.
"Churn by customer segment, this quarter vs last"
Returns a segmented bar chart, a period filter, and a Smart Narration of which segment moved.
Get the answer during the meeting, not after it
Get a fast first view during the meeting instead of after it. Paired with Smart Narrations, you get the charts and a plain-language summary of what they mean.
"Are we tracking to plan in EMEA this quarter?"
Returns a gap-to-plan view plus a two-sentence summary you can read aloud.
Ship natural-language analytics without building it
Give your own users the same prompt-to-dashboard experience inside your product via the embedding SDKs and REST APIs — without building natural-language querying yourselves.
// same SDK, AI-generated dashboards
<BoldBIAssistant
prompt={userPrompt}
token={jwt}
theme={yourTheme}
/>
Roll out AI dashboarding while keeping control
Roll out AI-assisted dashboarding while keeping control: BYOK for provider choice, AI Credits Management for usage visibility, and row-level security enforced under every AI-generated view. No separate "AI tier" of dashboards to govern.
AI provider
Your key
Row-level security
Enforced
AI credits by team
Visible
Raw data to the model
None
Analytics that Wins Awards and Users.
Recognized by G2, TrustRadius and Visual Studio Magazine for delivering standout performance and value.
I appreciate Bold BI for making it easier to provide reporting for our customers, allowing both our analysts and customers to easily build and publish reports. The ability to build dashboards and modify queries for specific outcomes is very user-friendly. I value the mobile readiness of the app and its integration capabilities with API structures. The addition of AI features is impressive. The economic pricing model and the effective partnership, which includes consistent and helpful support, make it an invaluable tool for our OEM model.
Ravi S.
The support from Bold is unmatched. They do not charge extra for support and it is excellent anyway. All our tickets and questions are quickly answered with authoritative and precise guidance. This is important at the product is complex, powerful and mature. To get the most out of the tool, the level of support they provide is essential.
Murph M.
It was easy to implement data visualizations into our product. The standard widgets allowed us to build professional looking dashboards, and a robust API provided excellent control of the development and runtime process from within our application.
Scott Y.
Users Love Us
Visual Studio Reader's Choice - 2025
Leader - Fall 2025
High Performer - Fall 2025 EMEA
Regional Leader - Fall 2025 AMERICAS
TrustRadius Tech Cares
Capterra - 4.9/5
G2- 4.4/5
GetApp - 4.9/5
Software Advice - 4.9/5
Prompt-to-Dashboard: frequently asked questions
A Bold BI AI Assistant capability that converts a plain-English prompt into a complete starter dashboard — automatically identifying relevant data and generating the visuals — without manual setup.
No. It's designed so non-technical users can create a starter dashboard using natural language, without data modeling or query-writing skills.
Synonym Support recognizes alternative business terms and field names, mapping familiar language to the correct underlying data fields.
Yes. Prompt-to-Dashboard is available on all Bold BI plans — there's no separate AI tier to buy.
Yes. Bring Your Own Key (BYOK) support lets you connect OpenAI, Azure OpenAI, or Anthropic using your own credentials, giving you control over AI billing, security, and governance.
No. Generation resolves your request against your data's schema — table and column names and types — to identify relevant fields and structure, rather than sending raw rows to the AI provider.
Yes. Generated dashboards open in the full Bold BI Dashboard Designer, where you can adjust chart types, layouts, colors, and filters manually or with further AI Copilot prompts.
A chatbot answers in text. Prompt-to-Dashboard produces an actual interactive Bold BI dashboard — live charts, filters, drill-downs — on your connected data, that you can keep editing and reuse.
Yes. The same AI Assistant capabilities extend to Bold BI's embedded architecture via its SDKs and REST APIs — not just the standalone app.
Ask your first question in the next five minutes
Start a free 30-day trial, connect a data source, and type your first prompt. If a dashboard doesn't beat however you answer that question today, you'll know within minutes.
-
No credit card required.
-
30-day money-back guarantee.
-
Cloud or On-premises.