
Materialized Views in Dashboards for Faster Insights


 16 min read
TL;DR: A materialized view stores a query’s results as a physical table, so dashboards read precomputed data instead of re-running expensive joins and aggregations on every load or filter change. Unlike a standard view, it must be refreshed to stay current. This post covers the syntax for popular databases and shows how to connect an Azure Databricks materialized view to Bold BI.
Introduction
Modern BI dashboards are interactive: filters, drill-down and drill-up, date ranges, and multiple visualizations on a single dashboard can all send queries to the database. Each interaction can run expensive operations such as joins, aggregations, and large table scans.
As data volume and user concurrency grow, performance issues appear quickly. Teams see dashboards abandoned, timeouts during peak hours, and rising database infrastructure costs. Over time, slow dashboards erode trust in analytics and delay decisions.
Materialized views solve this by moving repeated computation out of runtime queries. They store precomputed results that dashboards query directly, so teams get consistently fast performance without giving up interactivity.
This matters most for live connections. Bold BI’s Azure Databricks connector runs in live mode, so every dashboard interaction queries your SQL warehouse. With a materialized view, the warehouse reads stored results instead of recomputing joins on each filter change.
In this post, we’ll cover what materialized views are, how they differ from standard views, the syntax for popular databases including Azure Databricks, and how to refresh them. We’ll then walk through connecting a Databricks materialized view to Bold BI.
What is a materialized view in a dashboard?
A materialized view is a database object that physically stores the result of a query, similar to a table. Dashboards read from this stored dataset rather than recomputing joins and aggregations for every request.
Materialized views are commonly used across many database platforms to optimize BI workloads by precomputing aggregated and joined datasets before they are consumed by dashboards.
A standard view stores only the SQL definition and recomputes the results every time it is queried, whereas a materialized view stores both the SQL definition and the computed query results, enabling much faster read performance at the cost of requiring periodic refreshes to keep the data up to date.
For BI dashboards, this approach is especially valuable because workloads are typically read-heavy, repetitive, and focused on the same KPIs for many users.
Now that you understand what a materialized view is and how it improves query performance, let’s look at how materialized views are created across different database platforms.
Syntax for creating materialized views in popular databases
Most databases create materialized views with the CREATE MATERIALIZED VIEW statement (SQL Server uses indexed views instead). You create them in the database, and Bold BI then connects to them like any other table or view. They store the physical results of a query, typically aggregations or joins used for performance metrics, so dashboards can access data faster without recalculating complex queries each time.
Below are examples of how materialized views are created across commonly used databases.
Syntax for creating an indexed view in SQL Server
SQL Server does not provide native materialized views. Similar functionality is achieved through indexed views. These views store precomputed metrics such as revenue and expenses, enabling faster dashboard queries when accessed by BI tools.
CREATE VIEW dbo.customer_order_totals
WITH SCHEMABINDING
AS
SELECT
  CustomerID,
  SUM(OrderAmount) AS total_order_amount,
  COUNT_BIG(*) AS order_count
FROM dbo.Orders
GROUP BY CustomerID;
GO

CREATE UNIQUE CLUSTERED INDEX IX_customer_order_totals
ON dbo.customer_order_totals (CustomerID);
Once a clustered index is created on this view, the data will be materialized and optimized for performance.
Syntax for creating a materialized view in PostgreSQL
In PostgreSQL, materialized views store precomputed query results that can be refreshed on demand or on a schedule.
This approach is ideal for dashboards that rely on aggregated metrics and require fast query execution.
-- Create a materialized view that joins employees and departments
CREATE MATERIALIZED VIEW employee_department_info AS
SELECT
  e.employee_id,
  e.first_name,
  e.last_name,
  d.department_name
FROM emp e
JOIN departments d
  ON e.department_id = d.department_id;

-- Refresh to populate/update the stored results
REFRESH MATERIALIZED VIEW employee_department_info;
Syntax for creating a materialized view in Oracle
In Oracle, a materialized view is created using the CREATE MATERIALIZED VIEW statement along with options that define how the data is built and refreshed.
The example below precomputes employee-related metrics such as salary, department, and job details, enabling faster retrieval for reporting and dashboard analysis without querying the base table repeatedly.
CREATE MATERIALIZED VIEW "MATERIALVIEWSAMPLE" AS SELECT "EMPLOYEES_V"."JOB" AS "JOB", "EMPLOYEES_V"."MANAGER_ID" AS "MANAGER_ID", "EMPLOYEES_V"."COMMISSION" AS "COMMISSION", "EMPLOYEES_V"."EMPLOYEE_NAME" AS "EMPLOYEE_NAME", CAST("EMPLOYEES_V"."HIREDATE" AS DATE) AS "HIREDATE", "EMPLOYEES_V"."SALARY" AS "SALARY", "EMPLOYEES_V"."DEPARTMENT_ID" AS "DEPARTMENT_ID", "EMPLOYEES_V"."EMPLOYEE_ID" AS "EMPLOYEE_ID" FROM "SYSTEM"."EMPLOYEES_V" "EMPLOYEES_V"; **-- Optional: Create a unique index on the materialized view to improve refresh performance** CREATE UNIQUE INDEX "MV_EMPLOYEES_ID" ON "MATERIALVIEWSAMPLE"("EMPLOYEE_ID"); **-- Optional: Create a materialized view log for fast refresh** CREATE MATERIALIZED VIEW LOG ON "EMPLOYEES_V" WITH ROWID, SEQUENCE ("EMPLOYEE_ID", "HIREDATE", "SALARY", "DEPARTMENT_ID") INCLUDING NEW VALUES; ** -- Optional: Schedule a refresh for the materialized view (you can adjust the refresh **options as needed) EXEC DBMS_MVIEW.REFRESH('MATERIALVIEWSAMPLE', 'C', '', TRUE, FALSE, 0); ** -- Optional: Grant necessary privileges to users or roles** GRANT SELECT ON "MATERIALVIEWSAMPLE" TO YOUR_USER_OR_ROLE;
Syntax for creating a materialized view in Google BigQuery
This example precomputes KPI-related metrics such as total salary expenditure by aggregating data from the employee_data table, enabling faster retrieval without recalculating the value each time.
CREATE MATERIALIZED VIEW `sample.mv_salary_by_department` AS
SELECT
  department_id,
  SUM(salary) AS total_salary
FROM `sample.employee_data`
GROUP BY department_id;
Syntax for creating a materialized view in Azure Databricks
In Azure Databricks, the refresh schedule can live inside the view definition. According to Microsoft’s Azure Databricks CREATE MATERIALIZED VIEW reference (checked October 2026), you need a Pro or Serverless SQL warehouse to create one, and every aggregated column needs an alias. This example precomputes daily metrics by channel, like the marketing dashboard later in this post uses, and refreshes them every hour.
CREATE MATERIALIZED VIEW marketing.analytics.mv_daily_channel_metrics
  COMMENT 'Daily campaign metrics by channel for Bold BI dashboards'
  SCHEDULE EVERY 1 HOUR
AS SELECT
  CAST(event_time AS DATE) AS event_date,
  channel AS channel,
  COUNT(DISTINCT visitor_id) AS total_visitors,
  COUNT(DISTINCT session_id) AS total_sessions,
  SUM(clicks) AS total_clicks,
  SUM(impressions) AS total_impressions,
  SUM(cost) AS total_cost
FROM marketing.analytics.web_events
GROUP BY CAST(event_time AS DATE), channel;

-- Refresh on demand
REFRESH MATERIALIZED VIEW marketing.analytics.mv_daily_channel_metrics;
Materialized Views vs. Standard Views
Materialized views are valuable in BI environments because they reduce the repeated execution of expensive joins and aggregations on large datasets.
While both standard views and materialized views simplify access to complex queries, they differ significantly in how data is stored and retrieved.
| Feature | Standard View | Materialized View |
| Stores query results | No | Yes |
| Query performance | Recomputes results each time. | Reads precomputed data. |
| Storage requirement | Minimal. | Additional storage required. |
| Data freshness | Always current. | Depends on refresh schedule. |
| Best use case | Operational analytics. | Performance-critical BI dashboards. |
Understanding these differences helps determine when a materialized view is the right choice. Another important consideration is how the stored data is kept current through refresh operations.
Materialized View Refresh Strategies
Refresh strategy is the key trade-off when using materialized views, balancing data freshness, performance, and resource utilization to suit different analytical needs. Many database platforms support refresh mechanisms that help keep materialized views updated while reducing manual intervention.
The different refresh options include:
| Refresh Type | Description | Best For |
| Manual | Refresh is triggered explicitly when needed. | Small datasets |
| Scheduled | Refresh runs automatically at defined intervals. | BI dashboards |
| Incremental | Updates only new or modified data instead of rebuilding everything. | Near real-time analytics |
| Full refresh | Recomputes the entire dataset from scratch. | Historical analysis |
In Azure Databricks, Databricks decides whether each refresh can be incremental; if the source tables use row filters or column masks, it is always a full refresh.
To learn how to explore and connect materialized views in Bold BI across MSSQL, PostgreSQL, Oracle, and BigQuery, refer to our KB article on connecting materialized views in Bold BI.
Choosing the right refresh strategy ensures an effective balance between performance and data freshness. With these fundamentals covered, let’s see how materialized views can be connected and used in Bold BI.
Connect a Databricks Materialized View to Bold BI
Organizations using Azure Databricks can use materialized views in Bold BI to improve dashboard performance and reduce query latency. By querying precomputed aggregations and joins instead of large raw datasets, dashboards load faster and respond more quickly.
Bold BI’s native Azure Databricks connector connects directly to Databricks SQL warehouses, so teams can use materialized views as optimized dashboard datasets. The first step is to connect Azure Databricks to Bold BI.
The steps below use Azure Databricks as the example. Other databases, such as PostgreSQL, Oracle, SQL Server, and Google BigQuery, connect through their own Bold BI connectors in a similar way. See the Bold BI documentation for each connector:
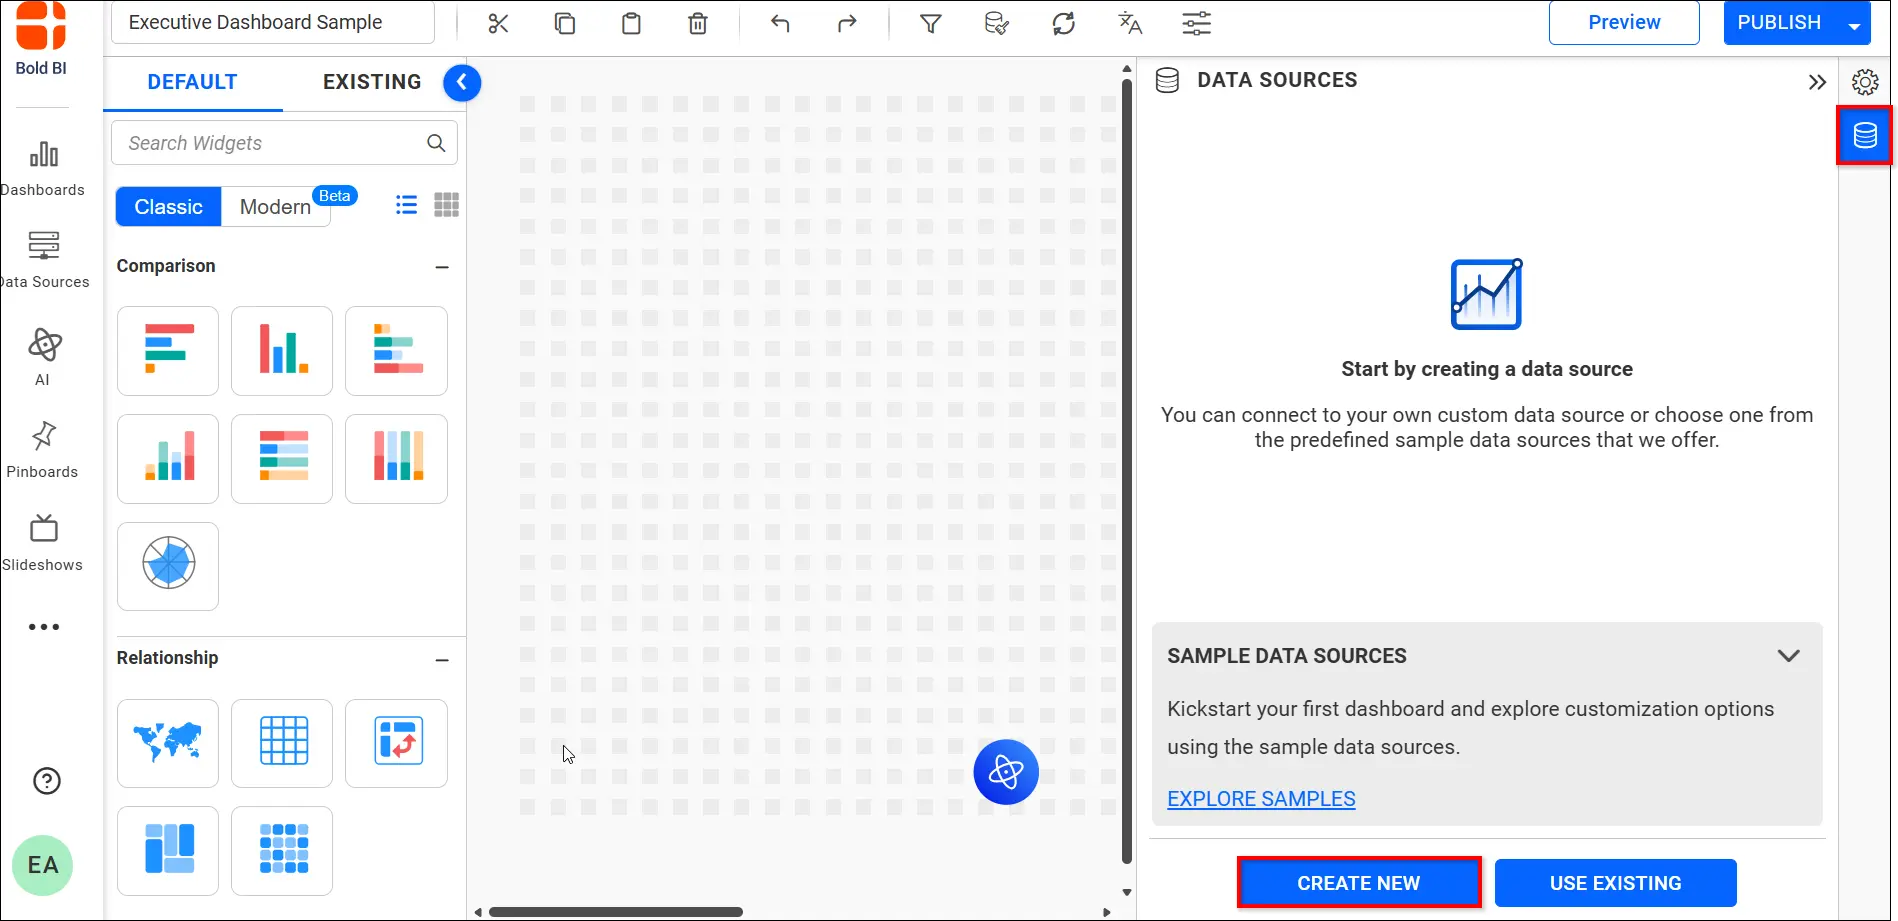
Step 1: Open Bold BI
Navigate to Data Sources and click Create New.
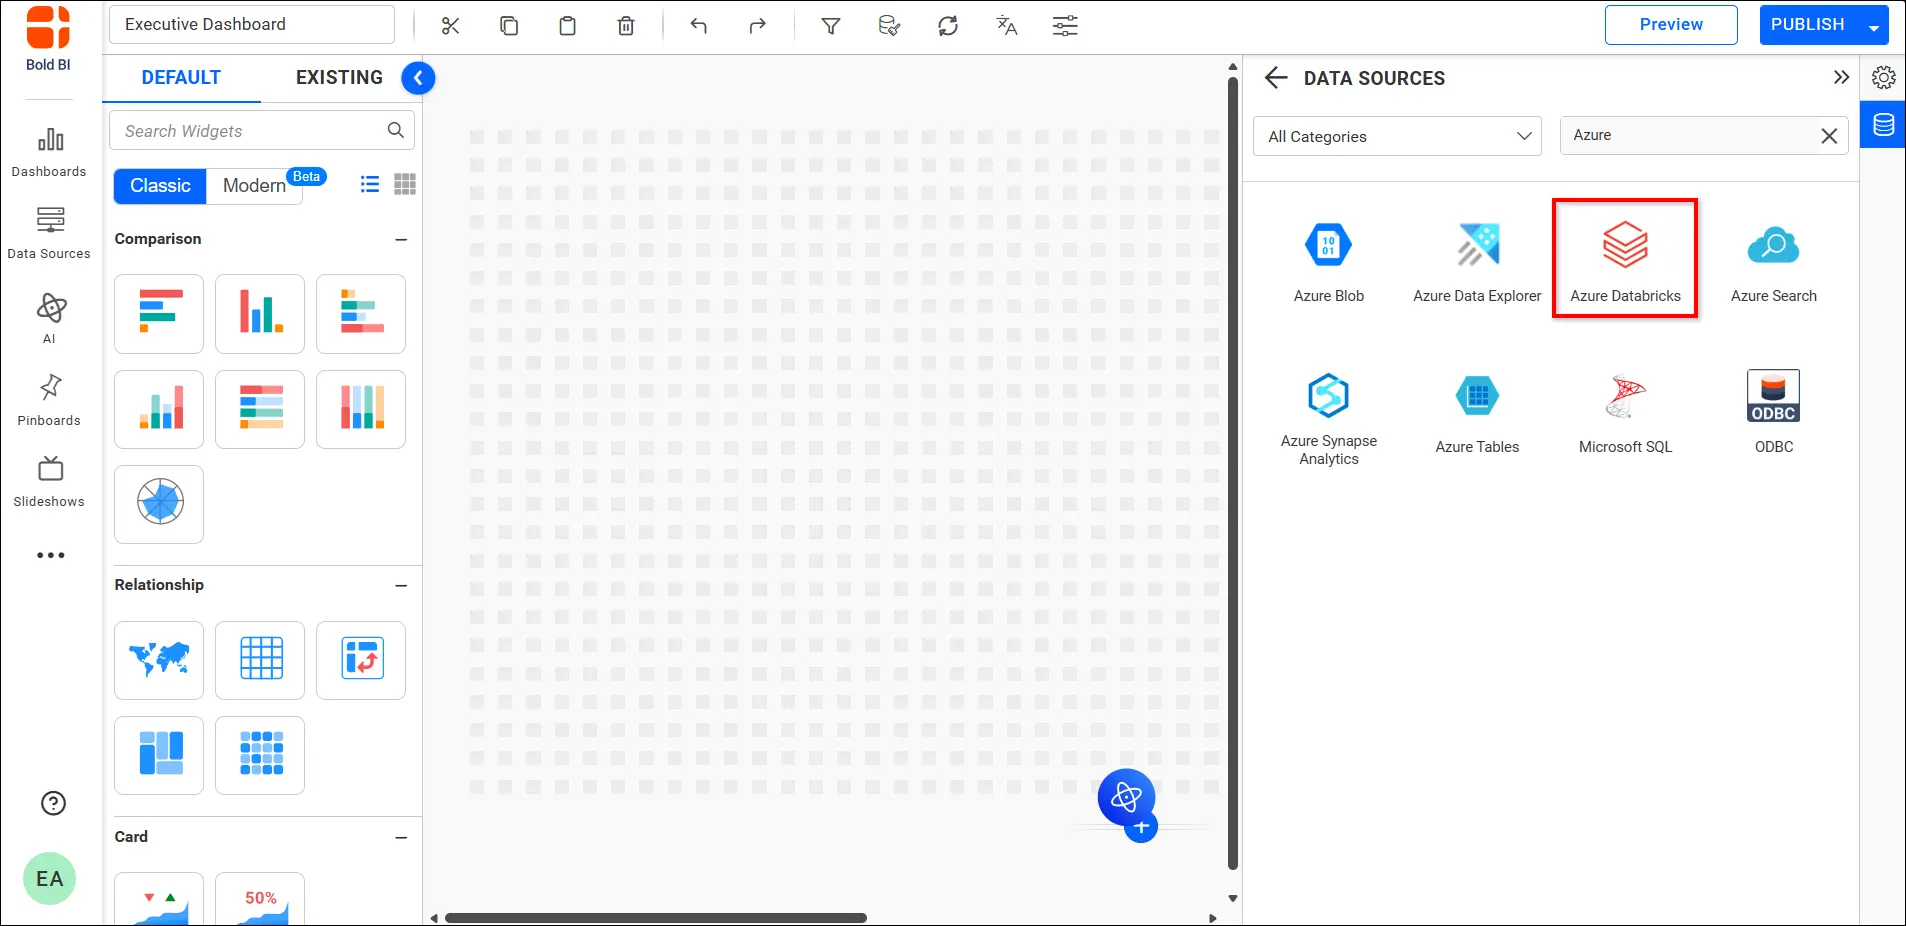
Step 2: Select the Azure Databricks connection in the connection panel
In the connection panel, search for and select Azure Databricks.
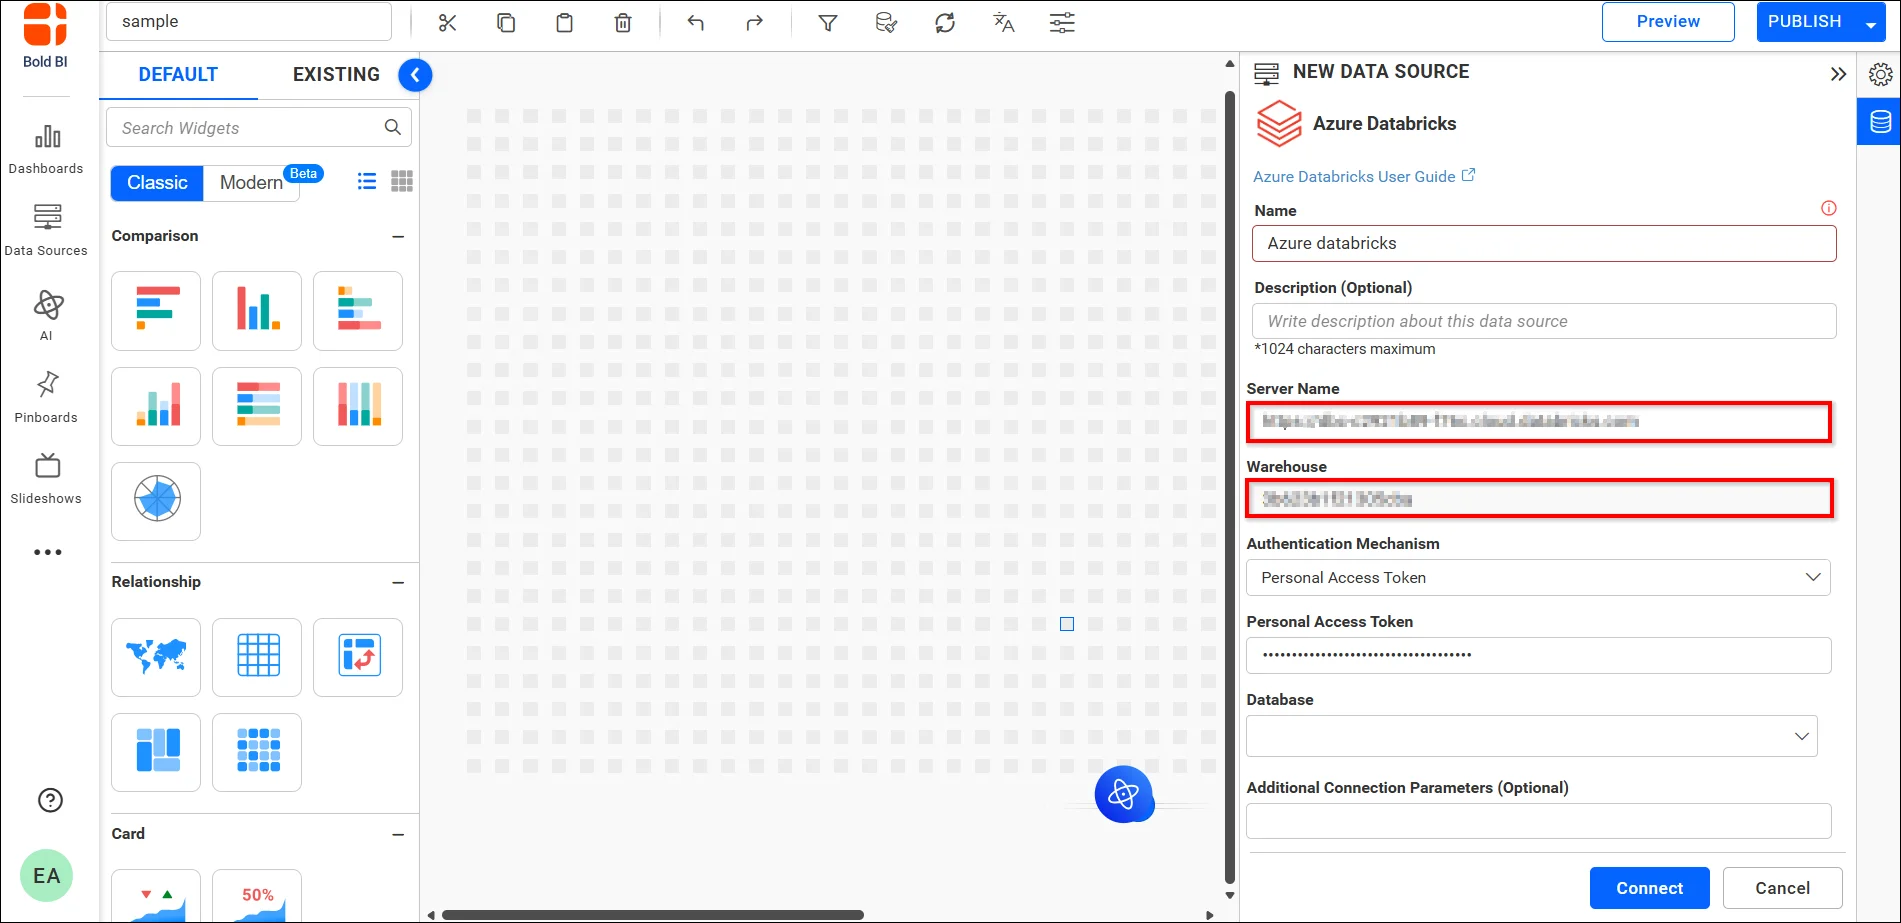
Step 3: Configure the connection details
Enter a name and optional description for the data source. Specify the workspace URL in the Server Name field and enter the warehouse ID in the Warehouse field.
Step 4: Select an authentication method
Choose one of the supported authentication methods:
- Personal Access Token (PAT): Enter the PAT generated in Azure Databricks.
- Azure AD Service Principal: Enter the tenant ID, client ID, and client secret associated with the registered application.
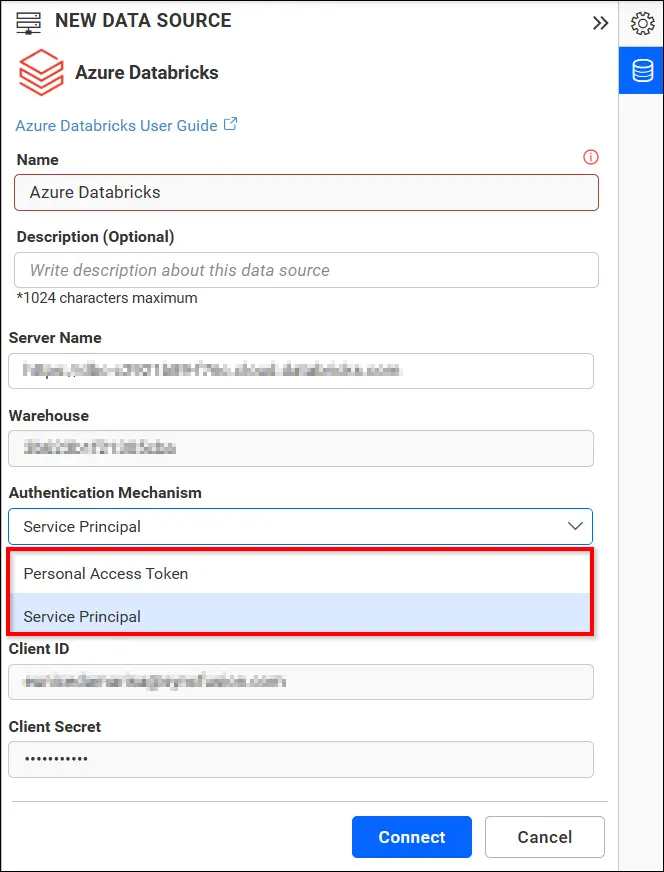
In this case, we have chosen PAT, so we enter the personal access token.
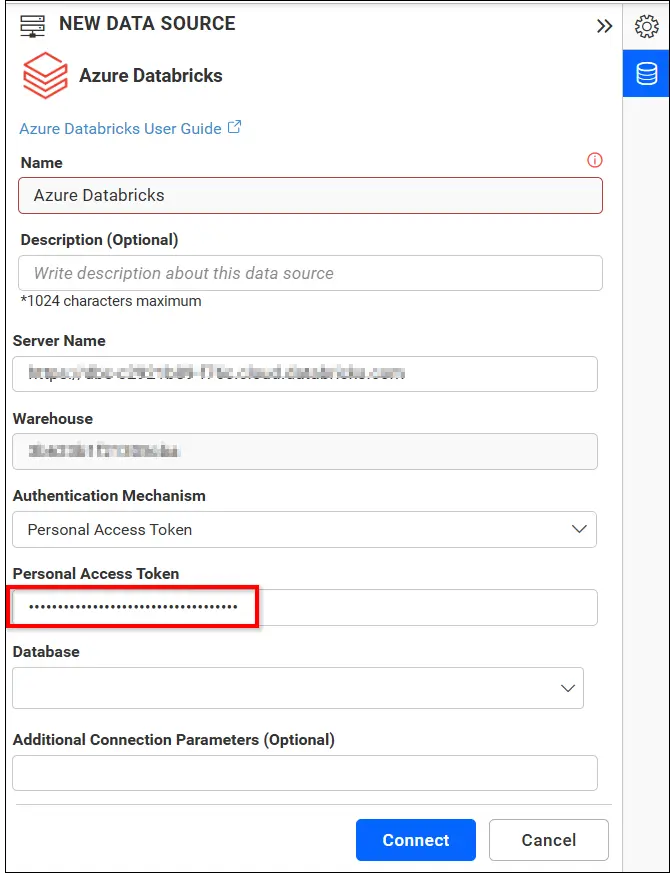
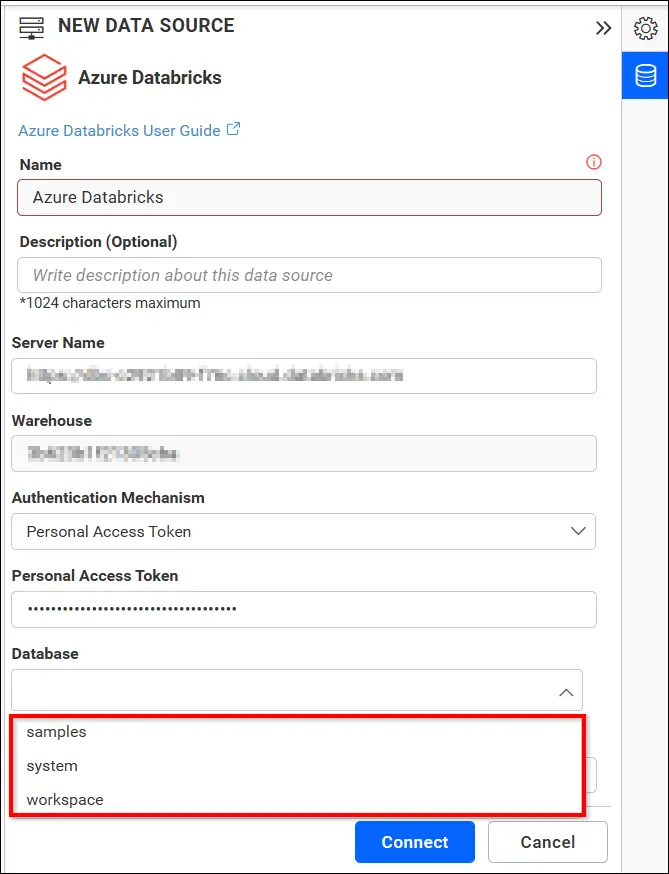
Step 5: Select the database
Choose the required database from the list of available databases. Ensure the selected database contains the materialized view you want to use.
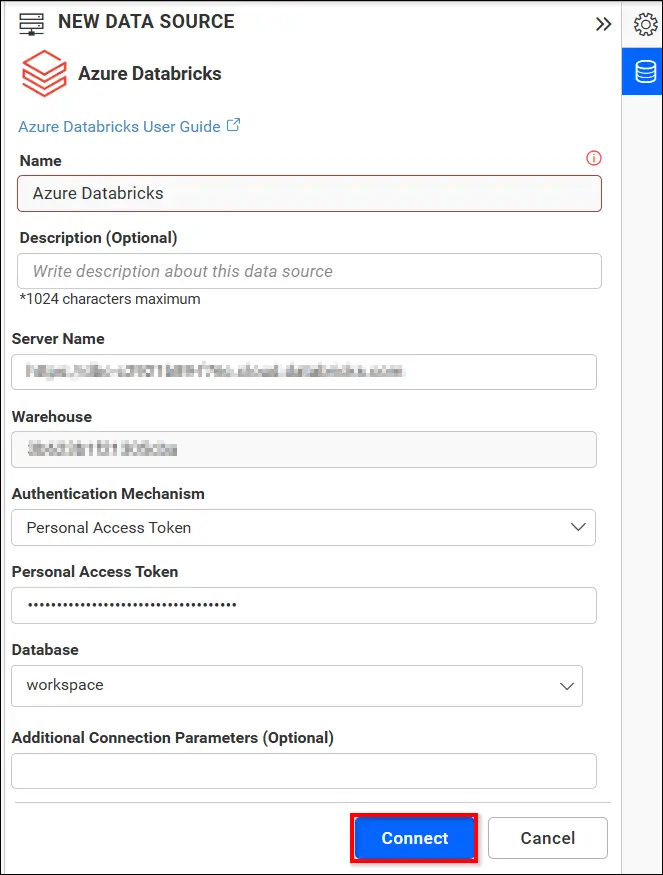
Step 6: Click Connect
Click Connect to validate the configuration and retrieve the available Azure Databricks schemas.
Step 7: Select the materialized view
Once connected, the design page automatically displays the configured details. After a successful connection, the available databases and schemas are displayed. Expand the required schema to locate the materialized view.
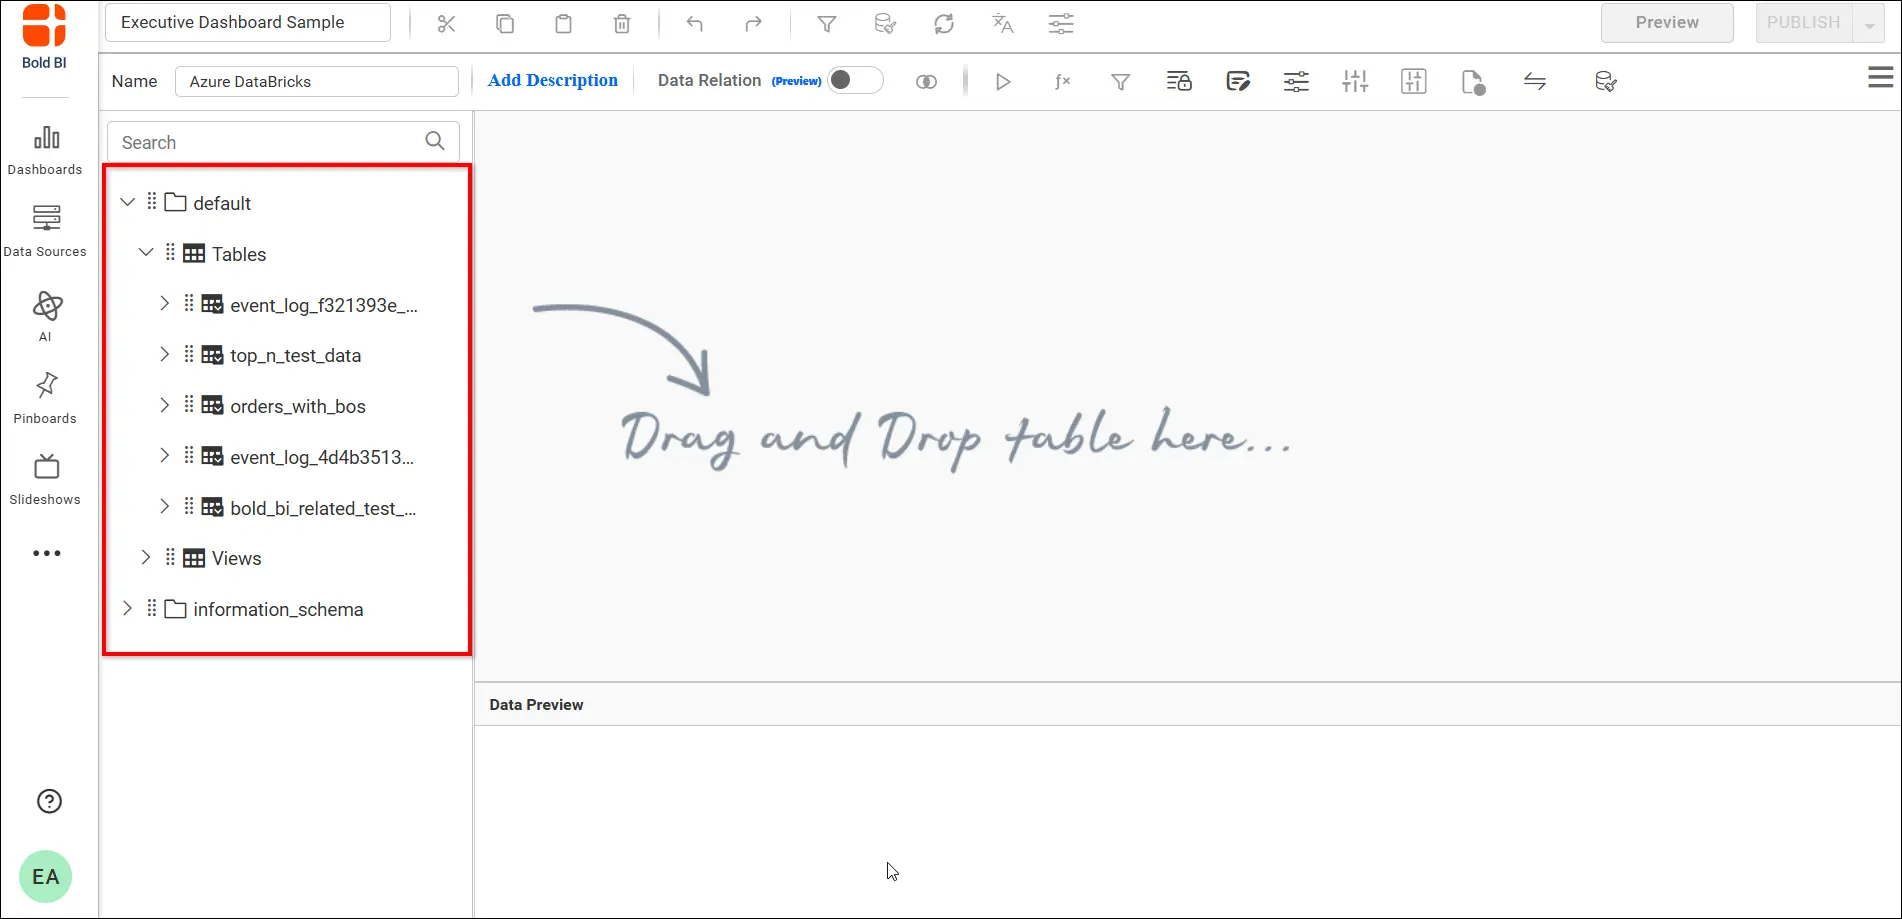
Step 8: Drag and drop the selected materialized view into the design area
Select the required materialized view from the schema tree and drag it onto the design area.
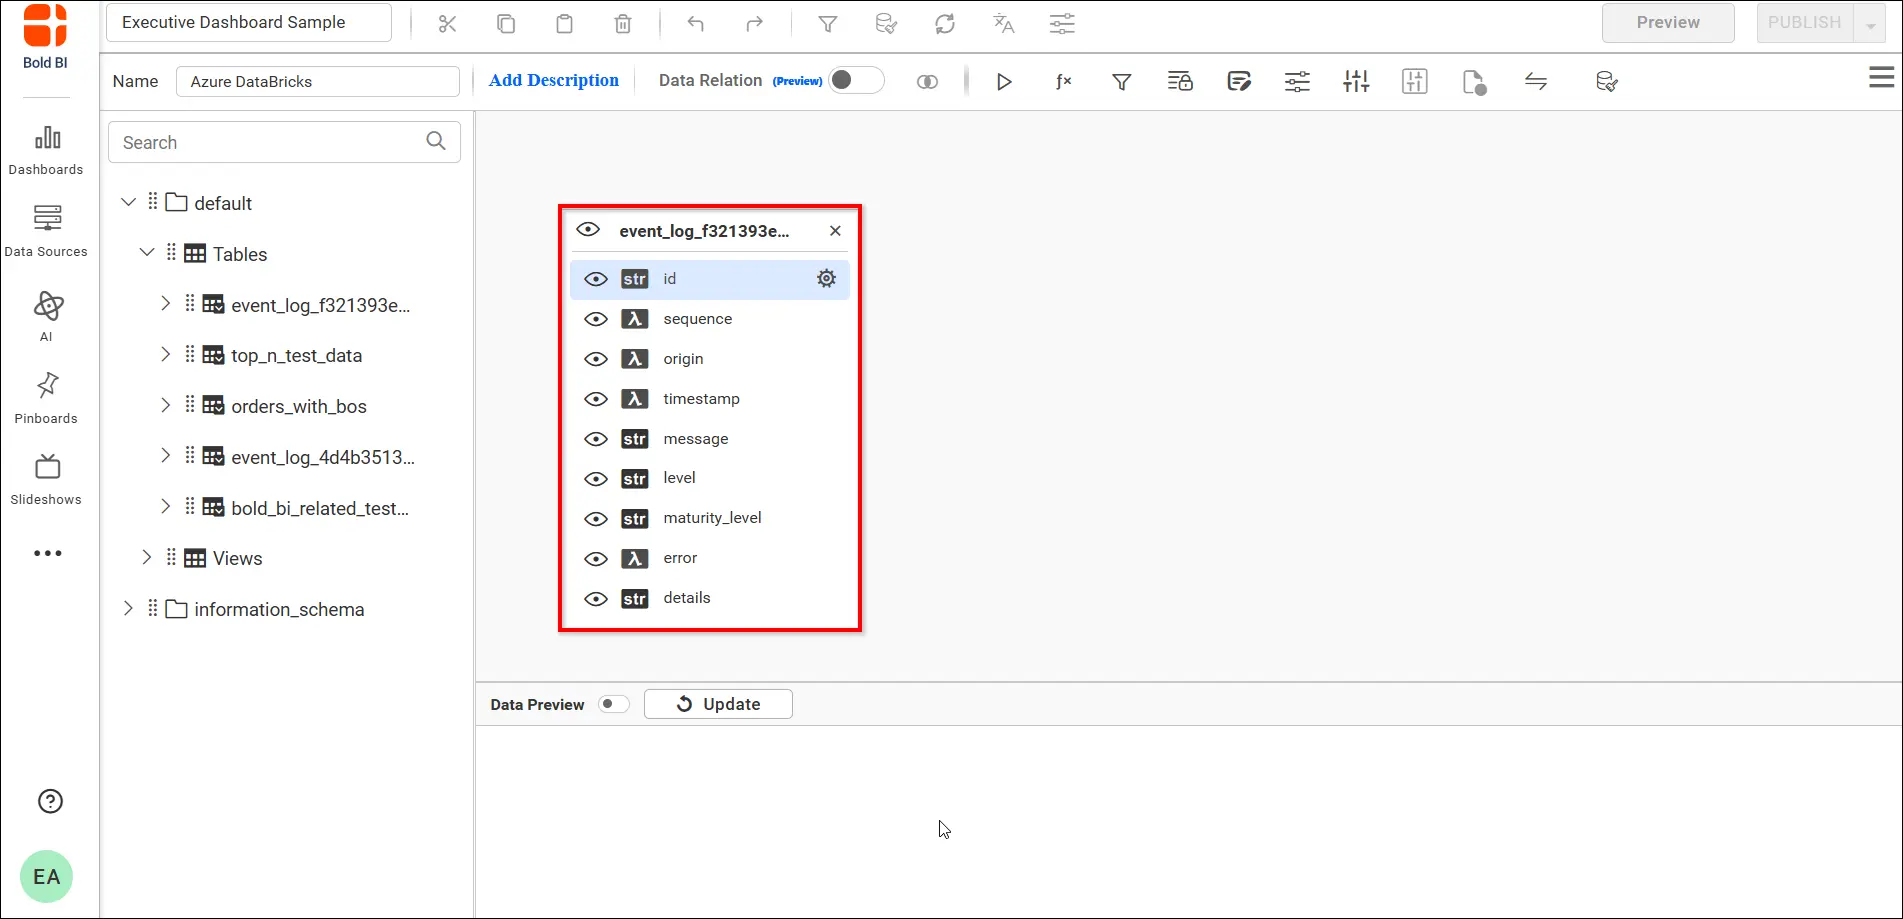
Step 9: Save the data source
Review the retrieved data to confirm that the expected columns and records are returned. Once validated, click Save and provide a suitable name for the data source.
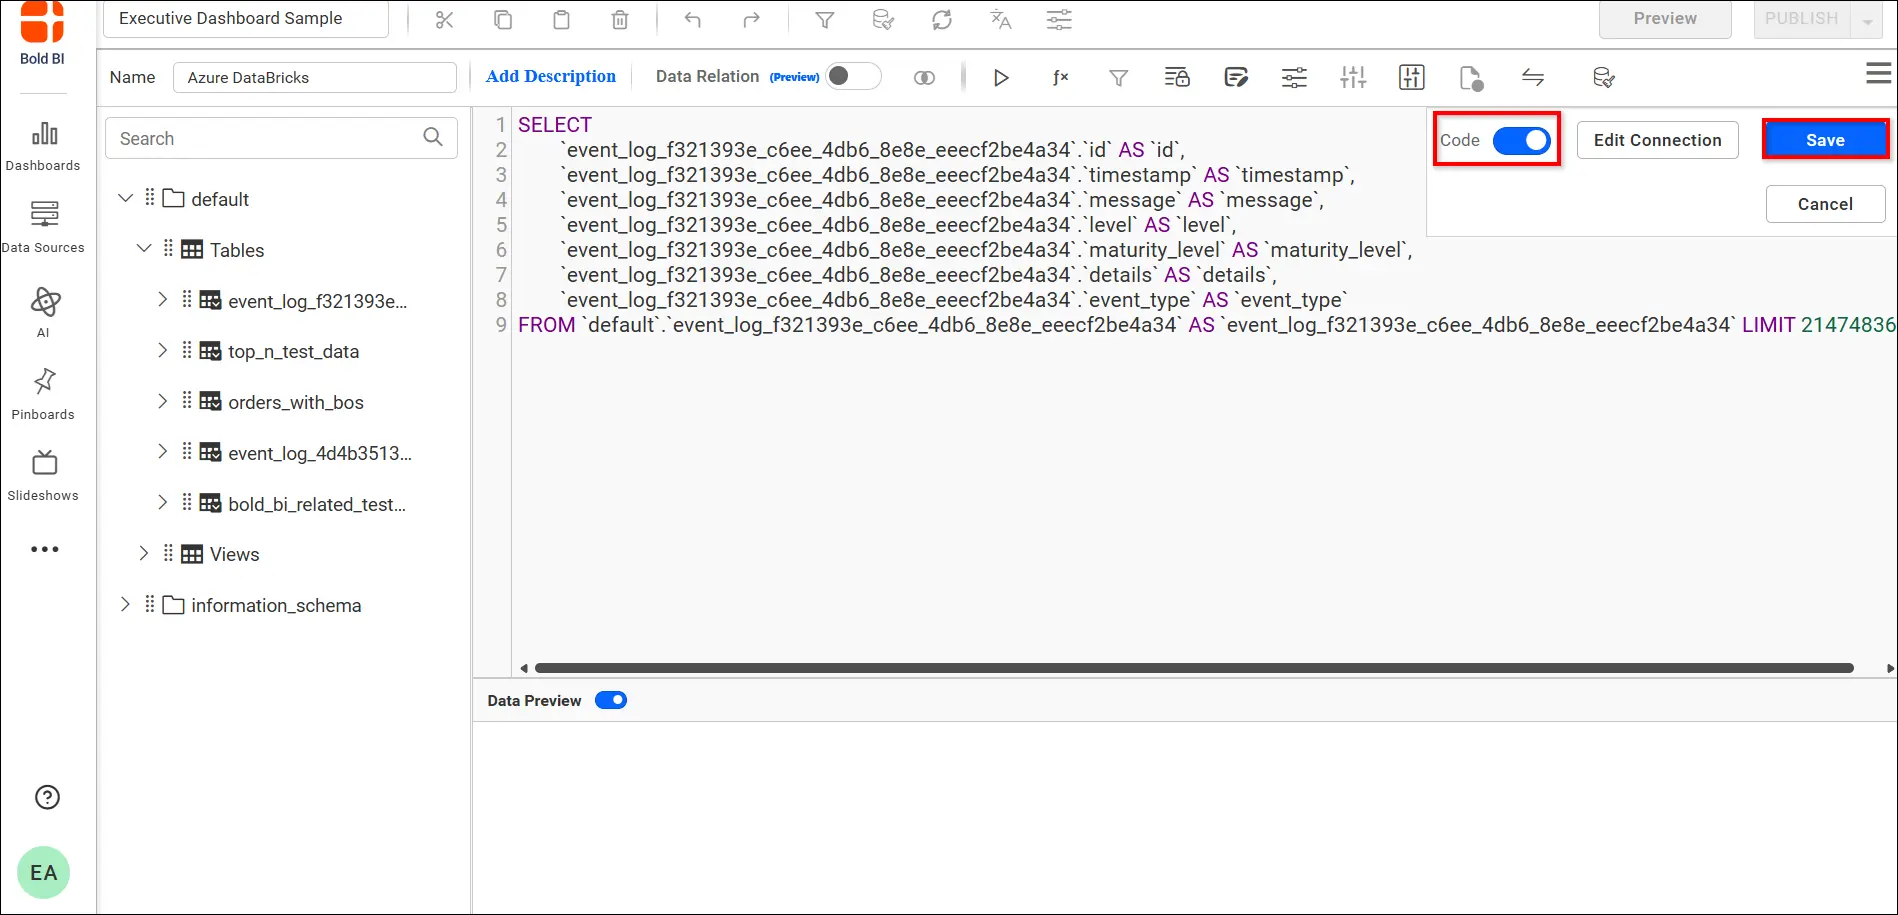
Step 10: Build dashboards using Azure Databricks materialized views
After creating the data source, you can use the Azure Databricks materialized view as the dataset for building interactive dashboards in Bold BI. Because the data is precomputed, dashboards can deliver faster query performance and a more responsive analytics experience, even when analyzing large datasets.
The connecting identity needs permission on the SQL warehouse and Data Reader on the catalog (per Bold BI’s connector guide), plus SELECT on the materialized view and USE CATALOG and USE SCHEMA on its catalog and schema (per Databricks).
For multi-tenant dashboards, note that Bold BI queries Databricks as one PAT user or service principal, so a Databricks row filter that checks CURRENT_USER sees that identity, not the viewer. Apply per-viewer rules in Bold BI with user filters or custom attributes, which this connector supports.
To learn more on how to configure and connect Azure Databricks in Bold BI, explore our documentation.
Once the connection is established, the materialized view can serve as an optimized dataset for dashboards. To better understand the practical benefits, let’s explore a real-world marketing analytics example.
Example: Using a materialized view in a marketing analytics dashboard
Consider a marketing analytics platform where raw campaign data is stored in Azure Databricks and processed through Databricks SQL warehouses. A materialized view can precompute campaign KPIs before they are consumed by Bold BI dashboards.
Using this summarized dataset, you can create dashboards to monitor:
- Marketing campaign performance
- Engagement metrics by channel
- Conversion and acquisition trends
- Revenue and ROI analysis
- Customer interaction patterns
- Time-based performance comparisons
These metrics help organizations measure marketing effectiveness, identify optimization opportunities, and make data-driven decisions. In Bold BI, the materialized view serves as the dashboard dataset, enabling fast filtering, seamless drill-down analysis, and responsive interactions across multiple visualizations. To measure the benefits of materialized views, we tested a marketing analytics dashboard using a dataset containing 50 million records.
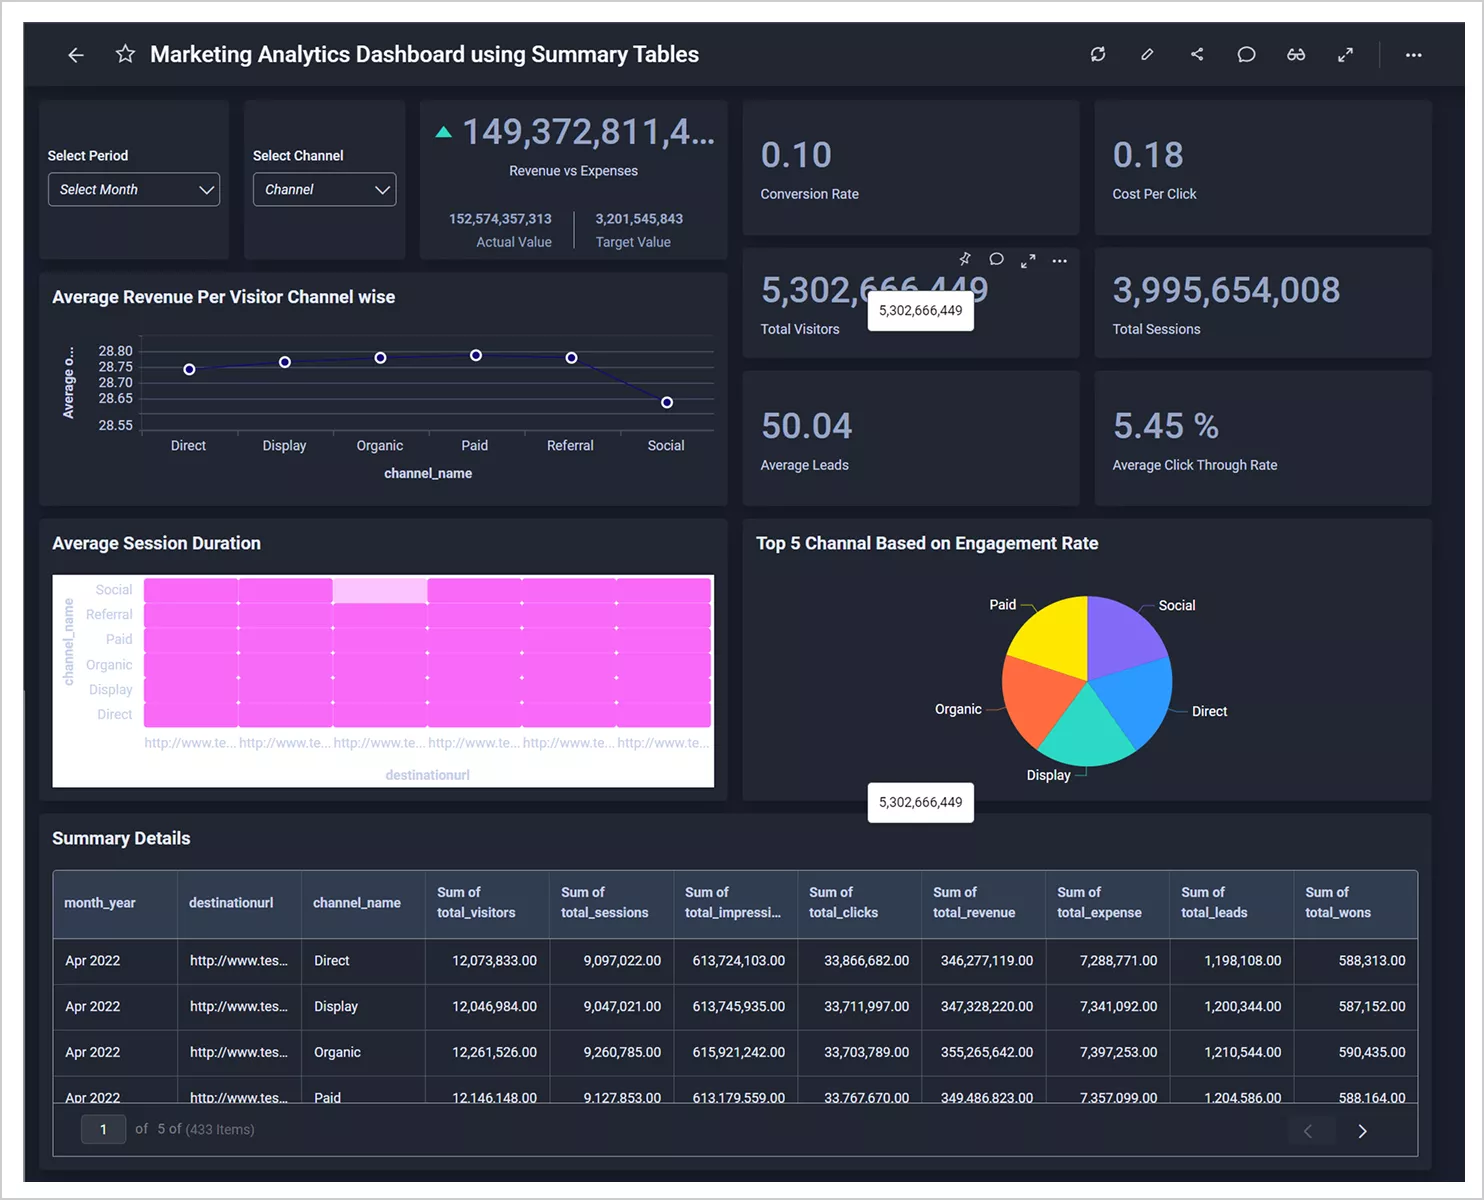
To quantify the impact of materialized views, we tested a marketing analytics dashboard on [DATABASE] using a dataset containing 50 million records. The results below compare widget query execution times when using raw data versus materialized views. In most tested widgets, materialized views reduced query execution times from seconds to sub-second performance, significantly improving dashboard responsiveness and user experience.
| Widget Name | Design Mode using Raw Data | Design Mode using Materialized Views |
|---|---|---|
| Select Period (Combo box) | 00:00:09.018 | 00:00:00.001 |
| Select Channel (Combo box) | 00:00:03.246 | 00:00:00.001 |
| Revenue vs Expenses (KPI Card) | 00:00:01.326 | 00:00:00.001 |
| Conversion Rate (Number Card) | 00:00:04.195 | 00:00:00.001 |
| Cost Per Click (Number Card) | 00:00:03.196 | 00:00:00.001 |
| Total Visitors (Number Card) | 00:00:01.212 | 00:00:00.001 |
| Total Sessions (Number Card) | 00:00:01.907 | 00:00:00.005 |
| Average Leads (Number Card) | 00:00:01.873 | 00:00:00.002 |
| Average Click Through Rate (Number Card) | 00:00:03.729 | 00:00:00.001 |
| Avg. Revenue Per Visitor Channel-wise (Chart) | 00:00:04.212 | 00:00:00.003 |
| Average Session Duration (Heat Map) | 00:00:05.144 | 00:00:00.001 |
| Top 5 Channels Based on Engagement Rate (Proportion Chart) | 00:00:30.908 | 00:00:00.001 |
| Summary Details (Grid) | 00:00:21.081 | 00:00:00.011 |
The results demonstrate how materialized views can dramatically reduce query execution times for dashboard widgets that rely on filters, KPIs, and aggregated metrics. As dataset sizes increase, these optimizations become even more important for maintaining a responsive analytics experience.
This example demonstrates how precomputing frequently accessed metrics can significantly improve dashboard responsiveness. Let’s now compare the performance gains achieved with materialized views against other data access approaches.
Performance Comparison: Raw Tables vs. Materialized Views
Materialized views and aggregated tables both reduce runtime work. The best choice depends on your database features, refresh needs, and how flexible the dashboard queries must be.
The following comparison provides a general performance guideline. Actual results depend on factors such as data volume, refresh frequency, query complexity, and warehouse configuration.
| Metric | Raw Tables | Materialized Views | Aggregated Tables |
| Execution Time | Slow (full scan + runtime compute) | Fast (precomputed query results) | Very fast (minimal dataset, pre-aggregated) |
| Dashboard Load | High latency | Faster loading | Fastest loading |
| CPU Usage | High (heavy processing required) | Moderate (reduced computation) | Low (minimal processing) |
| Data Volume Scanned | Very high | Medium | Very low |
| Concurrent Users | Limited (performance degrades) | Improved handling | Highly scalable |
| Network Latency | High (large data transfer) | Reduced | Minimal |
While performance benefits are clear, materialized views are not necessary for every analytics scenario. Understanding when to use them can help maximize their value while maintaining the right balance between speed and data freshness.
When to Use Materialized Views in BI Dashboards
Materialized views work best when:
- Dashboards rely on complex joins across large tables.
- Metrics involve heavy aggregations (daily, weekly, monthly rollups).
- The same KPIs are queried by many users.
- Data updates on a scheduled cadence (hourly or daily).
- Consistent performance is more important than real-time freshness.
Improve Dashboard Performance with Materialized Views in Bold BI
Materialized views are a highly effective way to improve dashboard performance for large-scale BI workloads. By storing precomputed query results, they reduce query execution time, minimize database load, and help dashboards remain responsive even as data volumes and user concurrency increase. For organizations that rely on interactive analytics, materialized views provide a practical balance between performance, scalability, and data accessibility.
With Bold BI®, you can use materialized views, aggregated tables, and optimized data models, including Azure Databricks materialized views through the native live connector, to build high-performance dashboards. Whether you’re analyzing marketing performance, operational metrics, financial KPIs, or customer data, Bold BI helps ensure users get the information they need without performance bottlenecks.
Ready to build faster, more responsive dashboards?
Start your free Bold BI trial today and discover how optimized data strategies, powerful visualizations, and 145 data connectors can help you deliver analytics at scale. You can also schedule a personalized demo to see how Bold BI fits your BI and embedded analytics requirements.
Frequently asked questions
- 1.
What is a materialized view?
A materialized view is a database object that stores the result of a query as a physical table. Unlike standard views, it saves precomputed data for faster retrieval.
- 2.
How do materialized views improve dashboard performance in Bold BI?
They improve performance by allowing dashboards to use pre-aggregated data instead of running complex queries repeatedly, resulting in faster load times and reduced database load.
- 3.
When should I use materialized views?
They are best used when working with large datasets, complex queries, or frequently accessed dashboards where performance optimization is needed.
- 4.
How often should materialized views be refreshed?
Refresh frequency depends on your data needs, ranging from real-time or frequent refreshes for dynamic data to daily or periodic refreshes for reporting scenarios.
- 5.
Does Bold BI create materialized views automatically?
No. Materialized views must be created in the database, and Bold BI connects to them as an optimized data source.
- 6.
Can materialized views improve embedded analytics performance?
Yes. They store precomputed results, which helps speed up queries and improves dashboard load times.
- 7.
What databases support materialized views with Bold BI?
Bold BI works with databases that support materialized views, including PostgreSQL, Oracle, SQL Server (as indexed views), Amazon Redshift, Google BigQuery, Snowflake, and Azure Databricks. Azure Databricks materialized views are supported through the native connector in live mode.
- 8.
Are materialized views suitable for real-time dashboards?
Generally not. Because they depend on refresh schedules, materialized views are typically better suited for near-real-time or historical analytics than fully real-time dashboards. In Azure Databricks, TRIGGER ON UPDATE narrows the gap by refreshing a view soon after its source tables change.
- 9.
Does Bold BI support extract mode for Azure Databricks?
No. The Azure Databricks connector works in live mode, so queries run on your Databricks SQL warehouse. Materialized views help keep those live queries fast.