
Team Management Dashboard for Product Managers
Understand team workload and performance to improve collaboration and delivery outcomes.
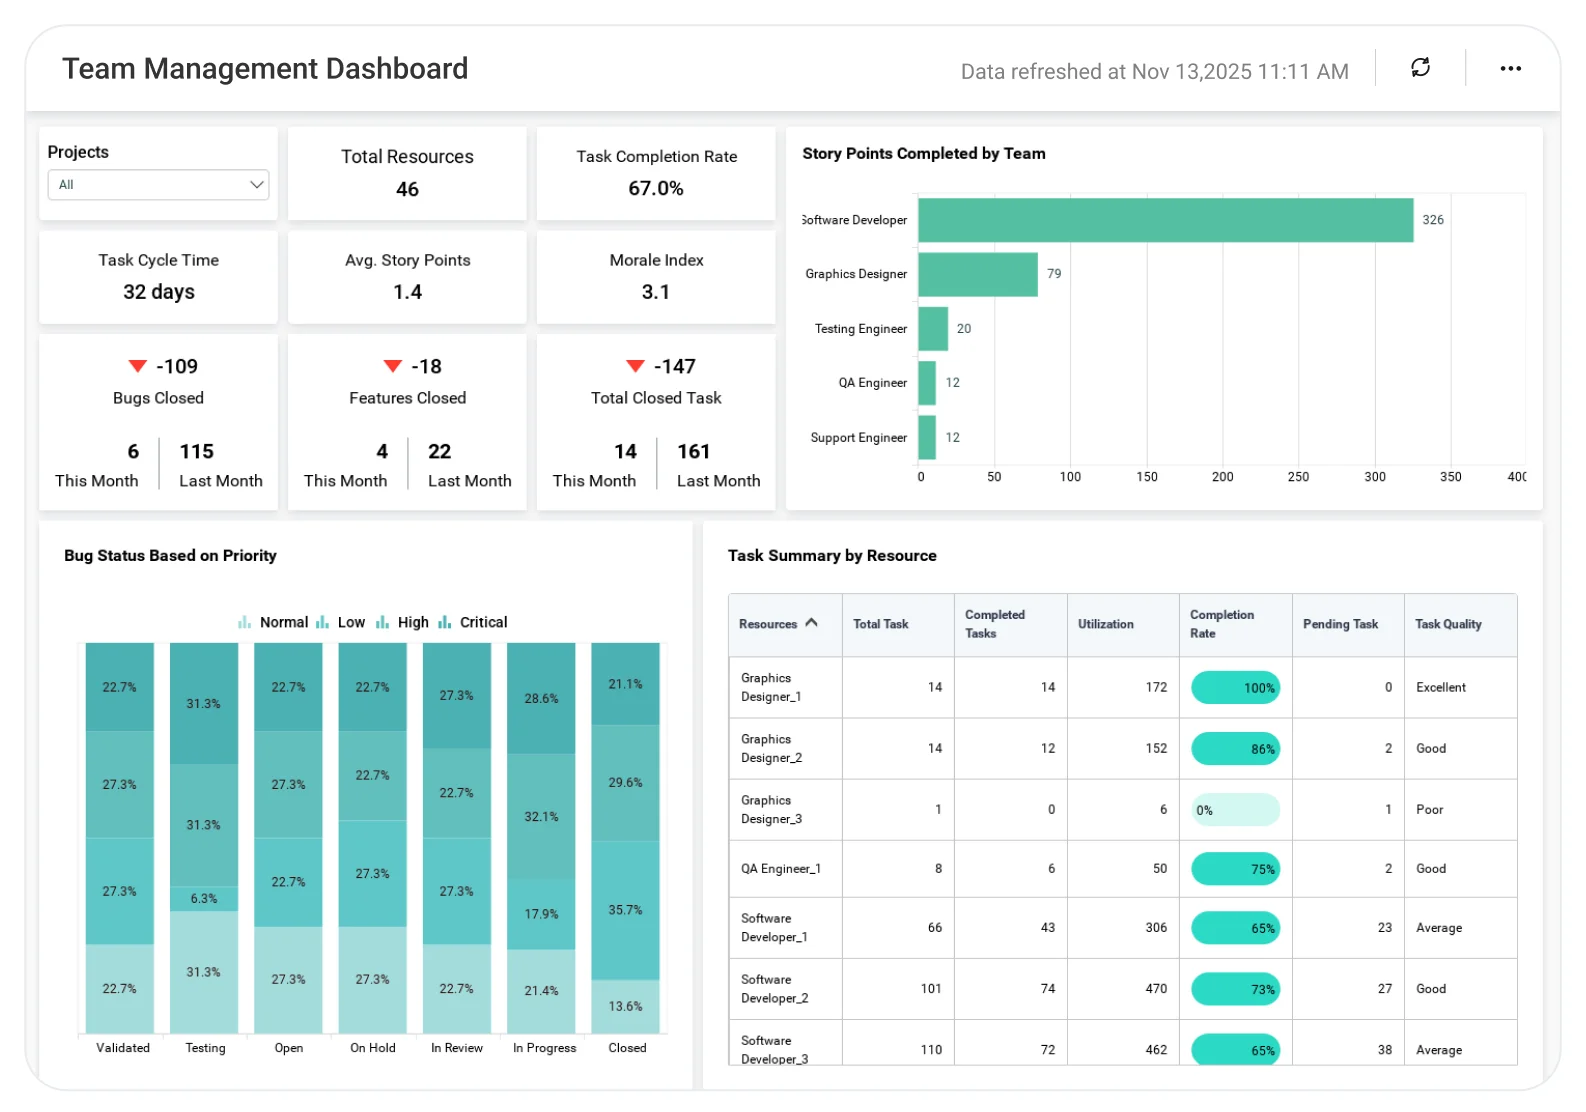
The Team Management Dashboard helps teams analyze task distribution, progress, capacity, and team efficiency, enabling better workload balance, improved collaboration, and more predictable project delivery.
TL;DR
-
Understand low instantly with real-time WIP, cycle time, lead time, and throughput trends.
-
Expose bottlenecks early using task cycle time, wait time, and work aging.
-
Balance capacity with confidence by comparing planned vs. actual workload.
-
Monitor delivery risk through defect aging, blockers, and escaped issues.
-
Share an executive-ready view of delivery health across teams.
What Is a Team Management Dashboard?
It’s a real-time view of team performance and delivery predictability. In Bold BI, that means unified charts, alerts, and drilldowns from your Agile tools so you can manage outcomes instead of chasing tasks.
Why Team Management Dashboard Matters
When delivery data is scattered across tools, roadmap confidence disappears.
Bold BI unifies your team's metrics into one clear view thus you can spot risks early, manage flow, and commit with confidence.
Answer critical questions like:
-
Are teams working at a healthy, sustainable pace?
-
Where are bottlenecks slowing down features?
-
Is our flow actually improving in each sprint?
-
How do capacity and flow metrics impact release predictability?
What You’ll Track
-
Flow metrics: Track WIP, cycle time, and lead time to understand how smoothly work moves from start to finish.
-
Throughput & predictability: Track completed work per sprint to understand throughput trends and reduce carryover helping teams deliver more predictably.
-
Capacity & workload balance: Examine the utilization overview, for every team or role to compare planned work against tasks and determine the amount of time dedicated to features compared to bug fixes.
-
Delivery coordination: Comprehend how the team’s implementation corresponds with the release advancement and the resulting effect on the customer by linking delivery metrics to patterns, in CSAT or NPS.
-
Quality & risk metrics: Identify delivery risks by tracking defect aging, unresolved issues, stalled work, and repeated problems.
Also, all the dashboards are very customizable so you can add your KPIs, set your thresholds, or mix engineering, customer, and financial data for getting deeper insights into delivery.
How It Works
-
Connect your data sources Jira, Azure Devops, Github, Spreadsheets, Databases.
-
Apply the sample dashboard or start from scratch.
-
Blend team metrics with business data to answer big questions like, “Do we have the capacity to deliver the roadmap on time?".
-
Set proactive alerts for WIP spikes, long cycle times, or rising defect aging.
-
Publish dashboards for PMs, engineering leads, program managers.
Why Bold BI Is the Right Fit for Team Management Analytics
-
Unified Agile & business visibility: Combine Agile delivery metrics with finance, support, product usage, and CSAT KPIs in one dashboard.
-
Self-service with governance: Enable PMs, engineering leaders, and executives to explore data independently while maintaining control.
-
Cross-functional insights: Connect delivery performance with real business outcomes.
-
Flexible deployment: Deploy dashboards in the cloud or self-host to meet organizational needs.
-
Secure embedding: Embed dashboards directly into PM tools, Confluence, or internal portals.
Compare Options (at a glance)
| Feature | Bold BI | Agile Tool Reports | Spreadsheets |
|---|---|---|---|
| Sprint & team performance analytics | Yes | Limited | Manual |
| Velocity, burndown & burnup tracking | Yes | Partial | Manual |
| Work item drilldowns (epic → story → task) | Yes | Limited | Manual |
| Capacity planning & workload visibility | Yes | Limited | Manual |
| Custom KPIs & dashboards | Fully customizable | Fixed | Manual |
Frequently Asked Questions
More Articles About Team Management Dashboard
-
Drive Growth with Agile Teams Management with Embedded BI
 Explains benefits of embedding a Team Management Dashboard for productivity, decision-making, and time efficiency.
-
Measuring Team Success with Scrum Metrics and KPIs
Discusses scrum KPIs like velocity, cycle time, and story points, and how Bold BI dashboards help track them.
-
Prioritize and Complete Agile Projects with Embedded Analytics
Highlights how embedded dashboards improve workflow management, team effectiveness, and project prioritization.


