
Solution for Digital Marketing
Improve campaign performance, optimize marketing spend, and measure ROI clearly with unified digital marketing analytics.
Digital marketing teams generate data across advertising platforms, web analytics, social media, email tools, and CRM systems. When this data is reviewed in isolation, teams struggle to measure true performance, attribute results accurately, and scale what works.
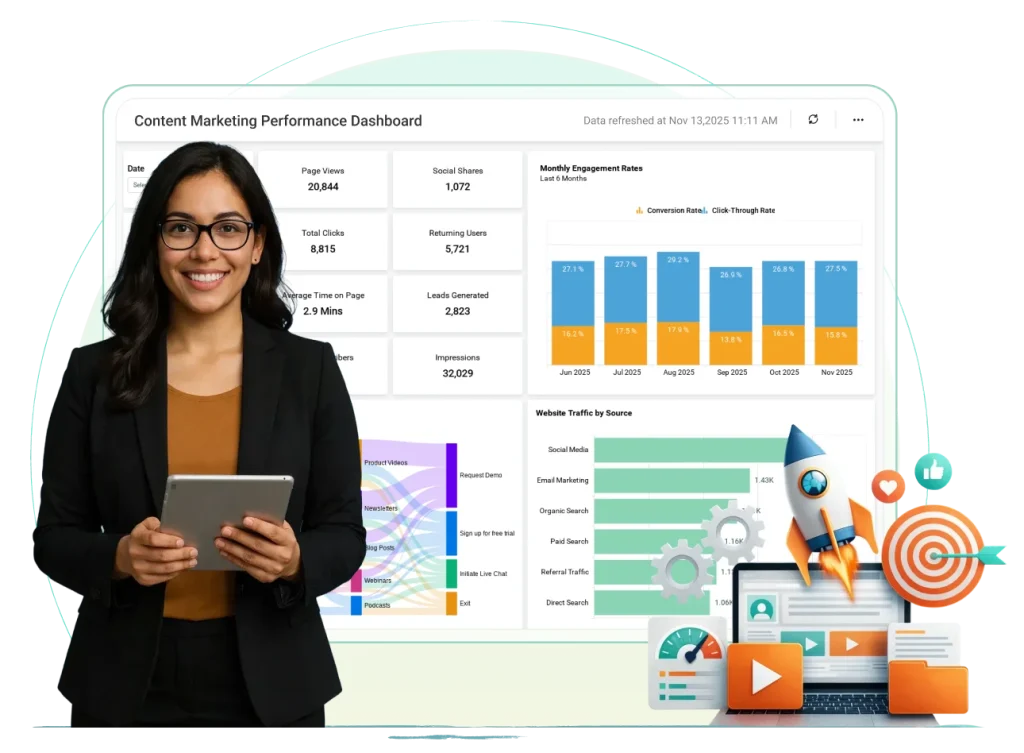
Digital Marketing
Bold BI brings digital marketing data into a single analytics platform, helping teams transform fragmented metrics into clear dashboards that support smarter planning, optimization, and ROI-focused decision-making.
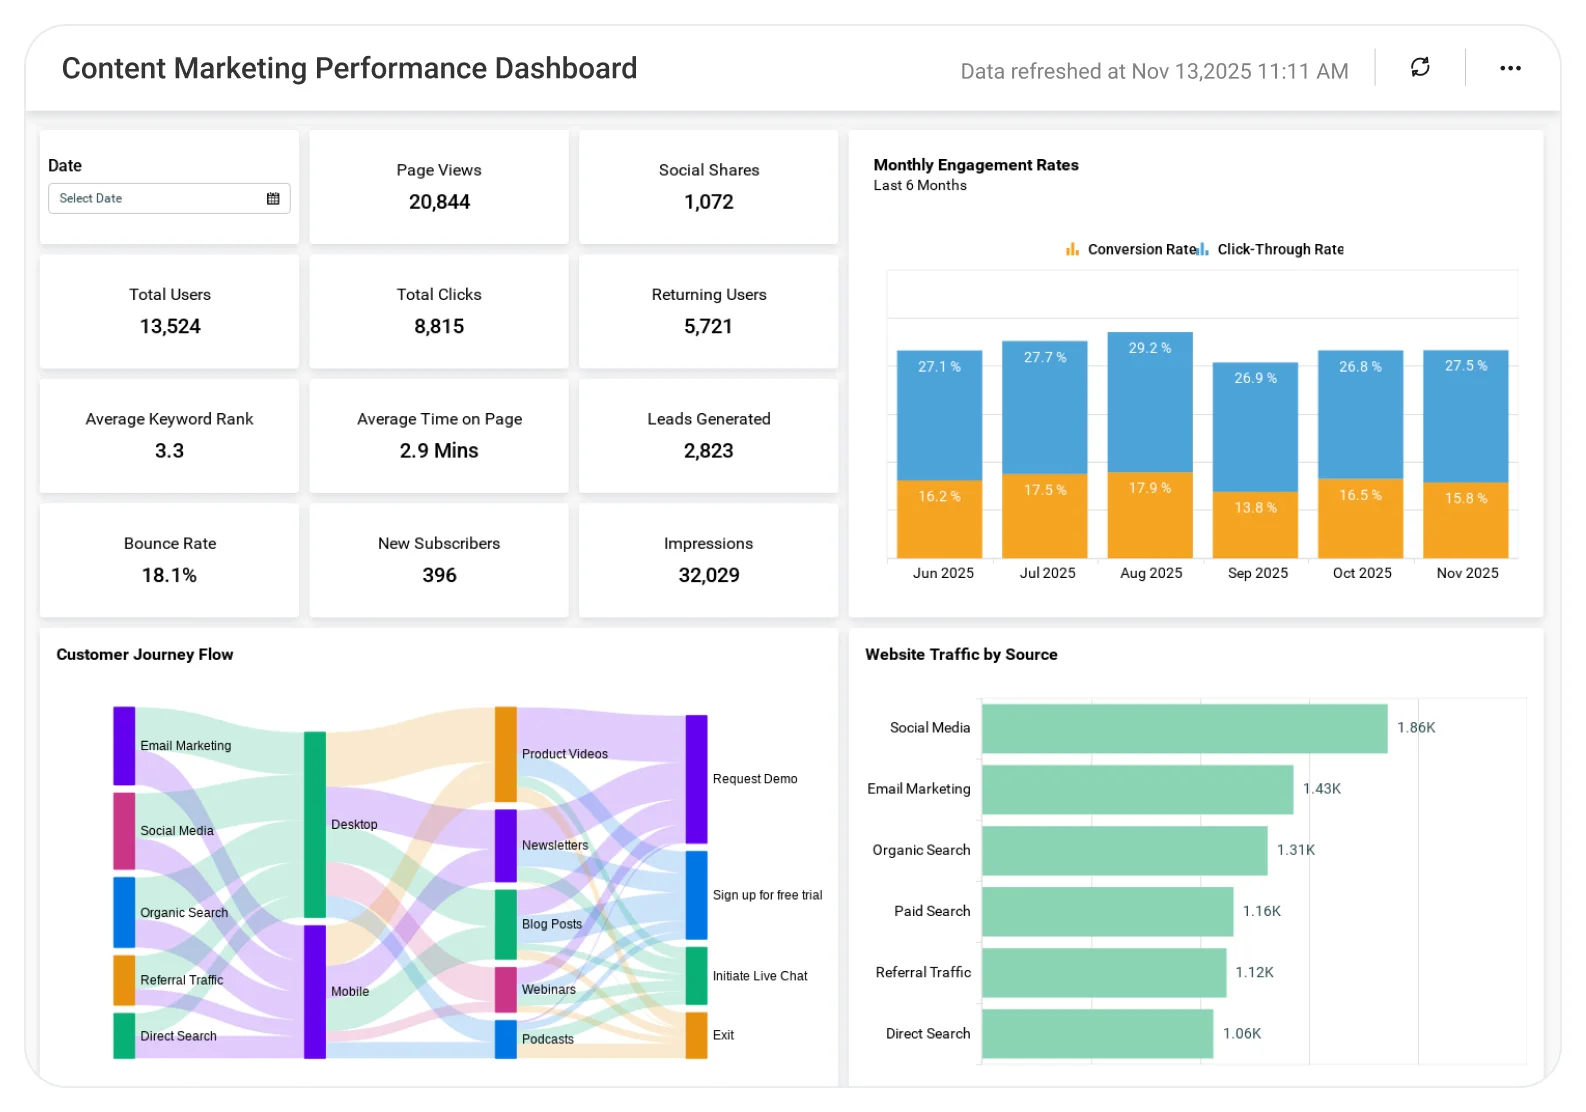
Why Digital Marketing Teams Choose Bold BI
Strong digital marketing performance depends on understanding how channels, campaigns, and content work together, using consistent metrics across platforms.
Bold BI enables marketing teams to:
- Unify cross-channel marketing data: Combine paid ads, organic traffic, email, social, and conversion data into one analytics layer.
- Improve campaign and channel visibility: Evaluate performance across platforms using consistent metrics and benchmarks.
- Optimize spend and ROI decisions: Use historical and comparative insights to allocate budgets more effectively.
- Standardize reporting across teams and regions: Ensure consistent measurement for campaigns, channels, and geographies.
- Scale analytics as marketing programs grow: Apply one BI platform across multiple brands, regions, and digital channels.
What You’ll Track
- Campaign & channel performance: Analyze results across paid, organic, social, and email channels.
- Traffic, engagement & conversion metrics: Understand how users interact across funnels and touchpoints.
- Marketing spend & ROI indicators: Track cost efficiency, returns, and budget performance.
- Content & funnel effectiveness: Evaluate how content and landing pages contribute to outcomes.
All dashboards are fully customizable, allowing you to add KPIs or metrics as needed.
Bold BI for Digital Marketing – Common Metrics
With fully customizable digital marketing dashboards, teams can analyze:
- Campaign and channel performance metrics.
- Traffic, engagement, and conversion trends.
- Cost, ROI, and attribution indicators.
- Content and landing page performance.
- Funnel and customer journey insights.
- Period-over-period and campaign comparisons.
Dashboards can be tailored for different marketing goals while maintaining a shared data foundation.
How It Works
- Connect data from ad platforms, analytics tools, CRM, email systems, Excel, SQL, or Web APIs.
- Use pre-built digital marketing dashboards or design custom analytics views.
- Combine campaign, traffic, and conversion data into unified models.
- Share dashboards securely across marketing and leadership teams.
- Configure alerts and thresholds for key performance indicators.
Trusted & recognized
Analytics that wins awards and users
Recognized by G2, TrustRadius, and Visual Studio Magazine for delivering standout performance and value.
I appreciate Bold BI for making it easier to provide reporting for our customers, allowing both our analysts and customers to easily build and publish reports. The ability to build dashboards and modify queries for specific outcomes is very user-friendly. I value the mobile readiness of the app and its integration capabilities with API structures. The addition of AI features is impressive. The economic pricing model and the effective partnership, which includes consistent and helpful support, make it an invaluable tool for our OEM model.
The support from Bold is unmatched. They do not charge extra for support and it is excellent anyway. All our tickets and questions are quickly answered with authoritative and precise guidance. This is important at the product is complex, powerful and mature. To get the most out of the tool, the level of support they provide is essential.
It was easy to implement data visualizations into our product. The standard widgets allowed us to build professional looking dashboards, and a robust API provided excellent control of the development and runtime process from within our application.



Recognition







Frequently Asked Questions
Ready to Get Started?
Start your 30-day free trial instantly
Easy integration, AI-Powered Dashboards and 24x5 real-time support.