
Animal Healthcare
Animal healthcare organizations manage large volumes of data across livestock health, treatments, and farm operations. Without a centralized view, it becomes difficult to identify risks early and improve outcomes. A unified dashboard helps teams analyze performance clearly and make informed decisions with confidence.
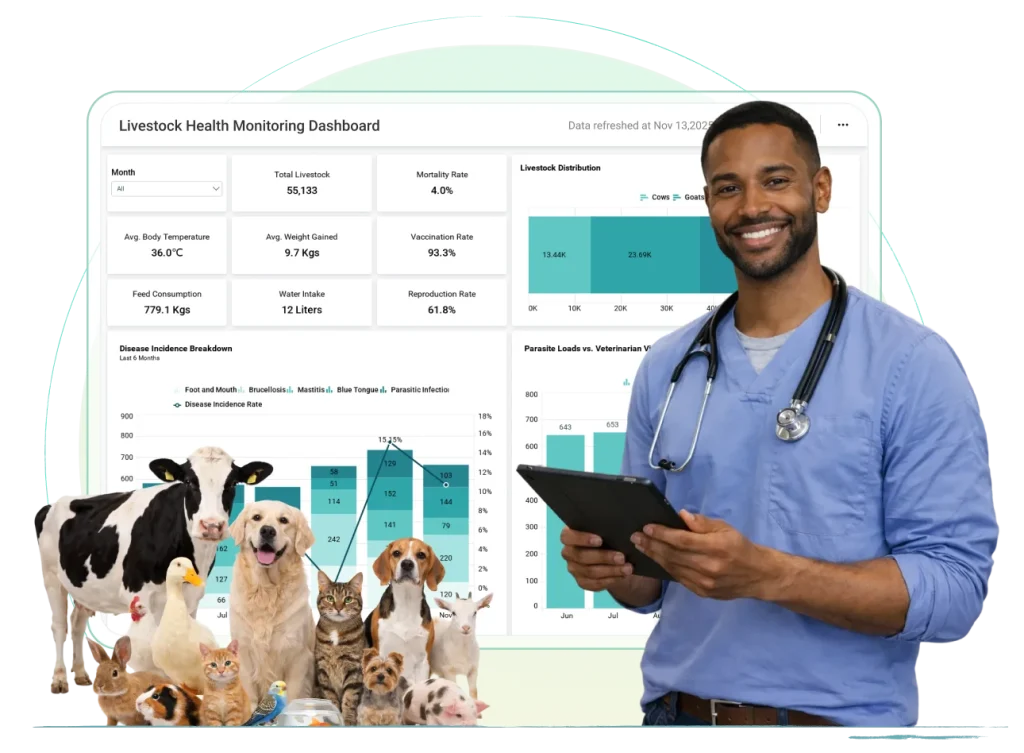
Animal Healthcare
Bold BI brings animal health, operational, and performance data into a single analytics platform, helping teams gain clear insights that improve care quality and operational efficiency.
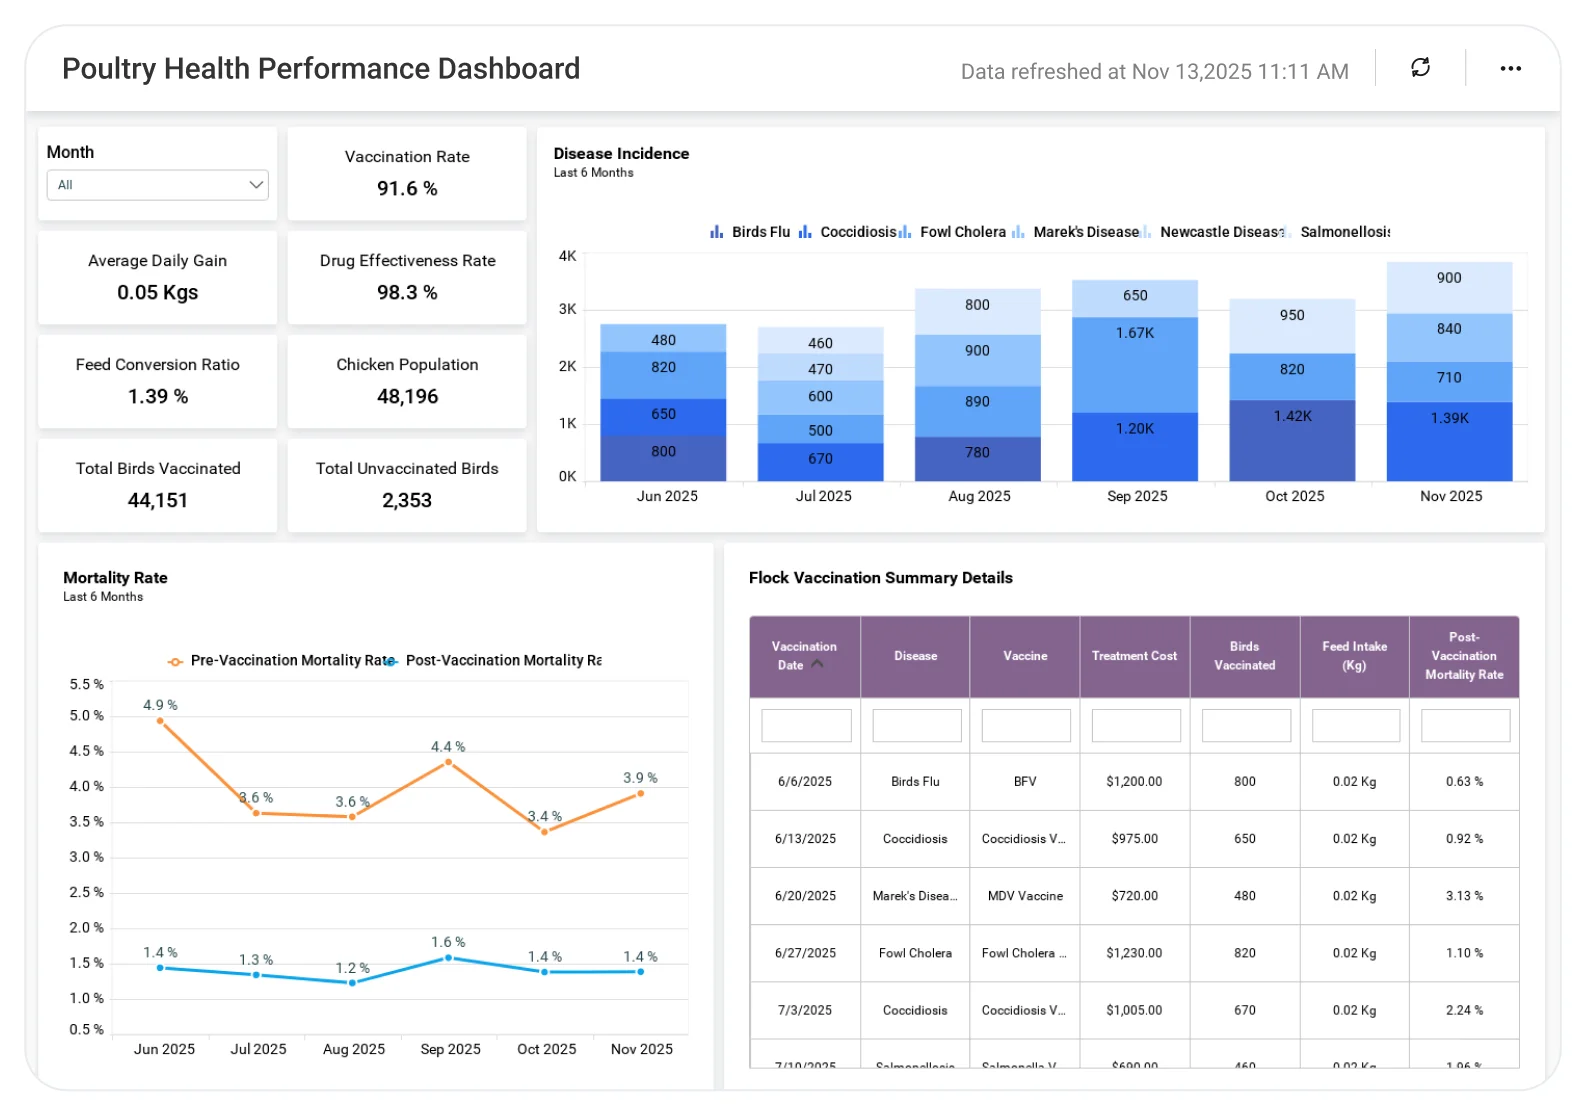
Poultry Health Performance Dashboard
Analyze poultry flock health and mortality patterns to improve productivity and reduce losses.
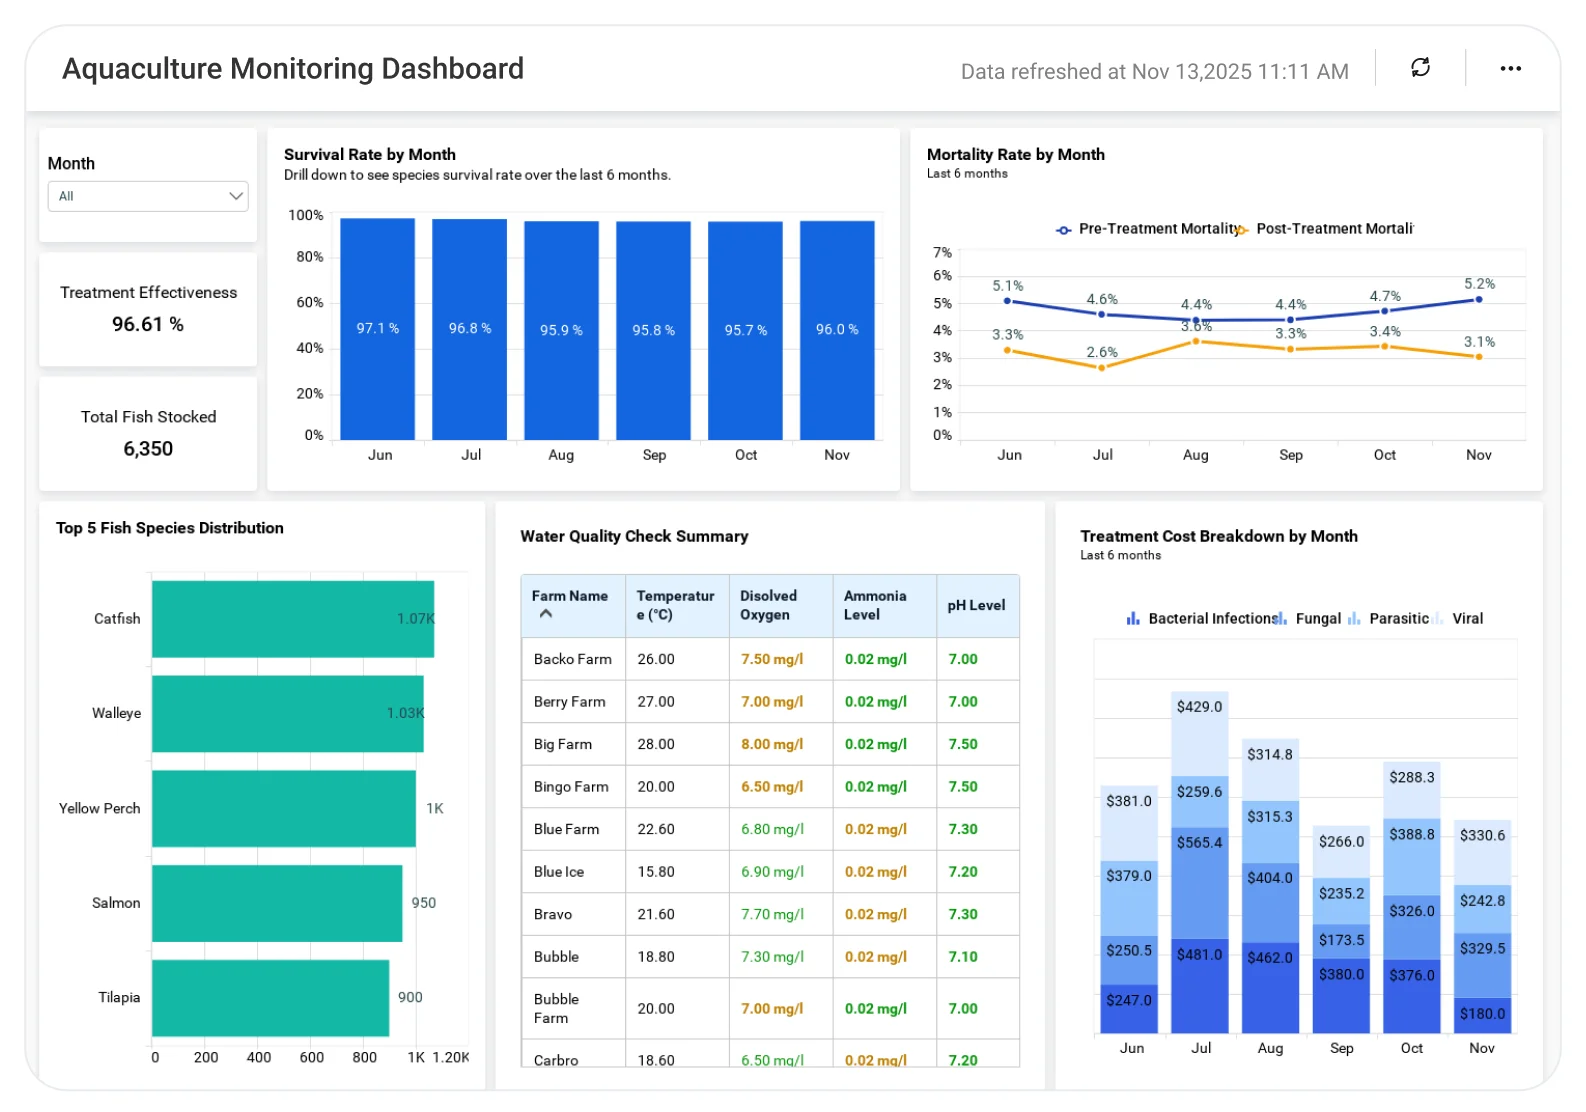
Aquaculture Monitoring Dashboard
Track water quality and monitor oxygen levels to maintain healthy aquatic environments.
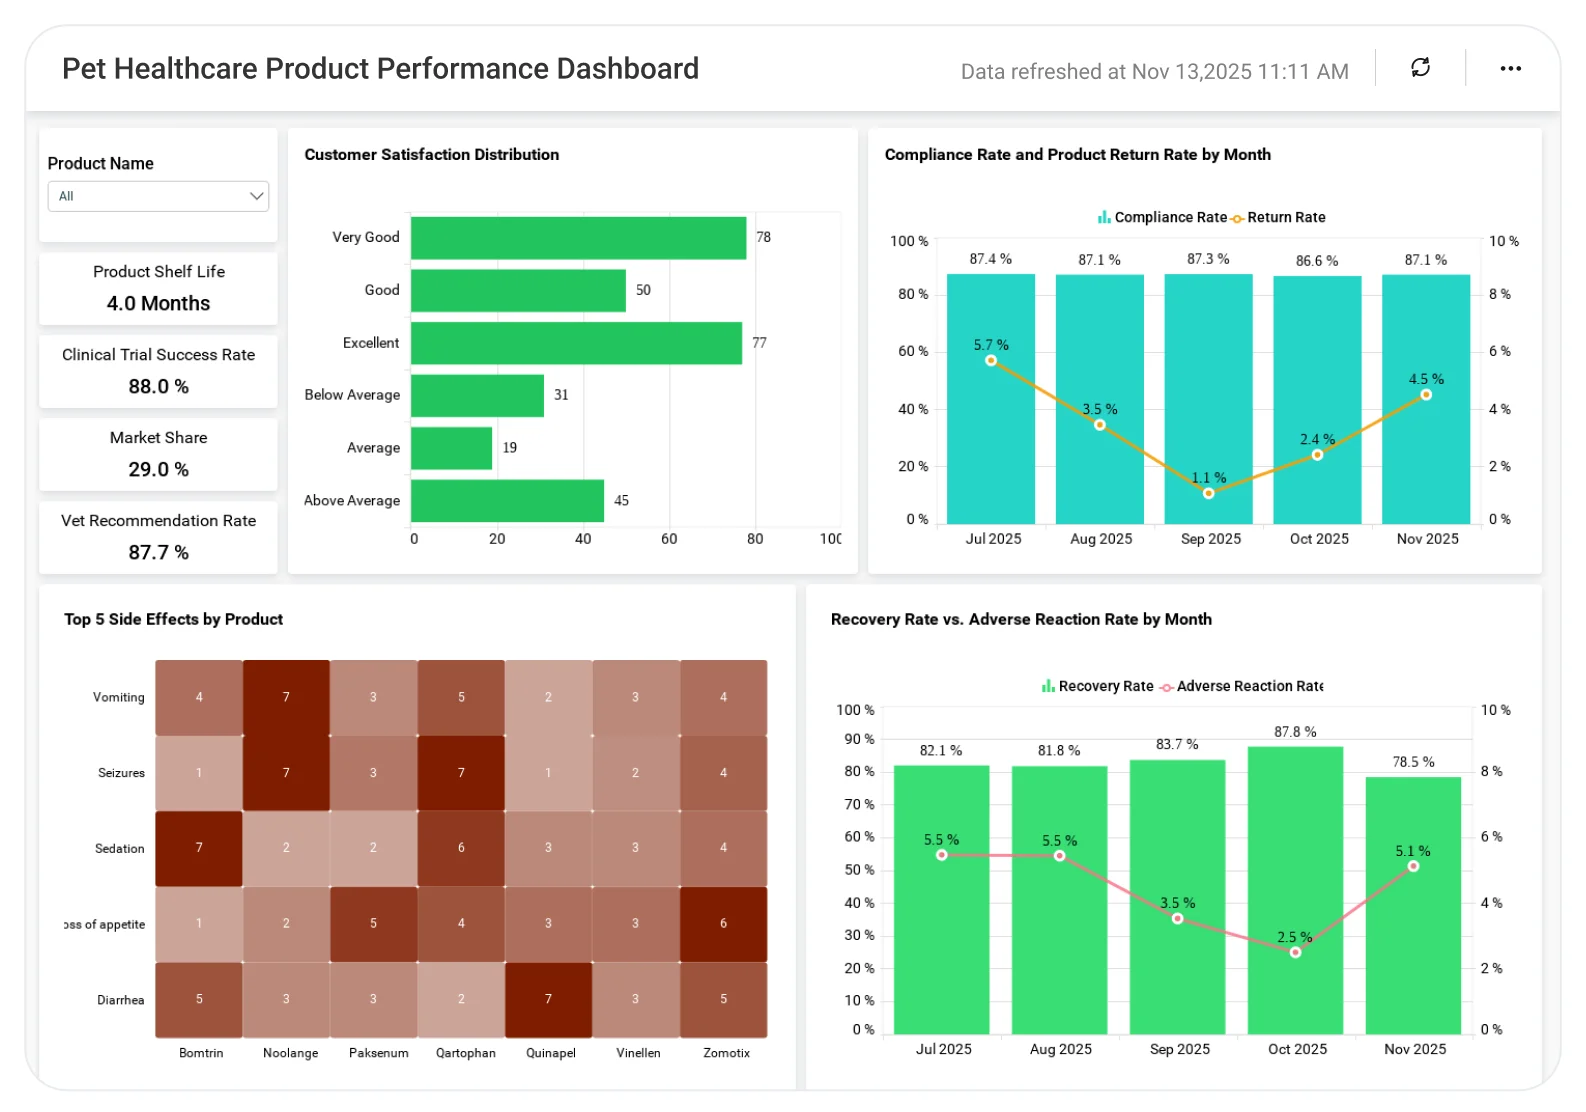
Pet Healthcare Product Performance Dashboard
Track livestock healthcare product performance to drive better health product decisions.
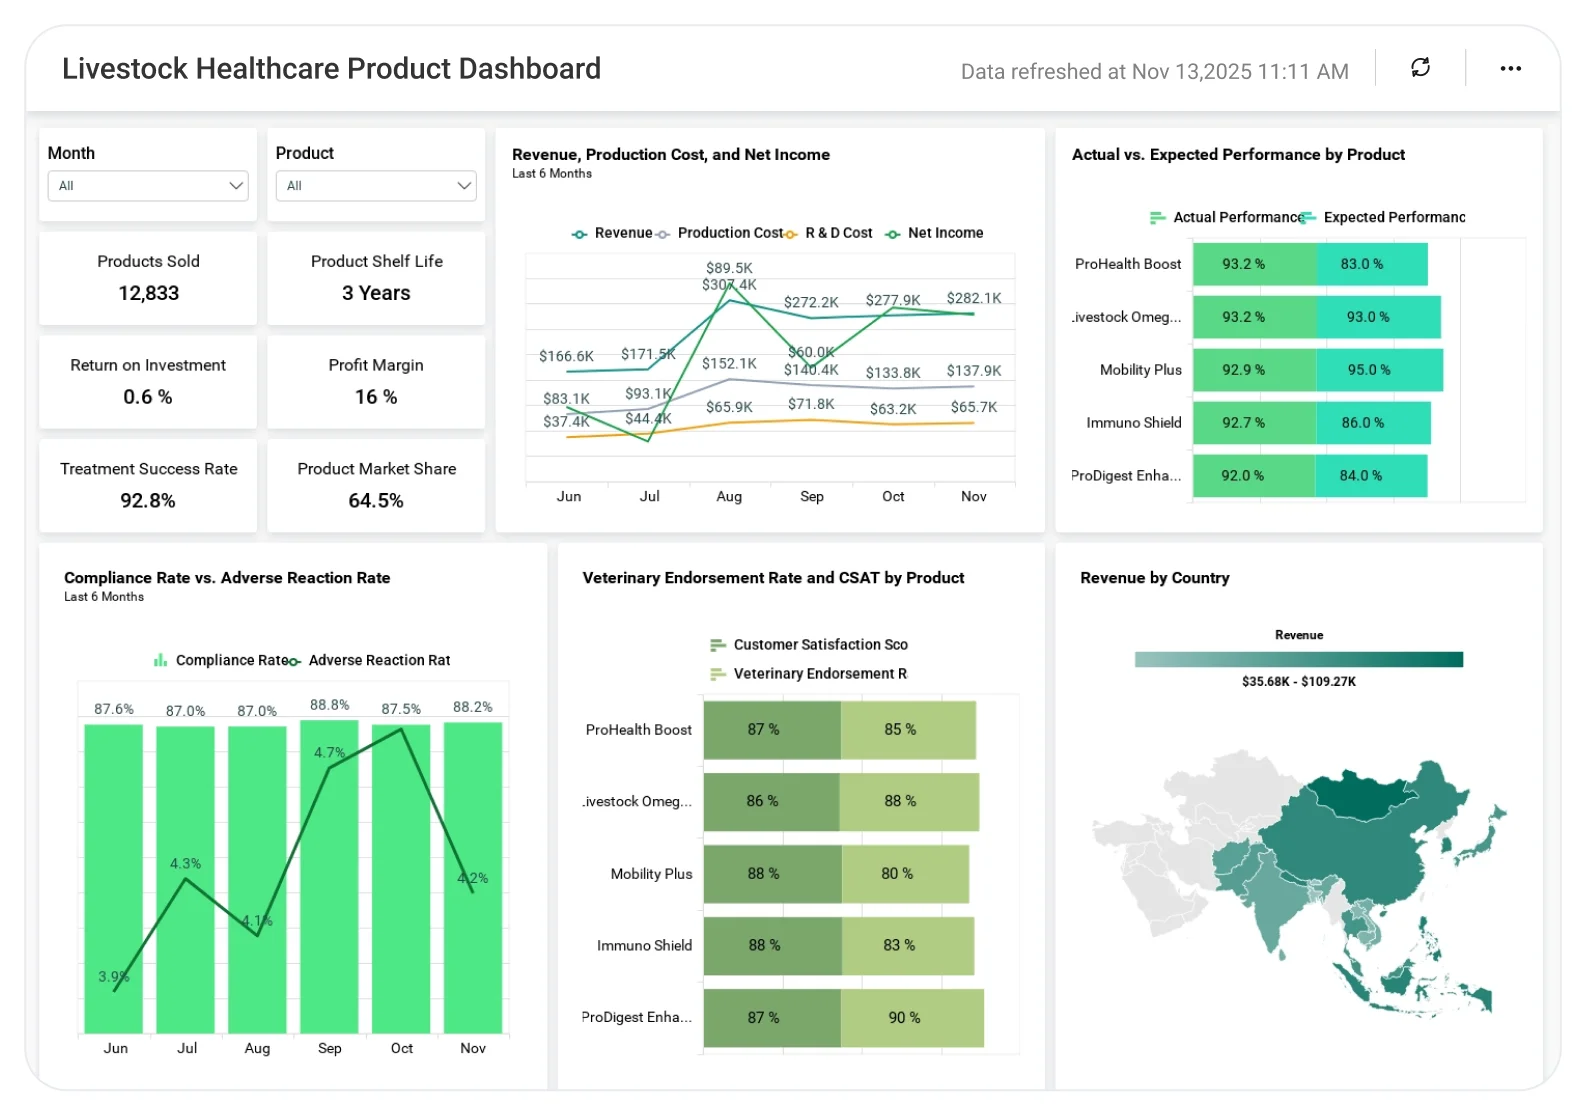
Livestock Healthcare Product Dashboard
Track livestock healthcare product performance to drive better health product decisions.
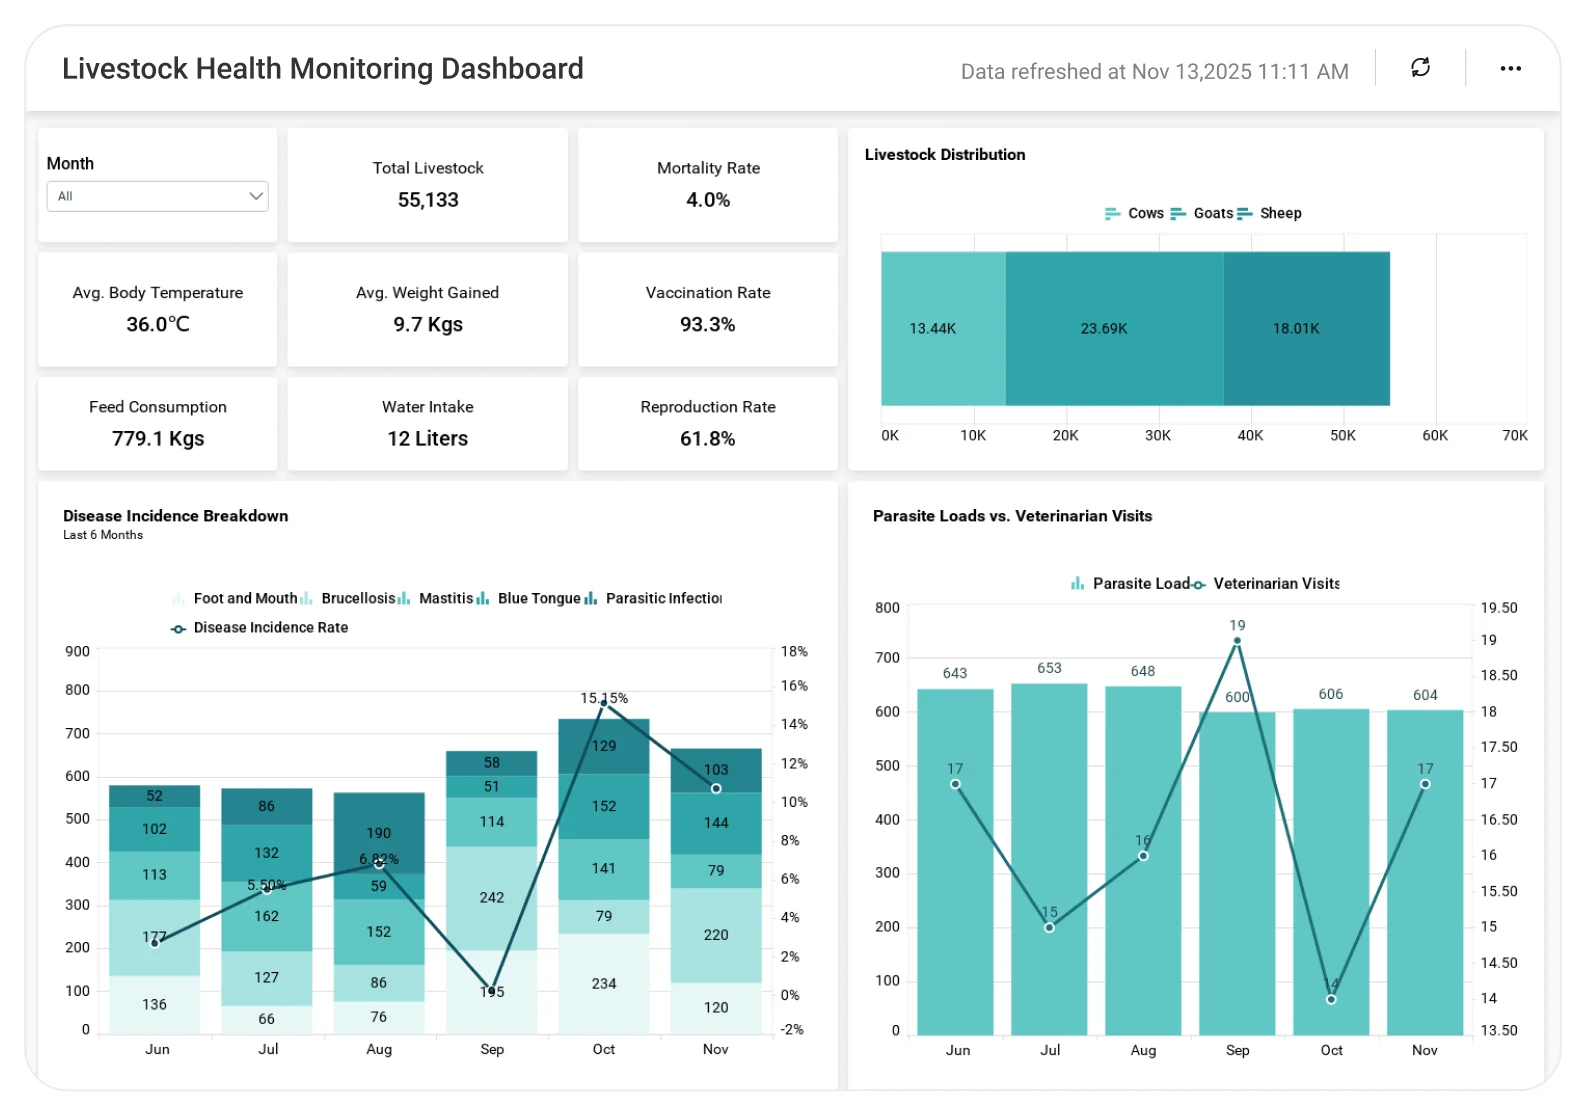
Livestock Health Monitoring Dashboard
Monitor livestock health conditions to improve animal welfare and farm productivity.
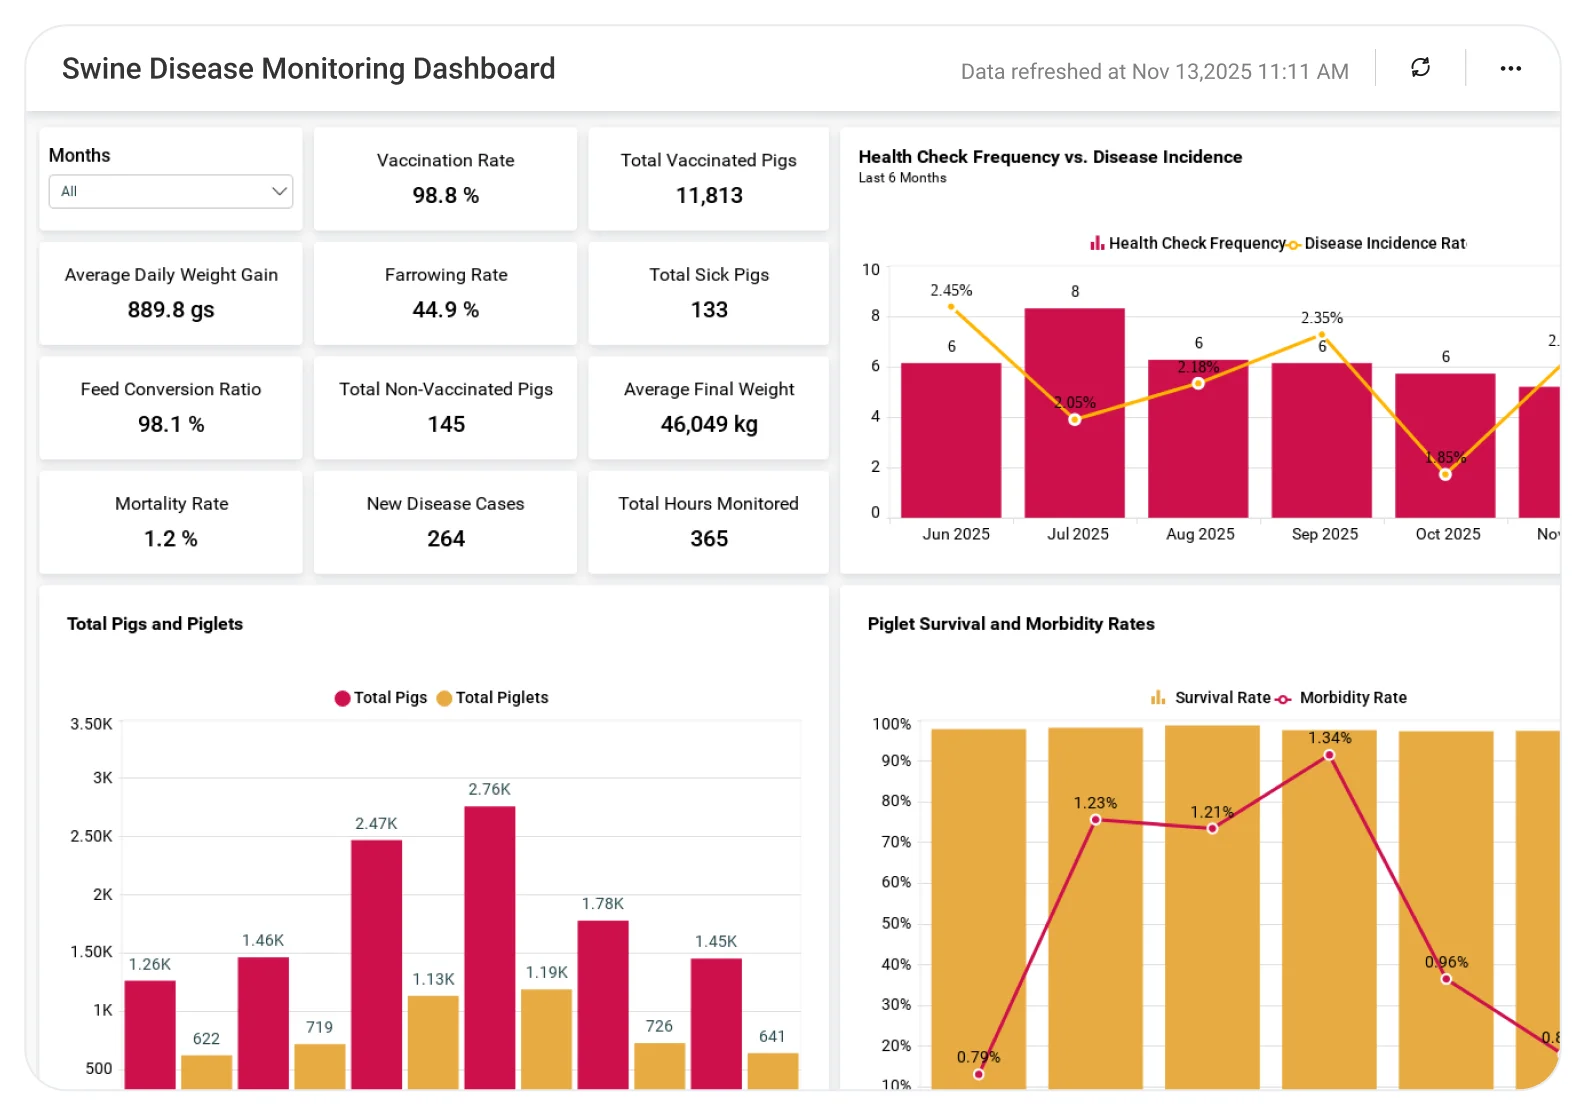
Swine Disease Monitoring Dashboard
Track swine disease data, control outbreaks, and optimize health check frequency for better disease management strategies.
Why Animal Healthcare Organizations Choose Bold BI
Animal healthcare data often exist across farm systems, IoT devices, veterinary records, spreadsheets, and third-party tool thus creating visibility gaps and slowing decisions.
Bold BI enables animal healthcare teams to:
- Unify animal health and operational data: Combine health indicators, treatments, and farm performance metrics into one analytics layer.
- Detect trends and risks earlier: Identify abnormal patterns and emerging issues before they impact outcomes or productivity.
- Improve consistency across operations: Standardize how health and performance metrics are viewed across farms, clinics, and regions.
- Support informed care and prevention strategies: Use historical and comparative insights to improve treatment planning and preventive programs.
- Scale analytics across animal healthcare use cases: Apply one BI platform across livestock, poultry, aquaculture, and pet healthcare operations.
What You’ll Track
- Animal health & disease trends: Track disease occurrence, recovery patterns, and health indicators across species and locations.
- Operational & productivity metrics: Analyze mortality rates, growth patterns, and efficiency to improve outcomes and planning.
- Environmental & condition indicators: Understand how factors like feed, water, and environment influence animal health.
- Farm, product & region-level performance: Compare results across farms, healthcare products, animal types, and geographies.
All dashboards are fully customizable so you can add KPIs or metrics as needed.
Bold BI for Animal Healthcare – Common Metrics
With fully customizable dashboards, animal healthcare teams can analyze:
- Animal and herd health indicators.
- Disease incidence and recovery trends.
- Environmental and operational conditions.
- Mortality and morbidity rates.
- Treatment effectiveness and medication usage.
- Healthcare product performance.
- Farm-wise, species-wise, and region-wise comparisons.
Dashboards can be adapted for different teams and use cases while keeping metrics consistent across the organization.
How It Works
- Connect data from farm systems, veterinary tools, IoT sensors, Excel, SQL, or Web APIs.
- Use ready-to-deploy animal healthcare dashboards or build custom views.
- Combine health, environmental, and operational data into unified analytics models.
- Share dashboards securely with teams and leadership.
- Configure alerts and thresholds for early risk awareness.
Trusted & recognized
Analytics that wins awards and users
Recognized by G2, TrustRadius, and Visual Studio Magazine for delivering standout performance and value.
I appreciate Bold BI for making it easier to provide reporting for our customers, allowing both our analysts and customers to easily build and publish reports. The ability to build dashboards and modify queries for specific outcomes is very user-friendly. I value the mobile readiness of the app and its integration capabilities with API structures. The addition of AI features is impressive. The economic pricing model and the effective partnership, which includes consistent and helpful support, make it an invaluable tool for our OEM model.
The support from Bold is unmatched. They do not charge extra for support and it is excellent anyway. All our tickets and questions are quickly answered with authoritative and precise guidance. This is important at the product is complex, powerful and mature. To get the most out of the tool, the level of support they provide is essential.
It was easy to implement data visualizations into our product. The standard widgets allowed us to build professional looking dashboards, and a robust API provided excellent control of the development and runtime process from within our application.



Recognition



Frequently Asked Questions
Ready to Get Started?
Start your 30-day free trial instantly
Easy integration, AI-Powered Dashboards and 24x5 real-time support.