
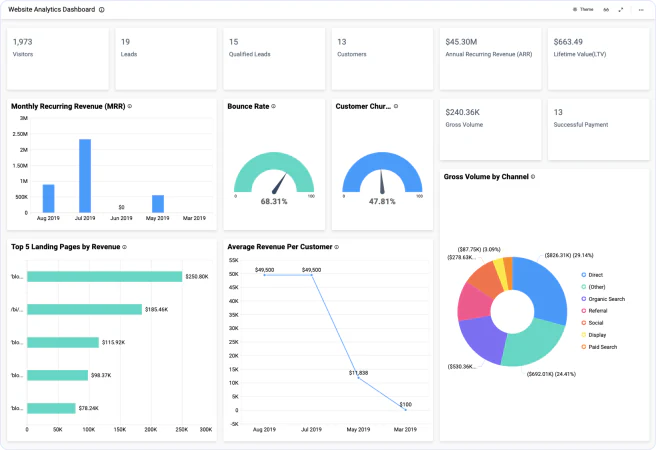

Bold BI dashboard designer supports connecting Stripe web services through REST API.
Build dashboards using Stripe data to get a more informed view of your metrics. 

Bring your Stripe data to Bold BI® and create beautiful dashboards with useful widgets. By embedding dashboards inside your application, you can visualize the story behind your data and make effective business decisions.
You can choose the relevant API endpoints provided to fetch data from the Stripe account.
Create your own query URL that retrieves data from the Stripe account.
Join the Stripe data with data from different sources using shared tables.
Configure data refreshes to keep your dashboard up to date.
Combine Stripe data with other integrations, like SQL or web data sources, and create dashboards with multiple data sources. Embed these dashboards into your applications for powerful data visualization. You can combine Stripe and other solutions, like Google Analytics, to monitor online business revenue performance and get insights on your marketing strategy . For example, by integrating Stripe's business revenue performance with Google Analytics' website analytical service, you can monitor a wide range of KPIs and metrics, from website conversion data to business revenue performance. With this mash up, you have all your metrics visualized in one place for better decision-making.
Integrations
Your data, wherever it lives. SQL databases, REST APIs, cloud warehouses, flat files, and SaaS tools connect without a custom pipeline.





Explore Bold BI with a 30-day free trial. Embed dashboards, connect data sources, and empower your team with actionable insights.
No credit card required.