webinar announcement icon

announcement icon Webinar - 9th Apr 2026, 10:00 AM ET

Webinar: Personalizing Dashboards with Role-Based Access and Row-Level Security

webinar banner line

10:00 AM ET

9th Apr, 2026

banner line />
         </div>
         
          <div class= Register Now

Release Announcement:

Bold BI 15.3.8 has arrived! Explore the latest features here.

Overview

Bring your Intervals data to Bold BI® and create beautiful dashboards with useful widgets. By embedding dashboards inside your application, you can visualize the story behind your data and make effective business decisions.

Custom URL

Custom URL

Create your query URL with valid REST API Endpoints that retrieves data from the Intervals account.

Pagination

Pagination

Set the maximum number of rows to be fetched from Intervals connector.

Joining Data

Joining Data

Join the Intervals data with data from different sources using shared tables.

Refresh Data

Refresh Data

Configure data refresh to keep your dashboard up to date.

Intervals Dashboard Example

Intervals Project Management Dashboard

Intervals Project Management Dashboard

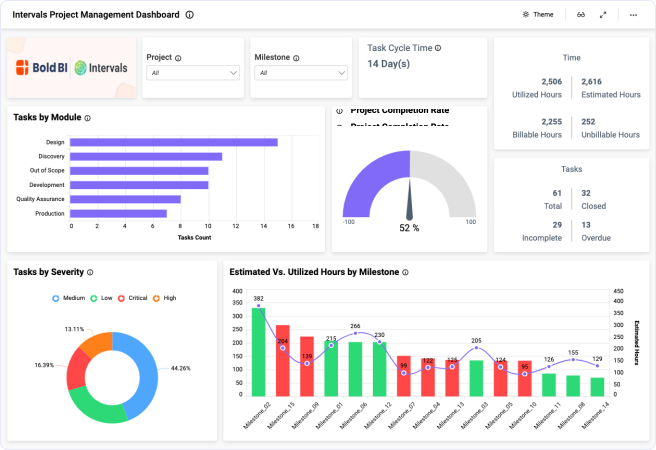
By integrating Intervals data, Bold BI's Intervals Project Management Dashboard provides a complete view of your project development and task management metrics, which enable you to monitor project performance trends.

The Intervals Project Management Dashboard helps you track the status of each project. By creating unique dashboards, project team leads can monitor their team projects and identify opportunities for better performance.

  • Total, Completed, Incomplete, and Overdue Tasks
  • Utilized, Estimated, Billable and Unbillable Hours
  • Project Completion Rate and Task Cycle Time
  • Completed vs. Incomplete Tasks by Projects
  • Incomplete Tasks by Assignee
  • Billable vs. Unbillable Hours by Assignee
  • Task Count by Module, Task Summary and Tasks by Severity
  • Estimated and Utilized Hours by Project
  • Estimated and Utilized Hours by Milestone

Integration Mashups with Intervals Data

Combine Intervals data with other integrations, like SQL or web data sources, and create dashboards with multiple data sources. Embed these dashboards into your applications for powerful data visualization.

Data Source List

Check Out Our 150+ Supported Integrations

Smarter Dashboards, Faster Decisions

Explore Bold BI with a 30-day free trial. Embed dashboards, connect data sources, and empower your team with actionable insights.

No credit card required.