
Bold BI Dashboard Designer supports connecting Snowflake database through SQL Live query.
Build dashboards using Snowflake data to get a more informed view of your metrics. 
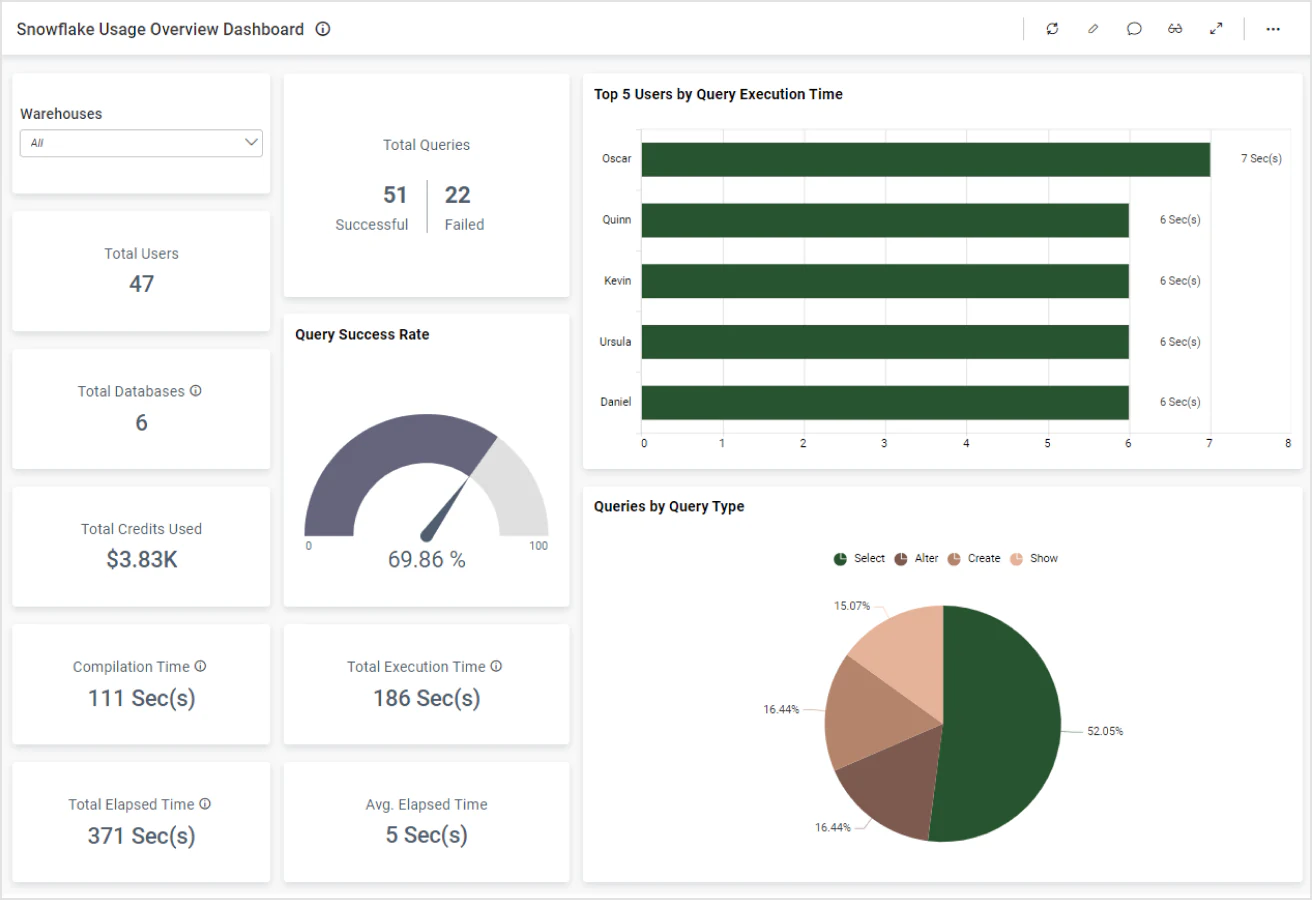
Bring your Snowflake data to Bold BI® and create beautiful dashboards with useful widgets. By embedding dashboards inside your application, you can visualize the story behind your data and make effective business decisions.
Create a connection with a Snowflake data source using live or extract modes.
Enter your own SQL query to create a connection with manually written queries instead of manually dragged tables.
Combine Snowflake data with data from different sources using shared tables.
Configure data refresh to keep your dashboard up to date.
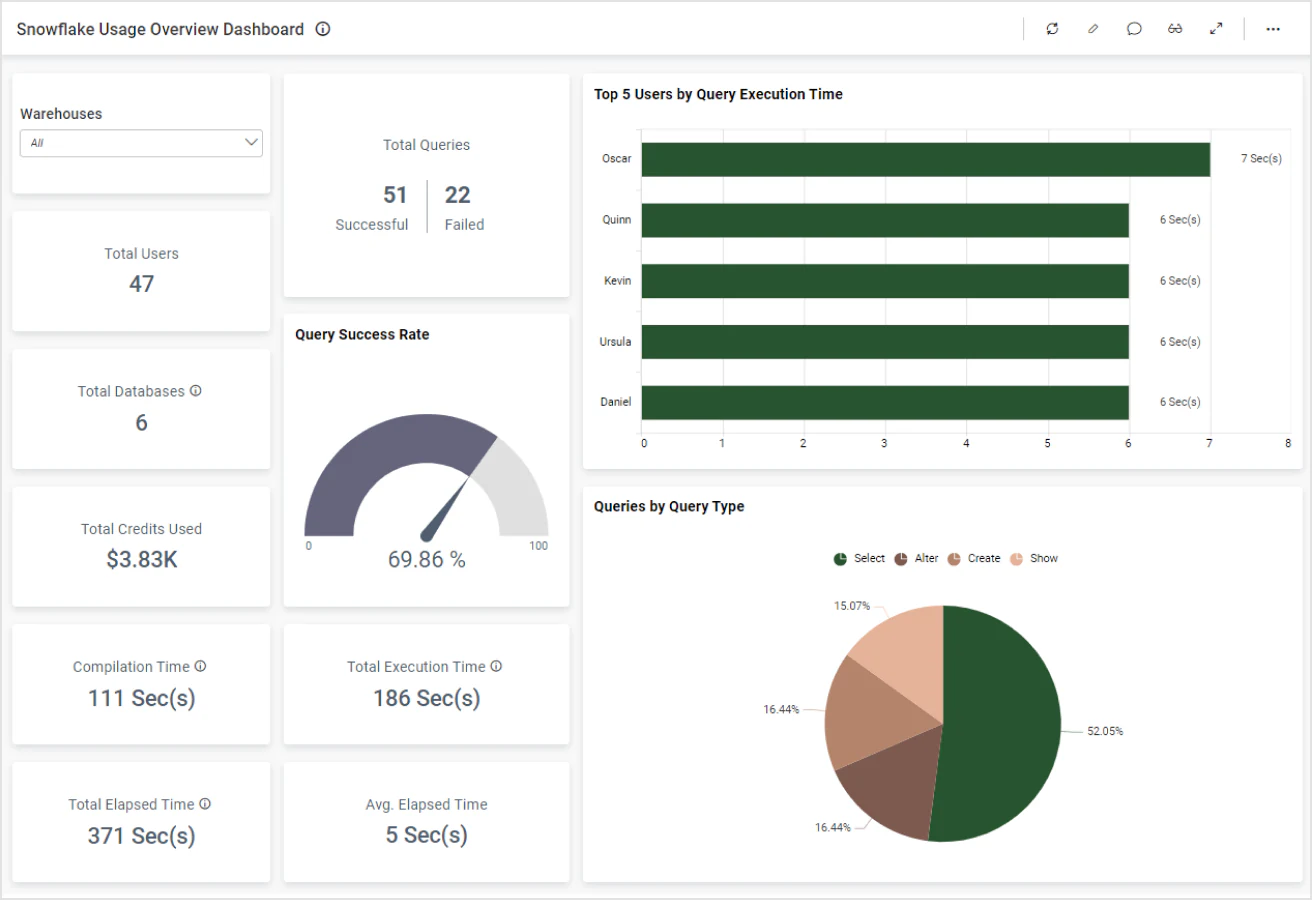
The Snowflake Usage Dashboard provides a real-time snapshot of data processing, query performance, and user activity within Snowflake. It assists in optimizing current usage and assessing efficiency.
Combine Snowflake data with other integrations, like SQL or web data sources, and create dashboards with multiple data sources. Embed these dashboards into your applications for powerful data visualization.
Integrations
Your data, wherever it lives. SQL databases, REST APIs, cloud warehouses, flat files, and SaaS tools connect without a custom pipeline.





Explore Bold BI with a 30-day free trial. Embed dashboards, connect data sources, and empower your team with actionable insights.
No credit card required.