

Top 10 Finance Dashboards for Global Businesses

TL;DR: Finance dashboards give global businesses a centralized, real-time view of financial performance across regions and currencies. They help leaders improve forecasting, manage risk, and make faster, data-driven decisions. With tools like Bold BI, organizations can model powerful finance dashboards that simplify complexity and drive smarter financial outcomes.
In today’s fast-moving global economy, financial leaders face intense pressure to make quick, data-driven decisions in multiple markets. From navigating dynamic exchange rates to managing compliance across borders, the complexity of international finance demands smarter, faster tools. Finance dashboards help solve this challenge by providing real-time insights from centralized data, empowering global businesses make informed decisions and avoid costly errors. In this blog, we will highlight 10 powerful finance dashboard examples that businesses can use as models to help solve these challenges.
Why Global Businesses Need Finance Dashboards
Finance dashboards offer a centralized view where accountants can monitor and analyze market data efficient
Centralized financial visibility
Finance dashboards consolidate data from multiple departments, regions, and systems into one view. This helps leadership monitor performance holistically and make informed decisions faster.
Real-time decision-making
With live data feeds, dashboards provide up-to-the-minute metrics for revenue, expenses, and profitability. This enables businesses to react quickly to changes and avoid delays caused by outdated reports.
Improved financial forecasting
Dashboards help track trends and historical data, making it easier to project future performance. This supports better budgeting, resource allocation, and strategic planning.
Enhanced accountability and transparency
By visualizing KPIs and financial metrics, dashboards make it easier to track team performance and spending. This promotes accountability across departments and ensures transparency in financial operations.
Early detection of financial risks
Dashboards can flag anomalies or underperformance early, such as rising costs or declining margins. This allows businesses to take corrective action before issues escalate.
10 Financial Dashboard Examples in Bold BI
The following dashboards were created in Bold BI® for the financial sector. Take a look at what you can do with the platform’s features.
1. The Balance Sheet Dashboard
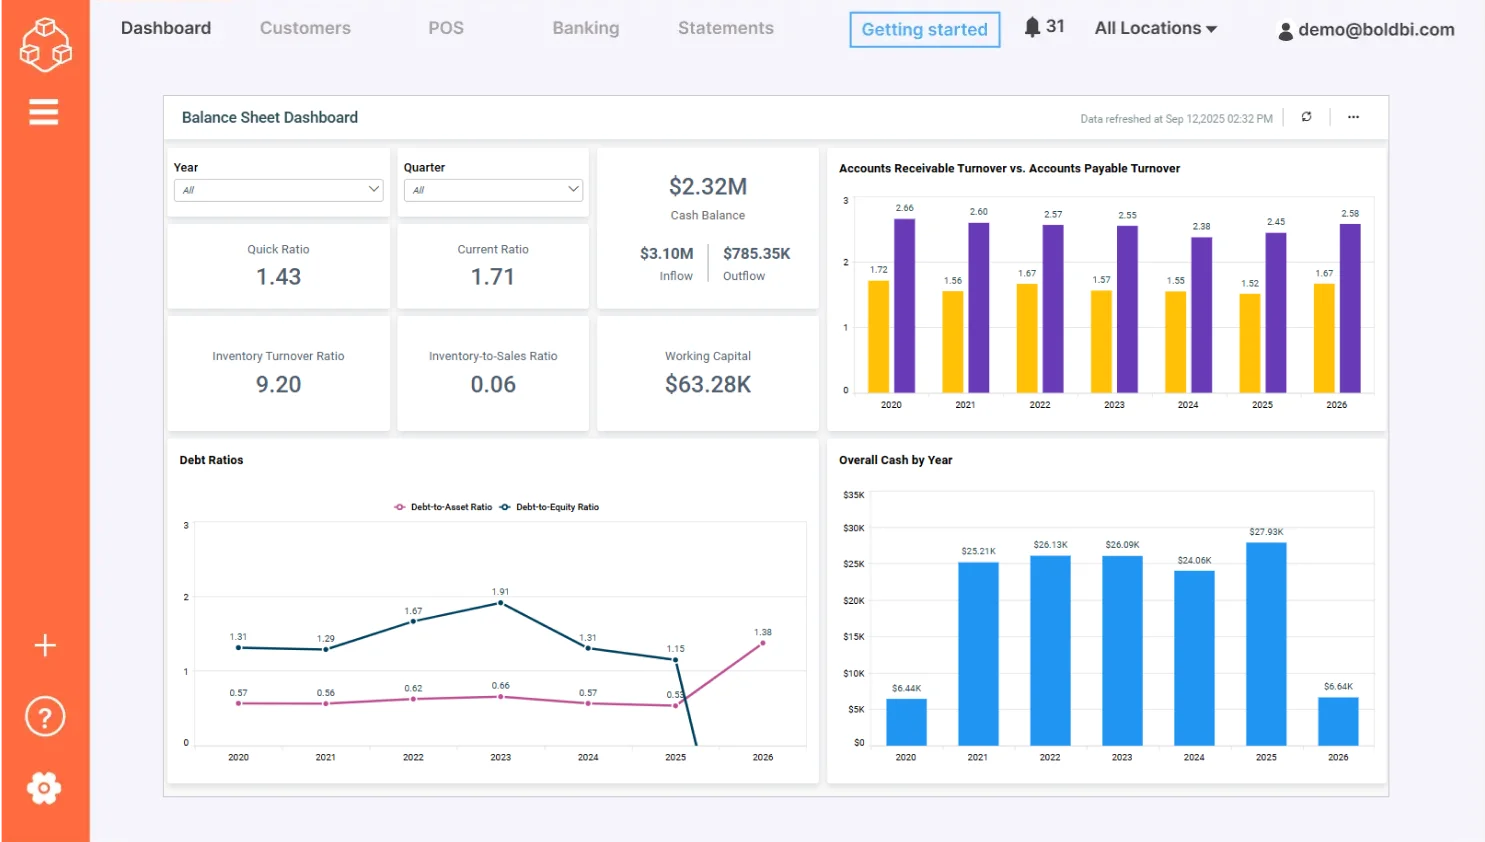
Many users have difficulties combining assets, liabilities, and equity across departments, especially when dealing with multiple currencies. The Balance Sheet Dashboard solves this challenge by providing a unified, real-time view of the finance position of a business. It allows users to monitor the total working capital, cash balance, and debt-to-asset ratio from a single dashboard for faster, more accurate finance analysis.
2. Keap Revenue Analysis Dashboard
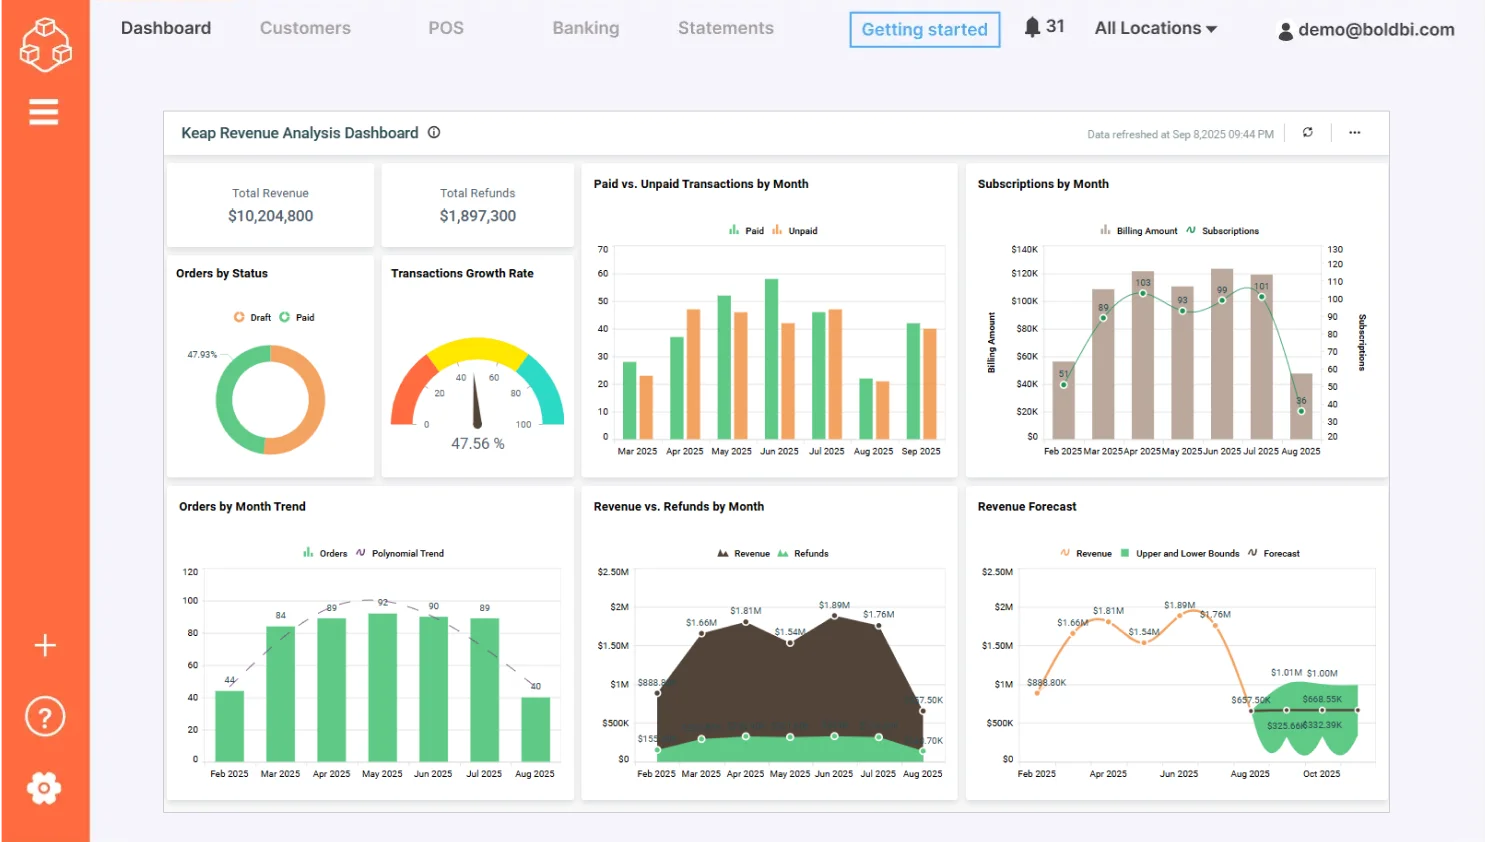
Sales teams often struggle to connect campaign efforts directly to revenue outcomes, especially when data is scattered across platforms and lacks real-time visibility. The Keap Revenue Analysis Dashboard solves this challenge by integrating sales data into one centralized view. It allows users to track revenue growth, identify top-performing campaigns, and make data-driven decision.
3. Budget vs. Actual Dashboard
Finance leads often face the challenge of aligning their actual expenses with budget expectations, especially when operating across multiple markets and currencies. Fluctuating exchange rates, unexpected market shifts, and inconsistent data sources can make it difficult to track profitability and spending accurately. The Budget vs. Actual Dashboard addresses this issue by providing a clear, real-time comparison between planned budgets and actual outcomes. This helps accountants adjust strategies proactively and maintain control over finance performance.

4. QuickBooks Cash Flow Management Dashboard
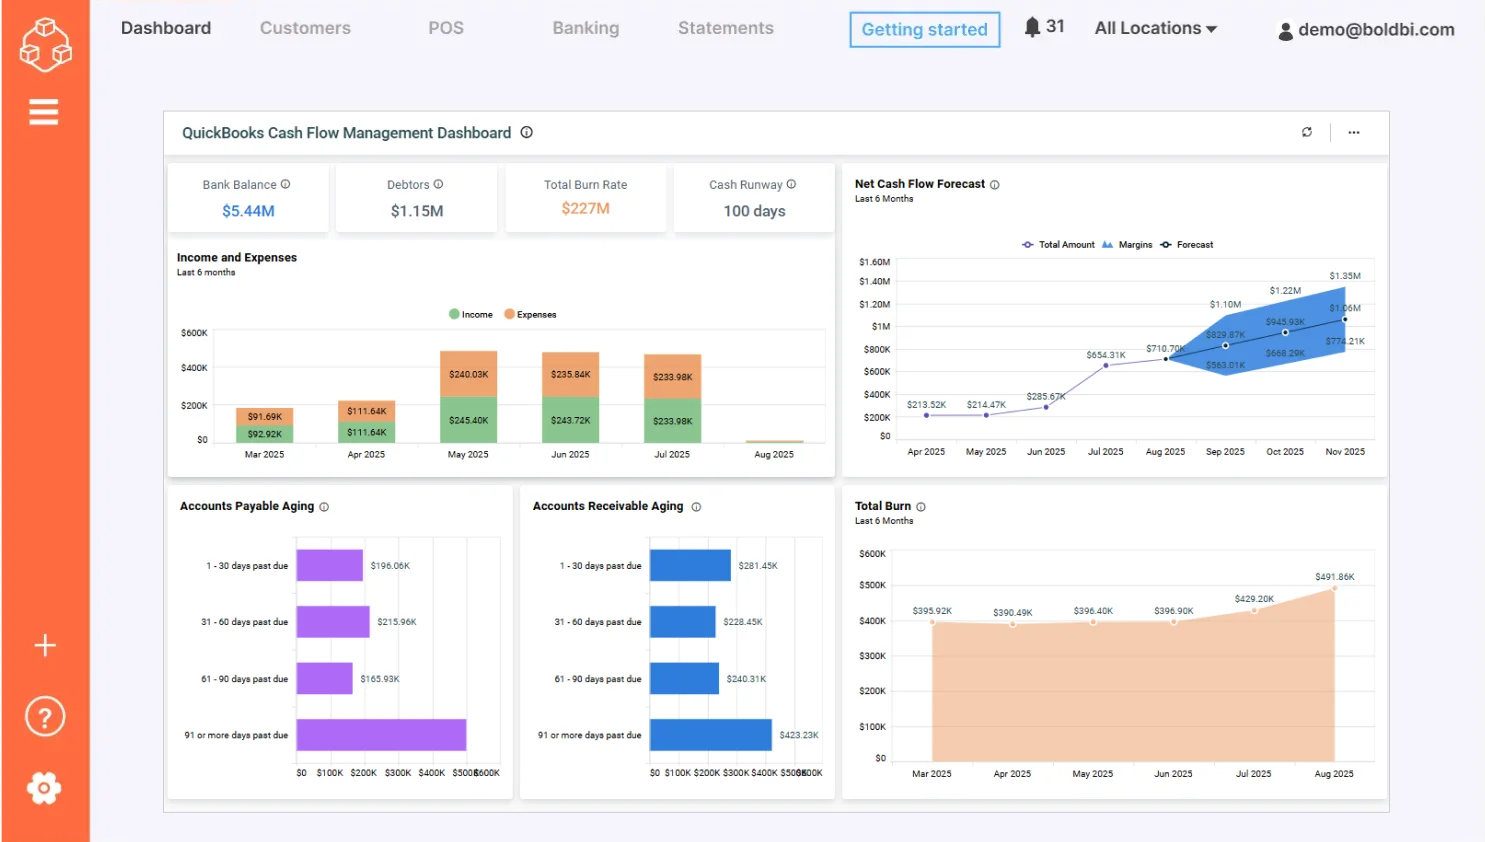
Finance departments often face the challenge of maintaining healthy cash flow while navigating unpredictable market conditions, fluctuating exchange rates, and inconsistent sources of income. These variables make it difficult to forecast liquidity and plan for short-term goals. The QuickBooks Cash Flow Management Dashboard addresses this by offering a real-time, visual overview of income vs. budget, cash inflows, and net cash flow forecast. It helps finance managers monitor financial health, identify potential setbacks, and make timely, data-driven decisions to ensure operational stability.
5. Financial Management Dashboard
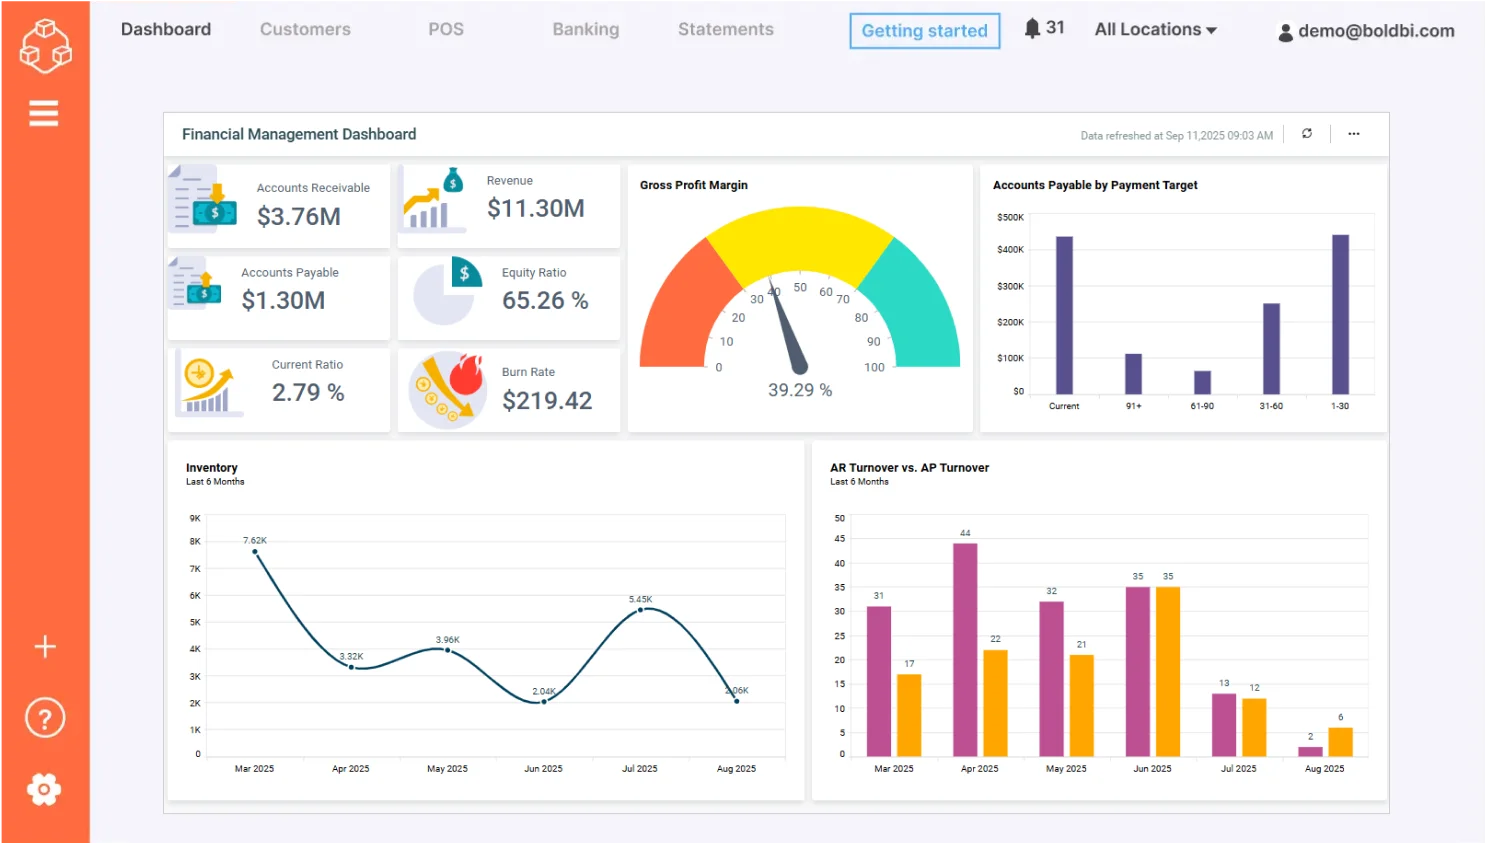
Finance departments often face the challenge of evaluating overall performance across multiple accounts, currencies, and time periods, especially when market conditions shift rapidly. Without a centralized view, it becomes difficult to track profitability, monitor key metrics, and make timely decisions. The Financial Performance Dashboard solves this by consolidating critical finance indicators, such as revenue, expenses, profit margins, and trends, into a single, interactive interface. This empowers accountants to assess performance in real time, identify areas of concern, and adjust strategies quickly to stay competitive.
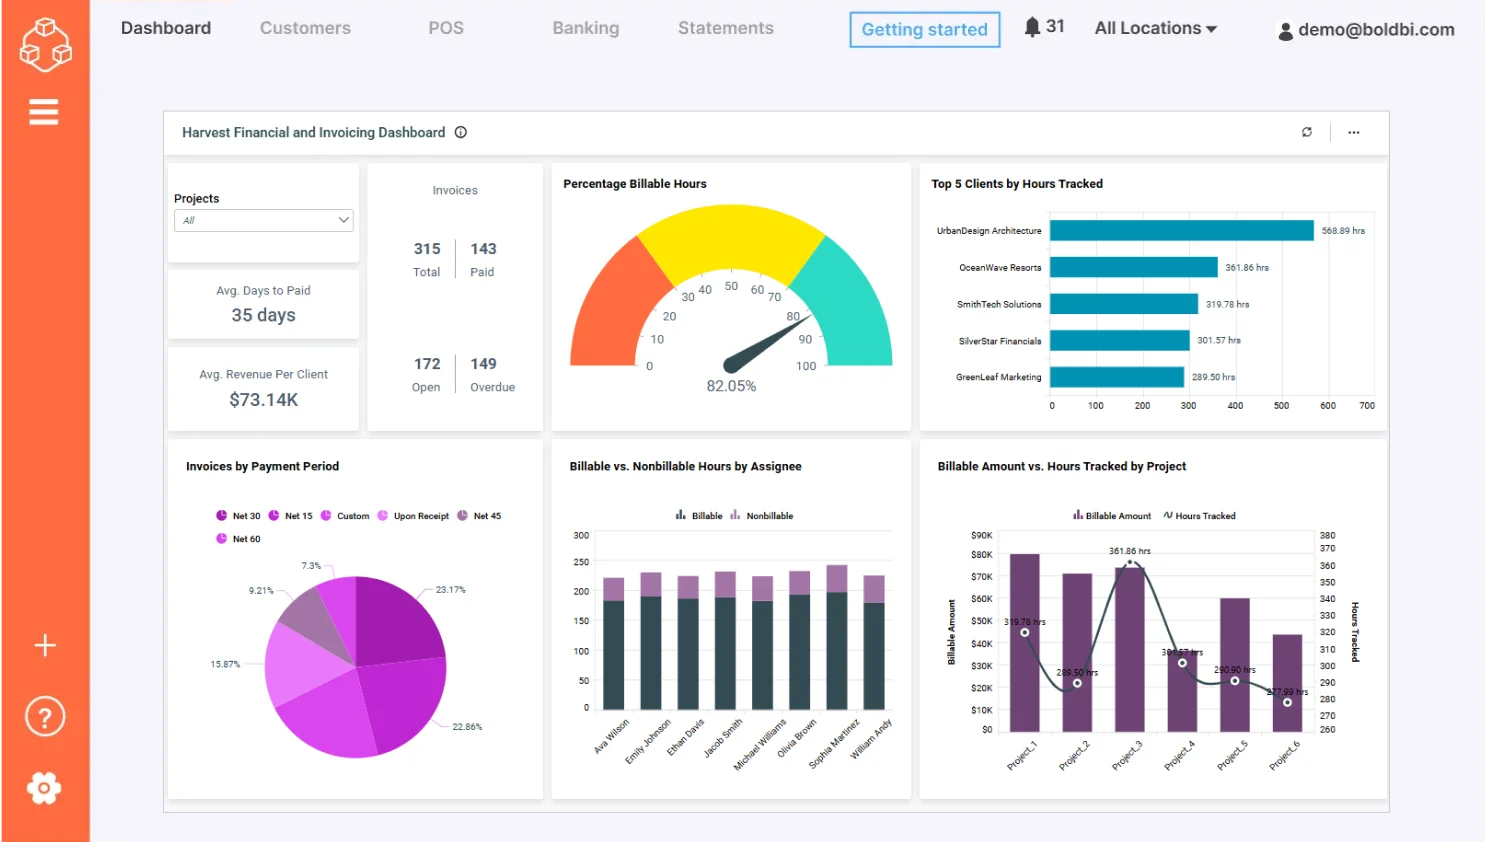
6. Harvest Financial and Invoicing Dashboard
Businesses often face the challenge of managing invoicing across multiple clients, currencies, and time zones, which can lead to delays, missed payments, and poor visibility into overall financial health. The Harvest Financial and Invoicing Dashboard is an example of how a business can consolidate key metrics such as billable hours, outstanding invoices, revenue trends, and client performance into one interactive view. This enables accountants to track financial activity in real time, streamline invoicing processes, and make informed decisions to improve cash flow and client management.
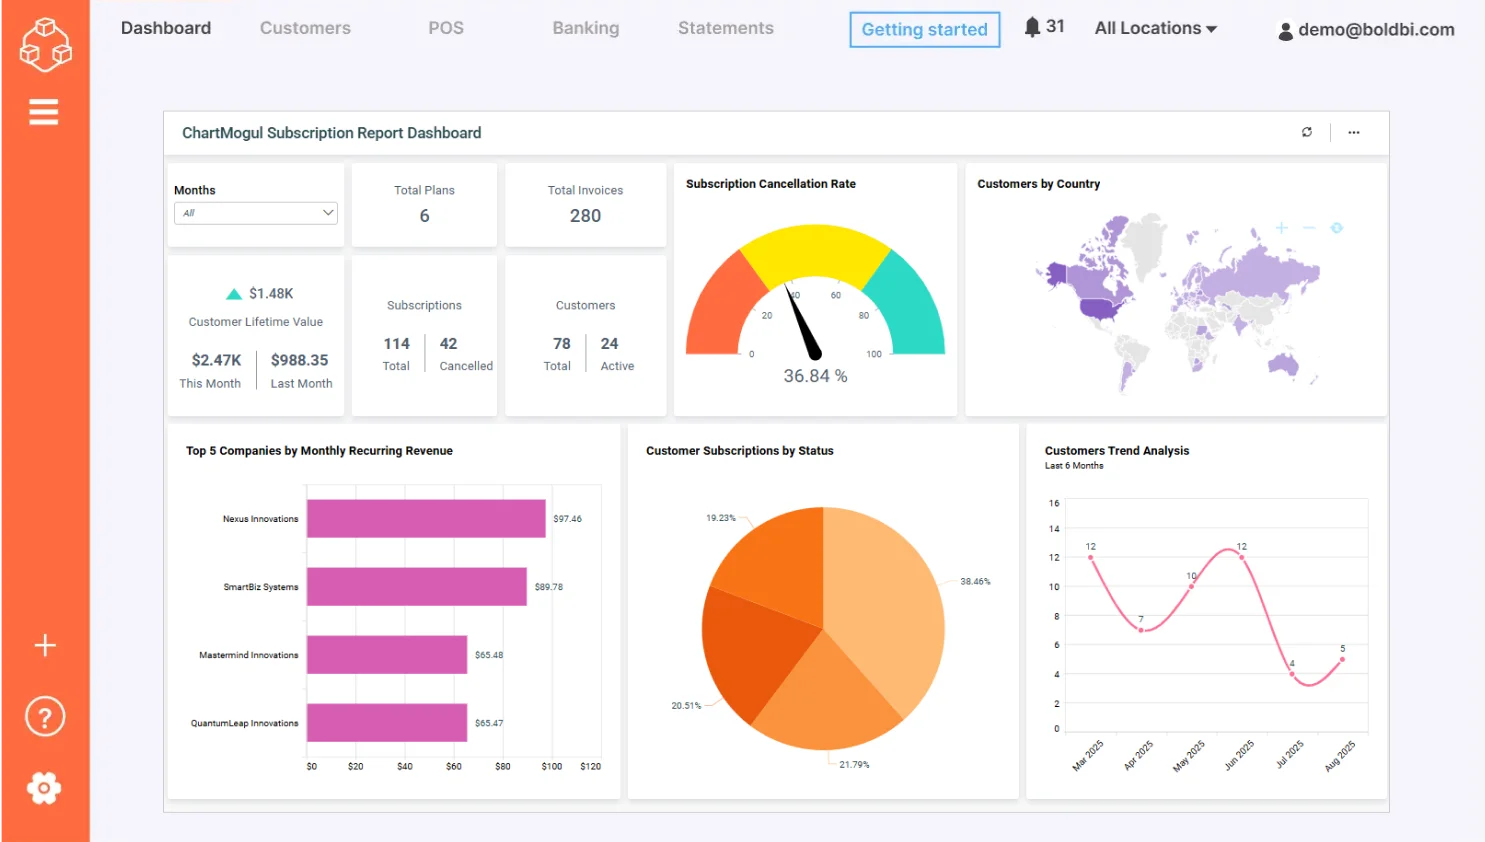
7. ChartMogul Subscription Report Dashboard
Users managing subscription-based businesses often face challenges such as limited visibility into key metrics like Monthly Recurring Revenue, churn rate, and customer subscription, making it difficult to make timely decisions. The ChartMogul Subscription Report Dashboard addresses these issues by offering a centralized, interactive platform that visualizes essential data in real time. It enables users to filter metrics by periods, monitor customer behavior trends, and identify at-risk subscriptions through intuitive charts and gauges. the dashboard provides insights into geographical distribution and revenue performance, helping teams take proactive actions and optimize their strategies effectively.
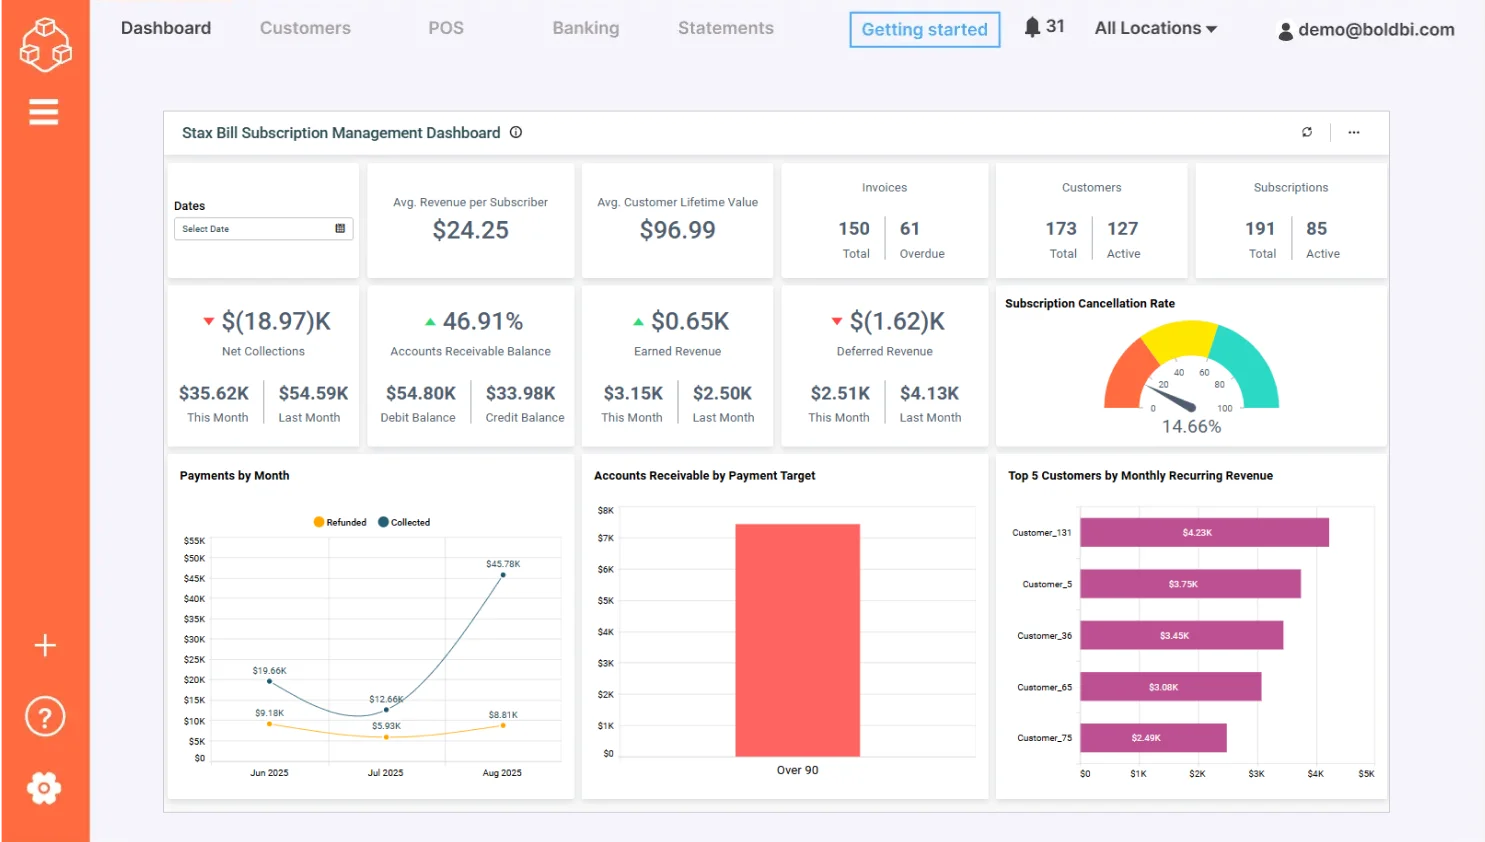
8. Stax Bill Subscription Management Dashboard
Businesses managing subscription-based financial services can struggle with tracking recurring revenue, churn rates, and customer payment behaviors across different currencies and regions. These challenges can lead to missed revenue opportunities and poor forecasting. Dashboards like the Stax Bill Subscription Management Dashboard solve this by providing a real-time overview of key metrics such as active subscriptions, revenue trends, cancellations, and customer lifetime value. It enables accountants to monitor performance, identify patterns, and make informed decisions to optimize revenue streams and improve financial planning.
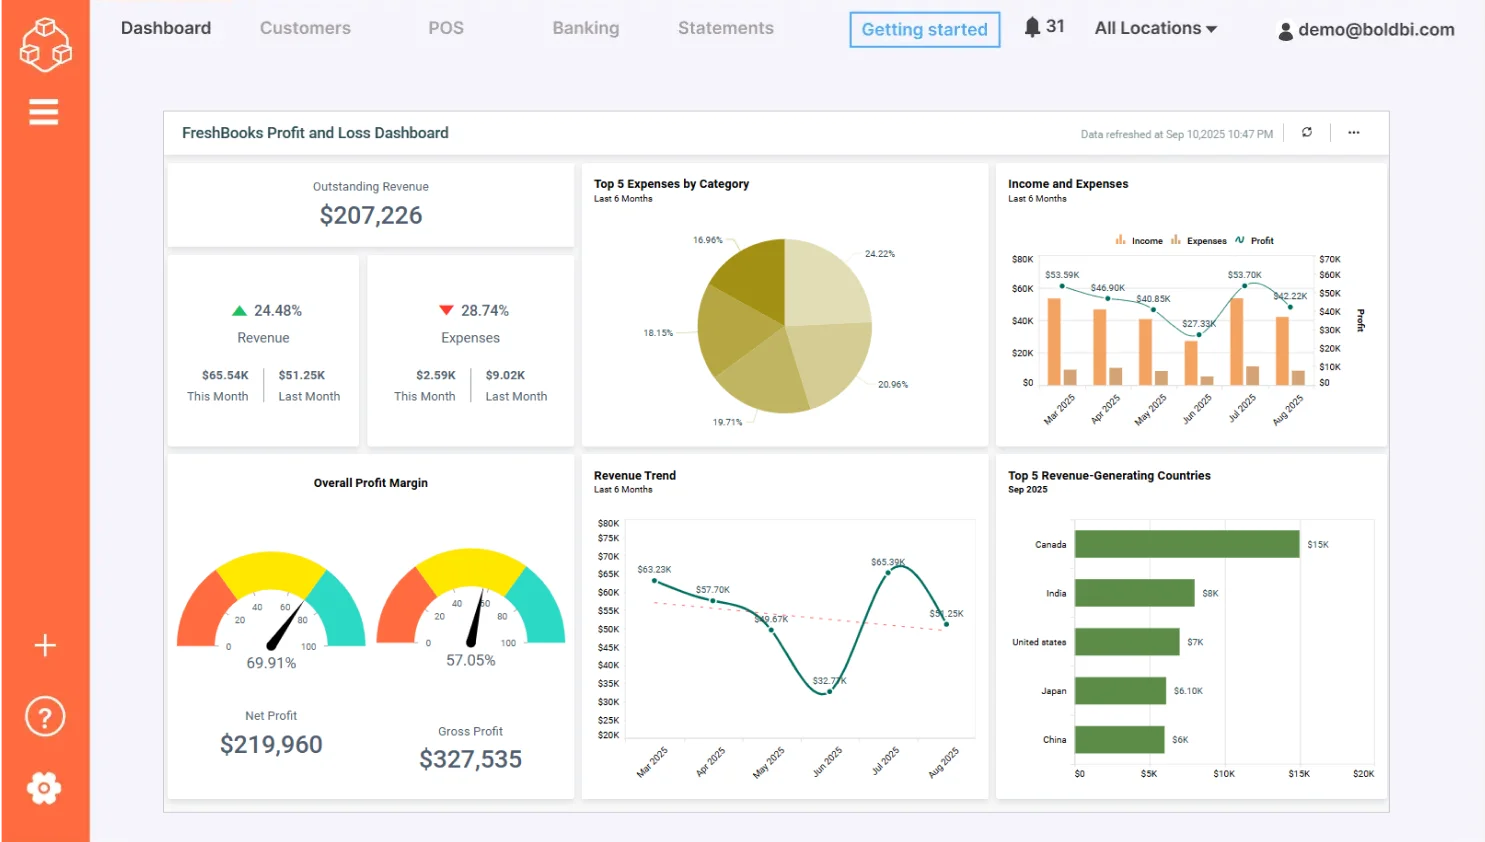
9. Freshbooks Profit and Loss Dashboard
One of the biggest challenges finance leads face is the difficulty of quickly interpreting complex and constantly changing financial data. The Freshbooks Profit and Loss Dashboard is an example of how to solve this challenge. It offers a clear, visual summary of key metrics such as revenue, expenses, profit margins, and customer growth trends. It enables accountants to compare current performance with that of previous time periods, identify top expense categories, and monitor financial health over time, all in one place, empowering them to respond swiftly to market changes and optimize profitability.
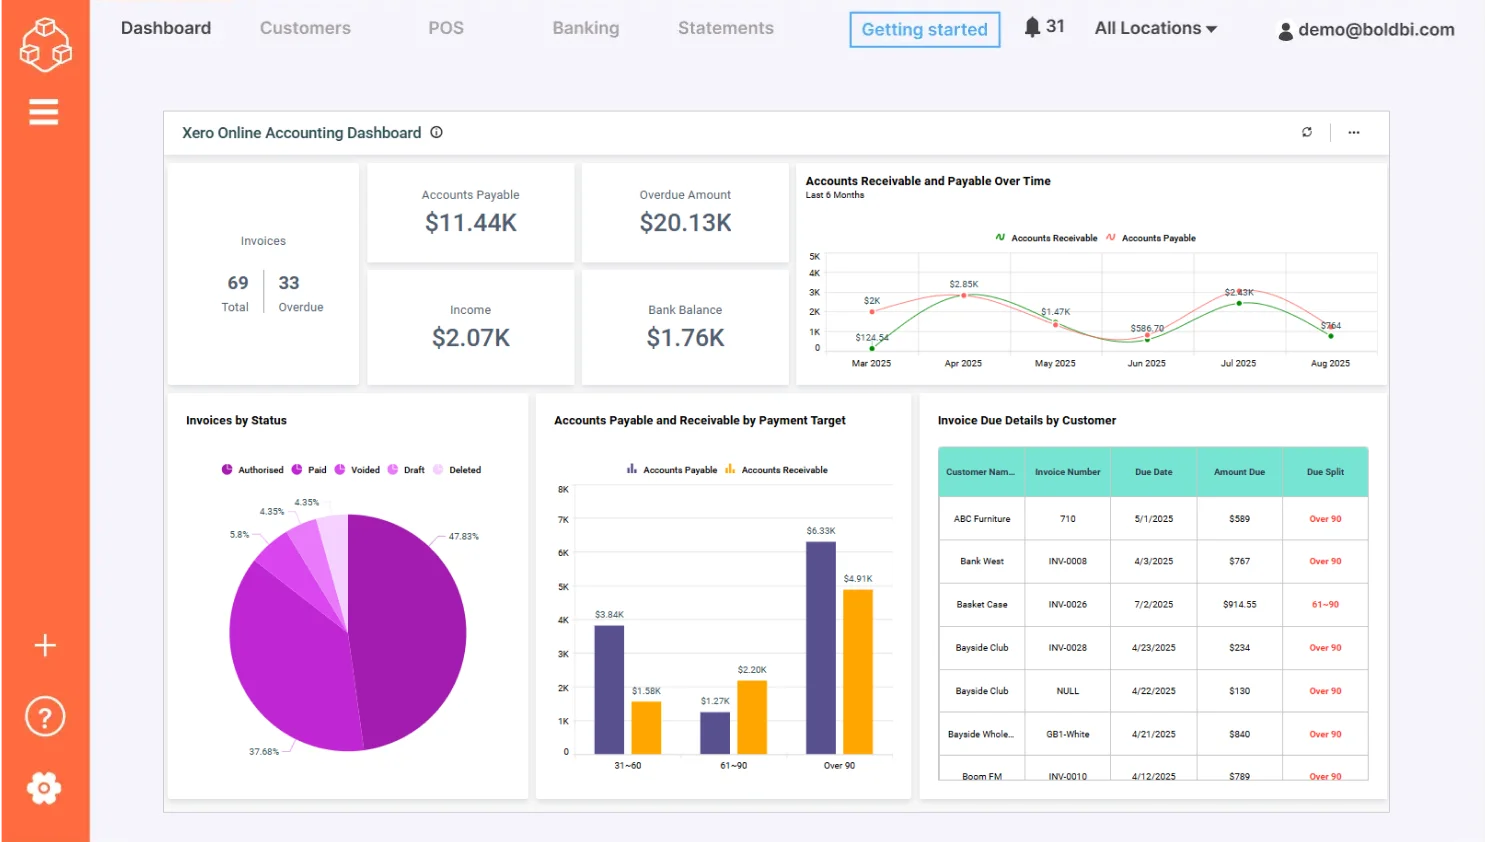
10. Xero Online Accounting Dashboard
Maintaining real-time visibility into critical financial metrics such as accounts receivable (AR), accounts payable (AP), invoice statuses, and profit margins can be challenging. Dashboards like the Xero Online Accounting Dashboard solve this challenge by offering a visually intuitive overview of these key indicators. It enables users to track AR and AP trends over time, monitor overdue invoices, analyze income versus expenses, and view profitability metrics. This centralized and dynamic view empowers financial leaders to make faster, data-driven decisions that enhance financial health and operational efficiency.
Transform Your Global Business with Bold BI Finance Dashboards
Financial dashboards are changing how global finance teams operate, offering real-time insights and centralized data that drive smarter decisions. All the dashboards featured in this blog were built using Bold BI®, a powerful platform designed to unify data and enhance collaboration in today’s fast-changing markets.
Explore our sample dashboards to discover how they can work for different industries and departments. Ready to experience these dashboards firsthand? Start a free trial to explore Bold BI features and discover how they can transform your business.
Frequently asked questions
- 1.
Why do global businesses need finance dashboards?
Global businesses use finance dashboards to consolidate financial data across regions, track KPIs in real time, and make faster, more informed decisions in complex, multi-currency environments.
- 2.
What key benefits do finance dashboards provide?
They deliver centralized visibility, real-time insights, improved forecasting, greater transparency, and early detection of financial risks.
- 3.
Can finance dashboards handle multiple currencies and regions?
Yes. Modern BI platforms like Bold BI support multi-currency data, regional comparisons, and centralized reporting for global operations.
- 4.
Are finance dashboards useful for small businesses?
Yes, they help businesses of all sizes track financial performance, manage cash flow, and make data-driven decisions efficiently.





