

What’s New in v13.1.10 for Self-Service & Embedded Analytics

Introduction
We’re glad to announce that Bold BI® v13.1.10 is now available with exciting new features, powerful improvements, and essential fixes to enhance your analytics experience across Windows, Docker, Linux, Kubernetes, and Azure environments. From expanded data connectivity in Bold Data Hub to visual creation using AI-powered expressions, this release significantly enhances support for self-service and embedded analytics. With these updates, Bold BI users can now effortlessly build, customize, and share dashboards without relying on IT teams.
If you are interested in using this new version right away, you can download it on our Bold BI account or start a free trial today if you are new to our product. Let’s take a look at the key highlights included.
AI Highlights
AI Agent: create dashboards with a prompt
Now you can create dashboards using natural language prompts—no coding or manual setup needed. Just describe what you want, and our AI Agent instantly generates the visuals. Experience faster, smarter, and more intuitive data analysis today.
Visual creation with expressions in AI
Easily create charts using logic-based expressions in Bold BI’s AI—no manual setup required. For instance, if you type a condition like: “Create a bar chart showing ‘Delayed’ if the shipped date is after the required date, otherwise ‘On Time’,” the AI will understand your request, generate the necessary expression, and create the chart for you. This process makes it simple to visualize complex data using everyday language.
Resizable AI summaries panel
Enhance your dashboard experience with our customizable AI “Summarize” popup. This feature allows you to tailor the size of the summaries to your preferences, whether you’re seeking quick highlights or in-depth insights. The adaptable layout ensures you stay focused and organized, making it effortless to navigate your data effectively.
AI usage insights with Oracle IMDB
Track your AI usage pattern with the new analytics dashboard tailored for custom AI models configured with Oracle IMDB. Our new AI usage analytics dashboard allows users to monitor and analyze performance metrics of their custom AI models, ensuring sensitive data stays securely within your infrastructure.
Data Sources and Data Hub Highlights
Data relationship support in the data source
We’ve expanded the functionality of our data sources with built-in data relationship support. This enhancement allows users to define and manage relationships between tables directly within the source, enabling more accurate joins, streamlined data modeling, and deeper insights across connected datasets.
Persistent customization in deployment
While deploying, you can able to maintain uninterrupted control over your data source configurations through custom settings in config.json. Now, these configurations are preserved during building upgrades, preventing data loss and saving you from having to reapply settings manually, making deployments faster, safer, and more efficient.
New connectors: Snowflake, OneDrive, Redshift
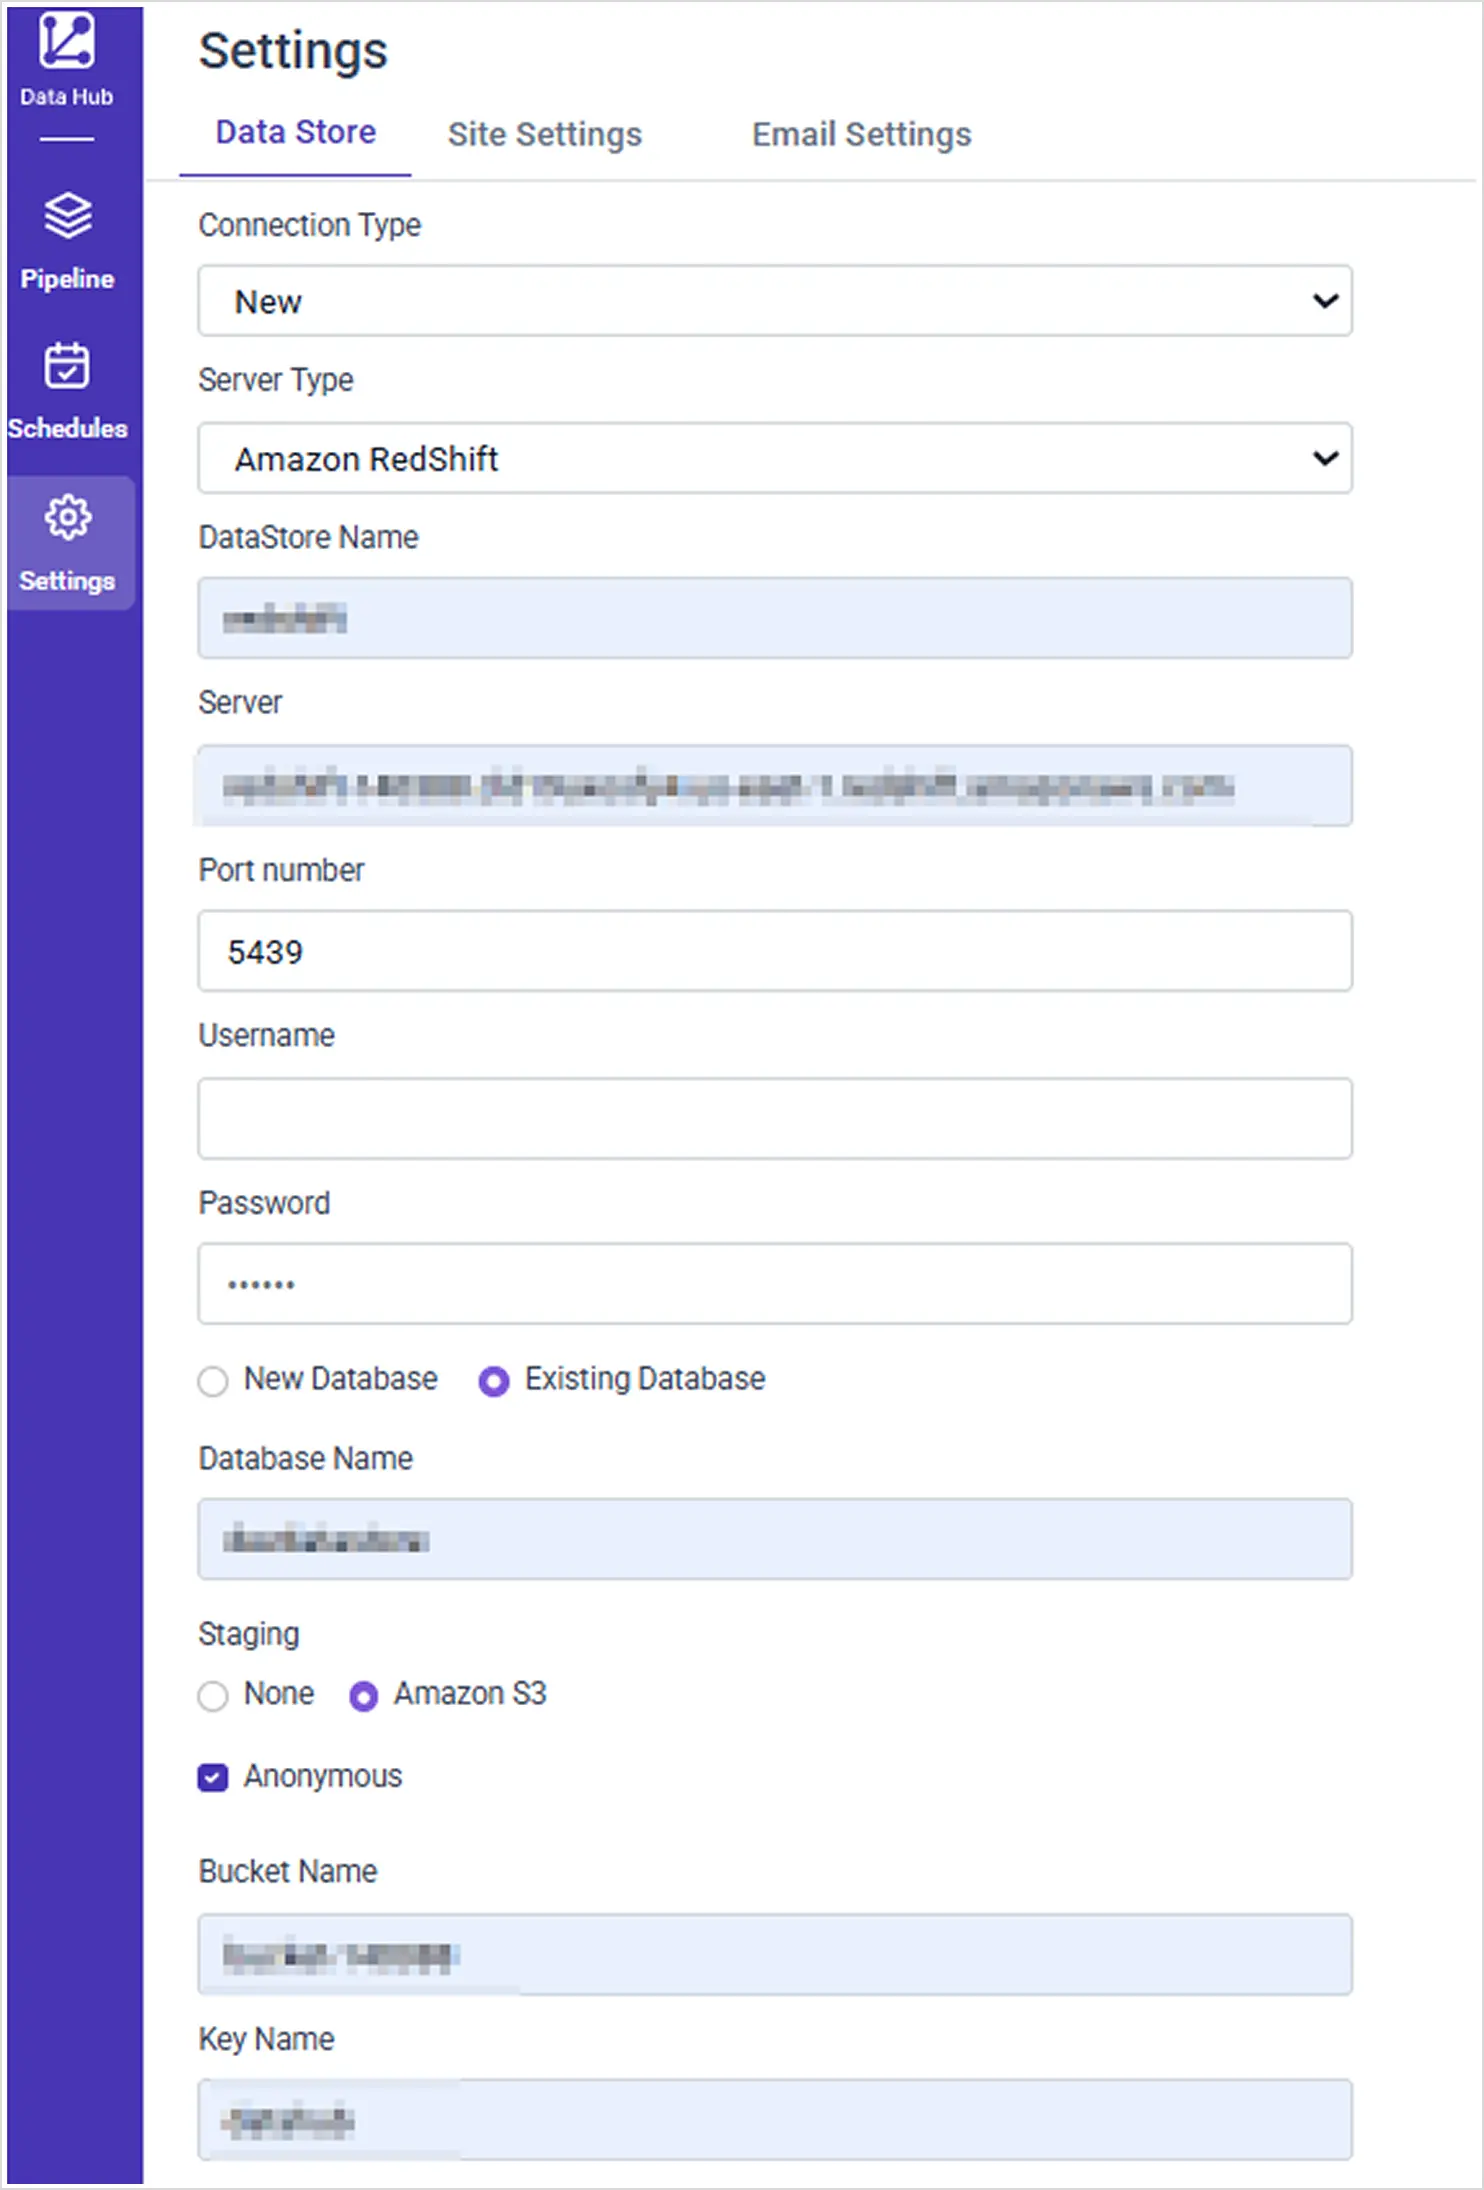
Now, we’ve expanded the capabilities of Bold Data Hub with the addition of new data source connectors: Snowflake, OneDrive, and Redshift. These integrations provide even more flexibility for real-time analytics across your enterprise data landscape.
Anonymous S3 access support in Bold Data Hub
Enhance your data integration process with anonymous S3 access in Bold Data Hub. Effortlessly connect to publicly available S3 buckets without the need for credentials, facilitating seamless data ingestion for open-source and collaborative data projects.
New extract engine support in Bold Data Hub
Seamlessly extract data from Twilio, Shopify, MariaDB, Snowflake, SQLite, and Google Analytics in Bold Data Hub. Leverage these new sources to expand your analytics capabilities and streamline data workflows across platforms.
Designer and Server Enhancements
Modern V2 chart support in Designer
We have now provided support for 12 new V2 chart types in the dashboard designer, offering a sleek and flexible approach to data visualization. These updated charts empower users to create more dynamic, modern dashboards with enhanced customization and clarity.
Streamlined top N filter options
We have introduced support for the new First and Last options in the Top N filter. This enhancement enables users to easily highlight the earliest or latest records in their data, facilitating quick insights with minimal configuration effort.
Default column sorting in data sources
You can now enable default column sorting to align with the original order of the data source by utilizing the IgnoreSorting flag. This feature streamlines data presentation, ensuring users can view information in its intended sequence.
Enhanced user interface and data visualization
Experience improved usability with the newly introduced right-to-left (RTL) layout support in the combo box widget, alongside enhanced pivot grid functionality that now accommodates all chart types in the pivot chart settings, ensuring a more intuitive and versatile data presentation for users.
Enhanced database management
Job scheduling now includes enhancements that support the automated deletion of records from the metrics table, thereby maintaining optimal database size and preventing potential storage issues for a more efficient and reliable system.
Streamlined publishing and offline access controls
Download all items from an offline page regardless of the current grid view. Administrators can view all external sites in the dashboard publish dialog in the Bold BI Server. This improves data accessibility for users and gives admins greater control during publishing.
Embedding Enhancements
AI Assistant customization in embedding
In iframe and SDK embedding, you can control the visibility of the help icon in the AI Assistant using the new hideAiChatHelp Boolean member. This gives developers and designers greater flexibility to tailor the assistant interface to match their application’s UI.
Enhanced mode switching in embedded apps
Users can now effortlessly switch between dashboard viewer and designer modes in embedded applications, enhancing workflow efficiency and user experience.
Other Improvements and Minor Fixes
In addition to the major enhancements already discussed, the Bold BI 13.1 release includes several other updates:
- Security: Automatically map users to groups at login using token-based group claims, with support for claim customization and cleanup of outdated assignments.
- Bug fixes: Previous issues related to AI service downtime, multiple error messages in multitab dashboards during SDK-based embedding, and missing dashboard menus when opening the last or second-to-last items on the listing page have been resolved.
- Performance: We’ve enhanced rendering speed for dashboards that use linked data sources. Users will experience faster load times and smoother interactions when working with complex, data-connected visualizations.
For a full list of all the new features, enhancements, and bug fixes, visit our release history page.
Conclusion
We hope these Bold BI® v13.1.10 updates inspire you to explore new possibilities in your analytics journey. With smarter AI features, expanded data connectivity, and enhanced embedding capabilities, this release empowers you to glean more impactful insights with less effort.
Ready to try Bold BI out for the first time? Request a demo or start your free trial today!





