

Bold BI vs. Metabase: Embedded Analytics at Enterprise Scale
TL;DR: Bold BI® and Metabase solve different embedding problems. Metabase is built for internal analytics and self-service analytics, with deeper embedding features gated to its paid tiers. Bold BI provides embedded analytics capabilities such as multi-tenant data isolation, white-label branding, and SDK-based integration for customer-facing SaaS applications.
Introduction
Many teams start their analytics journey on Metabase, drawn to its open-source flexibility and fast self-service setup. That works well right up until a SaaS company needs to put those dashboards in front of customers. At that point, embedding stops being a feature checkbox and becomes an architecture decision. Enterprise buyers evaluating embedded analytics generally expect white-label analytics experiences that are indistinguishable from the rest of the host product.
That shift, from “a dashboard for our team” to “analytics inside our product,” is exactly where the Bold BI vs. Metabase comparison matters. Both platforms describe themselves as supporting embedded analytics; they differ in how deep that support goes and what breaks first at scale. Metabase is an open-source BI platform where embedding is one capability among many. Bold BI is an embedded analytics platform that includes multi-tenancy, white-labeling, and SDK-based integration as core capabilities for customer-facing analytics deployments.
This guide compares how the two platforms handle embedding specifically: integration methods, tenant isolation, branding, authentication, and what changes as usage grows from one internal team to hundreds of customer tenants. It’s written for developers, solution architects, and product leaders deciding whether their current platform can support analytics as a product feature, not just an internal analytics tool.
Bold BI vs. Metabase at a glance
Bold BI and Metabase serve different analytics needs: Bold BI focuses on enterprise-grade embedded analytics with advanced customization, governance, and deployment flexibility, while Metabase emphasizes open-source, self-service BI with a simpler user experience and per-user pricing.
| Consideration | Bold BI | Metabase |
|---|---|---|
| Product positioning | Embedded analytics platform, enterprise-first | Open-source BI, self-service-first |
| Embedding method | Native SDKs (React, Angular, Vue, .NET, Blazor), custom widgets, and API-first integration | Modular Embedding and Public Embeds, plus Full App Embedding and the Modular Embedding SDK for React |
| Multi-tenancy | Built-in on every edition, tenant-scoped data isolation | Named “Multi-tenant embedded analytics” feature, included from the Pro plan ($575/mo) up |
| White-label branding | Full customization on every edition: logos, themes, domains, navigation | “Whitelabel ready,” included from the Pro plan up |
| Authentication for embeds | SSO (OAuth, SAML, OpenID, Azure AD, Okta), row-level security, API-based auth | SSO plus row/column-level permissions, included from the Pro plan up |
| AI-powered analytics | Native: AI Copilot, AI Agent, Smart Narrations, Prompt-to-Dashboard, forecasting | Metabot: natural-language querying, SQL generation, semantic search, summaries |
| Deployment options | Windows, Linux, Docker, Kubernetes, AWS, Azure, GCP, on-premises | Metabase-hosted cloud or self-hosted (Docker or bare install) |
| Pricing model | Custom-quoted per edition; no per-user or per-viewer fee | Per-user pricing: Starter $100/mo + $6/user, Pro $575/mo + $12/user, Enterprise custom |
| Open-source availability | No | Yes |
Next, let’s explore what sits behind each row, starting with what each platform is actually built around.
Bold BI: Built for embedded analytics at enterprise scale
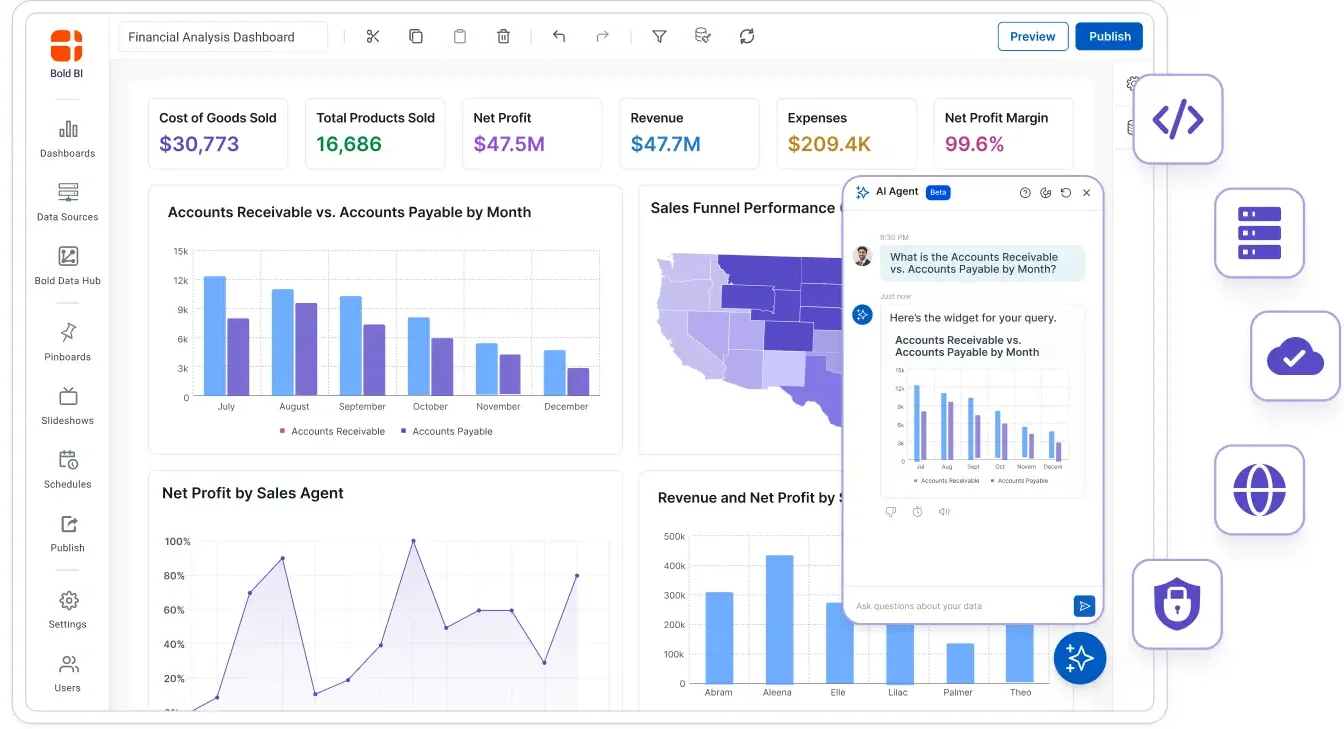
Core capabilities include:
- Interactive dashboard designer: Drag-and-drop dashboard building that reduces reliance on development resources.
- Native embedding: SDKs for React, Angular, Vue, .NET, and Blazor, plus custom widget support, for integrating analytics directly into application frameworks rather than just iframe embeds.
- Built-in multi-tenancy: Included on every edition; a single deployment serves multiple customers with isolated, tenant-scoped data.
- Full white-label branding: Included on every edition: logos, themes, custom domains, navigation, and user experience elements can be matched to the host application.
- AI-powered analytics: AI Copilot, AI Agent, Smart Narrations, Prompt-to-Dashboard, and forecasting (for example, a user can ask “Why did customer churn increase last month?” and get a plain-language answer with supporting metrics).
- Enterprise security and governance: SSO (OAuth, SAML, OpenID, Azure AD, Okta), row-level security, user filtering, and API-based authentication for controlling access per tenant.
- Data preparation via Bold Data Hub: ETL, visual data modeling, and data blending to prepare analytics-ready datasets.
- Flexible deployment: Windows, Linux, Docker, Kubernetes, AWS, Azure, GCP, cloud, and on-premises, with no per-user or per-viewer fee on any edition.
- Developer extensibility: APIs, SDKs, and customization tools for teams building embedding into their own release cycles.
- Self-service analytics: No-code data exploration and dashboard building for business users, reducing dependence on IT for day-to-day analysis.
- Data visualization: 40+ chart and widget types, including bar, line, pie, combo, pyramid, funnel, and heatmap, for representing comparison, relationship, proportion, and KPI data.
- Collaboration: Co-authoring, live commenting, secure sharing links, and embedding dashboards into email, Teams, or SharePoint to keep insights in the flow of work.
- Audit trail: Tracks configuration and structural changes, such as user actions and permission updates, for compliance and security review, without logging dashboard content itself.
- Data connectors: Include 140+ built-in connectors across databases, cloud apps, flat files, and APIs, plus support for custom connectors, allowing teams to extend connectivity to proprietary and specialized data sources.
- Mobile BI: Native iOS and Android apps for viewing dashboards, tracking KPIs, and exporting analytics on the go, with responsive layouts across desktop, tablet, and mobile.
Metabase: Built for internal, self-service analytics
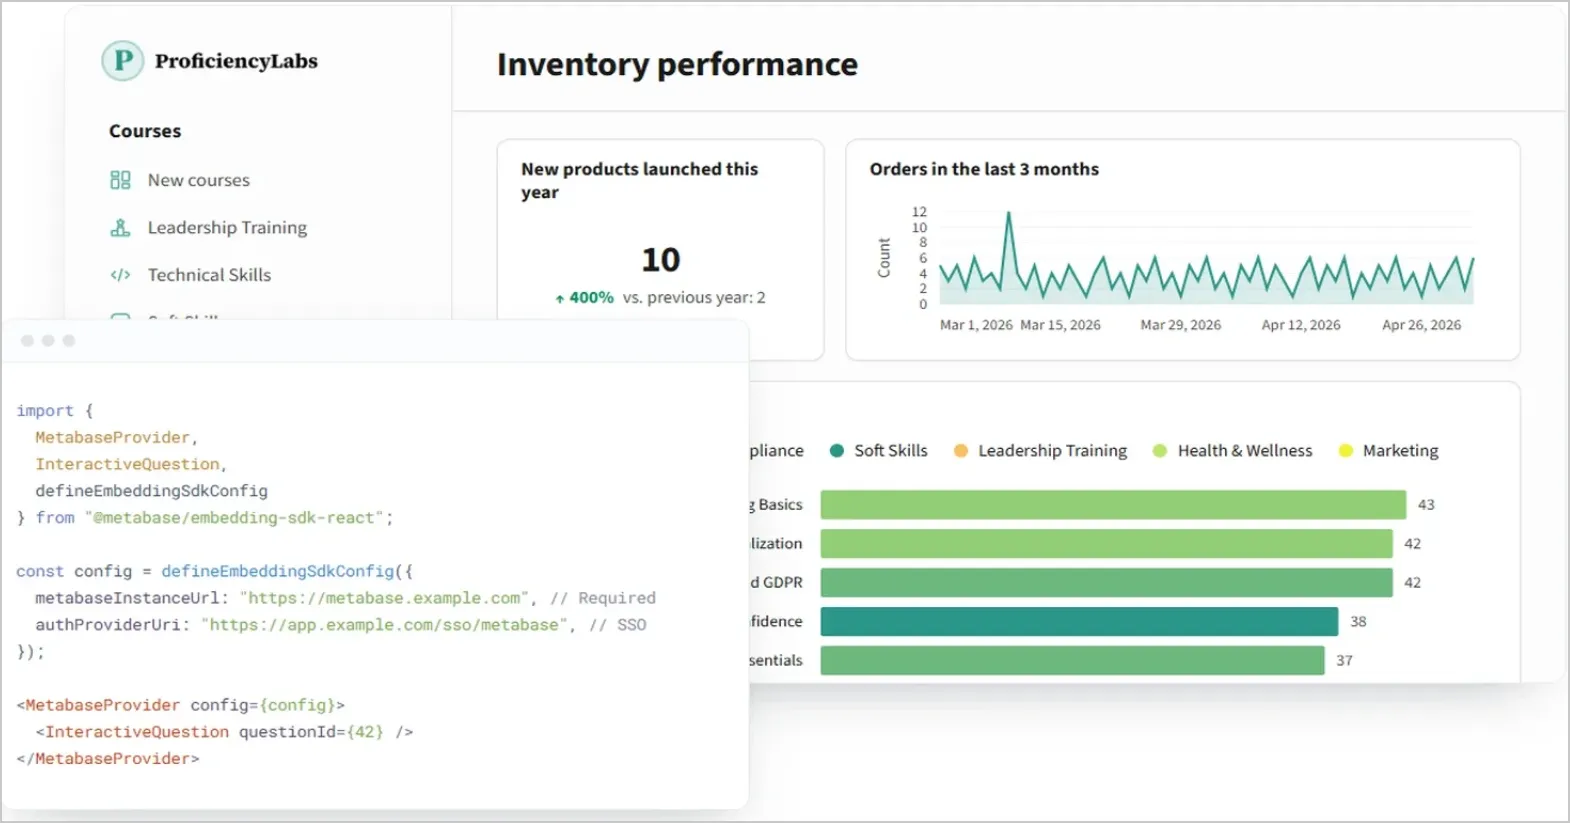
Metabase is a widely adopted open-source BI platform designed to help technical and business users answer questions quickly through dashboards, visual queries, and self-service exploration.
Core capabilities include:
- Open-source, self-managed platform: Full access to customize and host the platform independently.
- Self-service analytics: Business users explore data and build dashboards without relying on technical teams.
- Interactive dashboards and ad hoc exploration: Filtering, drill-through, and centralized analytics.
- Embedded analytics support: Modular Embedding and Public Embeds, plus Full App Embedding and the Modular Embedding SDK for React.
- Multi-tenant embedding and white-labeling: Named features on the Pro plan ($575/mo + $12/user) and up, alongside row/column-level permissions and SSO.
- Collaboration: Sharing via links, subscriptions, and alerts.
- Metabot AI assistant: Natural-language querying, SQL generation and debugging, and one-click summaries on every plan, with AI-powered semantic search available on Pro and Enterprise.
- Flexible hosting: Cloud-hosted, Docker-based, or fully self-hosted, with SOC 2 Type II, SOC 1, GDPR, and CCPA compliance.
Why teams evaluate a Metabase alternative
Metabase is a strong fit for internal analytics and self-service analytics, and it does offer multi-tenancy, white-labeling, and SSO, but only from its Pro plan up, and its pricing scales per user. Organizations typically start evaluating alternatives when:
- Analytics shifts from an internal tool to a customer-facing product feature, and per-user pricing stops making sense against a growing external customer base rather than an internal team.
- Deeper embedded analytics requirements, such as multi-tenant deployments, white-label branding, SSO, and advanced permission controls, require upgrading to Metabase’s Pro tier and above.
- Multi-tenant isolation and white-labeling need to be included without being gated behind a specific paid plan.
- Enterprise governance controls, such as dedicated support SLAs and air-gapped deployment, are needed below Metabase’s Enterprise tier, which is priced on a custom, contact-sales basis rather than a published rate.
Metabase can be a strong fit for teams that want internal dashboards up and running quickly with relatively little setup. As analytics becomes more customer-facing, priorities often shift toward tenant-aware access, branding control, external authentication, and scalability across multiple customers. In those cases, organizations should evaluate how pricing, feature availability, and deployment flexibility align with their embedded analytics requirements.
Organizations researching Metabase alternatives often compare factors such as multi-tenancy, white-labeling, governance, deployment flexibility, and long-term scalability before selecting an analytics platform.
Embedded analytics architecture: Bold BI vs. Metabase
Feature lists tell you what each platform can do. What determines whether embedding actually holds up in production is the architecture underneath: how the integration is wired in, how tenants stay isolated, how branding is applied, and how access is authenticated per customer.
Embedding methods: iframe, SDK, and API-first integration
The simplest way to embed a dashboard is an iframe, quick to set up, but limited in how deeply it integrates with a host application’s look, feel, and data flow. SDK-based and API-first embedding go further, letting developers control the analytics experience as a native part of their own application rather than a page loaded inside a frame. These capabilities increasingly influence how organizations evaluate embedded BI tools for customer-facing applications.
Bold BI’s embedding is built around native SDKs (React, Angular, Vue, .NET, Blazor) and custom widget support alongside API access, so dashboards can be composed into an application’s own UI rather than dropped in as an isolated frame. This is included on every edition, at no per-user cost.
Metabase offers Modular embedding, Full App embedding, and a Modular Embedding SDK for React across its paid plans. However, capabilities commonly required for customer-facing SaaS analytics, including multi-tenant embedding, white-label branding, SSO, and advanced permissions, are available from the Pro plan onward.
Multi-tenant analytics and data isolation at scale
For organizations delivering multi-tenant analytics, the embedding question is really a data-isolation question: can one deployment serve hundreds of tenants without any tenant seeing another’s data, and without provisioning a separate instance per customer?
Bold BI treats multi-tenancy as a core capability on every edition: a single deployment manages multiple customers with tenant-scoped data isolation built in, at no additional per-tenant fee.
Metabase names “multi-tenant embedded analytics” as a specific feature on its Pro plan and up, built on row- and column-level permissions; organizations should confirm that tier is included in their license and factor the per-user cost into how many tenant-facing seats they expect to scale to.
White-label branding and theming
Enterprise buyers evaluating embedded analytics generally expect the analytics surface to be indistinguishable from the rest of the host product, not “a BI tool with our logo pasted on.”
Bold BI supports full white-labeling on every edition: logos, themes, custom domains, navigation, and user-experience elements can all be matched to the host application.
Metabase markets itself as “Whitelabel ready” from its Pro plan up, covering labels, colors, fonts, and branding, a real, named capability, just one gated behind the $575/mo-and-up tier rather than included on every plan.
Authentication
Embedding analytics into a multi-tenant application means every embedded session needs to authenticate as the right user, for the right tenant, with the right permissions, every time.
Bold BI’s approach combines SSO (OAuth, SAML, OpenID, Azure AD, Okta), row-level security, user filtering, and API-based authentication so access can be scoped per tenant and per user, on every edition.
Metabase’s SSO and row/column-level permissions are also real capabilities, included from the Pro plan up; teams should confirm their license tier includes SSO before relying on it for customer-facing tenant isolation.
Governance, deployment, and total cost of ownership
Embedding architecture determines whether the integration works. These factors determine whether it’s sustainable to run.
Security and compliance
As analytics adoption grows, governance requirements grow with it.
Bold BI’s enterprise governance stack, including SSO, row-level security, user filtering, granular permissions, API-based authentication, and multi-tenant governance controls, is designed to help organizations support compliance requirements such as GDPR, HIPAA, and SOC 2.
Metabase holds SOC 2 Type II and SOC 1 certifications and supports GDPR and CCPA compliance; organizations with HIPAA or other specific regulatory obligations should confirm those requirements are met at their license tier, since Metabase’s most restrictive option (air-gapped, offline deployment) is available on Enterprise only.
Deployment and developer experience
Bold BI deploys across Windows, Linux, Docker, Kubernetes, AWS, Azure, GCP, cloud, and on-premises environments, backed by extensive APIs, native SDKs, and custom widget support: infrastructure flexibility aimed at teams building embedding into their own release process.
Metabase offers cloud-hosted, Docker-based, and self-hosted options, appealing to technical teams that value open-source customization and simpler initial implementation.
Pricing and total cost of ownership
The two platforms price fundamentally differently, which matters more than any single feature comparison for a growing SaaS customer base:
- Metabase prices per user: Starter is $100/mo + $6/user (first 5 included), Pro is $575/mo + $12/user (first 10 included) and adds multi-tenant embedding, white-labeling, and SSO, and Enterprise is custom-priced, starting around $20,000/year, adding a dedicated success engineer and air-gapped deployment.
- Bold BI pricing model: Cloud, Managed Private Cloud, and On-Premises editions are all custom-quoted, but explicitly carry no per-user or per-viewer fee, and every edition ships the full feature set (multi-tenancy, white-labeling, and SDKs included regardless of which edition you choose).
For a SaaS provider, “users” means the whole customer base, not an internal team. That’s why the difference between per-user pricing and a flat, feature-complete license is often the single biggest driver of total cost of ownership as usage scales.
Planning a transition from Metabase to Bold BI
Teams moving from Metabase to Bold BI for embedding reasons typically go through the same core steps:
- Rebuilding dashboards and analytics within Bold BI.
- Connecting existing databases and data sources (both platforms support a broad range of connectors, so most existing data infrastructure carries over).
- Reconfiguring tenant, user, and access-control settings for the new isolation model.
- Re-implementing embedded views using Bold BI’s SDKs and APIs.
- Testing authentication and tenant configuration end-to-end before rollout.
- Validating dashboards in production before cutting over fully.
Smaller deployments can often complete this in a few weeks; larger multi-tenant environments typically phase the migration, moving high-priority dashboards first and expanding from there.
Real-world use case: How ai-InteleKt accelerated embedded analytics delivery
Case studies provide one perspective on implementation success. Customer feedback can offer additional insight into day-to-day platform usage, deployment experience, and long-term value.
How customers describe their experience with Bold BI
Bold BI earned multiple badges in G2’s Spring and Summer 2026 Reports across embedded business intelligence and analytics platform categories. This shows our commitment to building embedded analytics that real customers rely on in production, recognized consistently across two consecutive G2 reporting cycles.
Key takeaways
Bold BI® and Metabase both support embedding, but they’re built for different depths of it. Metabase supports embedded analytics alongside its broader self-service BI platform, while Bold BI is commonly evaluated by organizations embedding analytics into customer-facing SaaS applications. Organizations building customer-facing analytics experiences often evaluate factors such as customization, governance, deployment flexibility, and scalability when comparing platforms.
The right choice depends on your organization’s requirements, architecture, and growth plans. Teams focused primarily on internal analytics may find Metabase a strong fit, while organizations building analytics directly into SaaS products often prioritize capabilities such as tenant isolation, branding control, extensibility, and long-term scalability.
If you’re evaluating Metabase alternatives, it’s also worth comparing Bold BI with platforms such as Looker, Qlik Sense, Domo, Power BI, and Tableau to determine which solution best aligns with your embedded analytics, governance, deployment, and total cost of ownership requirements.
Ready to build analytics that scale with your business? Start your free Bold BI trial or request a personalized demo to explore how embedded analytics can fit into your application and customer experience.
Related resources:
- Top Embedded Analytics Tools for SaaS Teams 2026
- Embedded Analytics Tools: What to Evaluate Before Buying
- Why You Should Choose Bold BI for Embedded Analytics
Frequently asked questions
-
- 1.
Which platform offers stronger embedded analytics capabilities?
Both platforms support embedded analytics. Organizations requiring multi-tenant deployments, white-label experiences, SDK-based integration, and customer-facing SaaS analytics often find Bold BI’s architecture a closer match, while Metabase is commonly adopted for internal analytics and self-service BI.
- 2.
Can Bold BI be fully white-labeled?
Yes. Organizations can customize logos, themes, domains, navigation, and user experience elements.
- 3.
How does multi-tenancy work differently between the two platforms?
Bold BI provides built-in, tenant-scoped data isolation as a core capability. Metabase’s isolation approach depends on the deployment model and licensing tier, so teams should confirm tenant-level isolation is included before relying on it for a customer-facing rollout.
- 4.
Is Bold BI suitable for SaaS applications?
Yes. Bold BI is designed to support customer-facing analytics, multi-tenancy, embedded dashboards, and branded analytics experiences.
- 5.
How much does it cost to embed dashboards in a SaaS application?
Costs vary based on deployment architecture, user growth, branding requirements, governance features, and licensing model. Evaluate total cost of ownership over time rather than initial licensing cost alone.
- 6.
Can I migrate from Metabase to Bold BI?
Yes. Existing databases and data sources typically carry over, so organizations can continue using their current infrastructure while rebuilding dashboards and embedded views within Bold BI using its SDKs and APIs. Migration complexity depends on customization requirements and deployment architecture; smaller deployments can often complete this in a few weeks.
- 7.
Which platform provides stronger AI capabilities?
Bold BI includes native AI-powered analytics, such as AI Copilot, AI Agent, Smart Narrations, Prompt-to-Dashboard, and forecasting. Metabase offers AI-assisted capabilities through Metabot, including natural-language querying, SQL assistance, semantic search, and automated summaries.
- 8.
What does a typical migration timeline to Bold BI look like?
Timelines vary with the number of dashboards, data sources, and embedding requirements. Smaller deployments can finish in a few weeks; larger multi-tenant environments often follow a phased rollout spanning several months, starting with high-priority dashboards.
- 9.
Is Bold BI a good Metabase alternative?
Yes, particularly for organizations whose analytics needs have grown from internal analytics into customer-facing, multi-tenant embedding. Bold BI’s white-labeling, multi-tenancy, and native AI features are designed to support customer-facing and multi-tenant analytics deployment.
- 1.





