

Demystifying Business Metrics: KPIs vs. Metrics vs. Measures
Do you struggle to keep track of the various terms used to measure business success? Understanding the difference between KPIs, metrics, and measures can be unclear. In this post, we’ll break down these terms and help you determine which to use where in your business operations.
What is KPI?
A KPI, which stands for key point indicator, is a specific and measurable goal that organizations use to evaluate their success in a particular activity. It helps to maintain focus on the most important areas of the business. It can be a financial or nonfinancial measure of a business’s performance against its objectives.
Benefits of KPIs
KPIs will enable you to know your status in meeting a target.
Encourages personal development
KPIs promote professional growth within an organization by establishing specific objectives and benchmarks for employees to attain, thereby fostering the acquisition of new competencies and enhancing their capabilities. Moreover, KPIs furnish constructive feedback and acknowledgment for accomplishments, inspiring employees to pursue further self-improvement and advancement.
Boosts staff morale
KPIs provide employees with a clear understanding of what is expected of them and how their efforts contribute to their success. This level of clarity and purpose can enhance staff morale and drive motivation to attain objectives.
Supports business goals
KPIs aid businesses in monitoring their advancement toward accomplishing precise business objectives. By presenting current, relevant data in an easily understood format, KPIs offer valuable insights that guide decision-making and ensure that corporations remain on course to achieve their targets.
Manages performance

KPIs aid management by establishing a precise, unbiased standard for success for teams and individual employees. KPIs empower organizations to monitor and evaluate performance with hard data, making performance reviews easier and highlighting growth opportunities.
Real-time use cases for applying a KPI
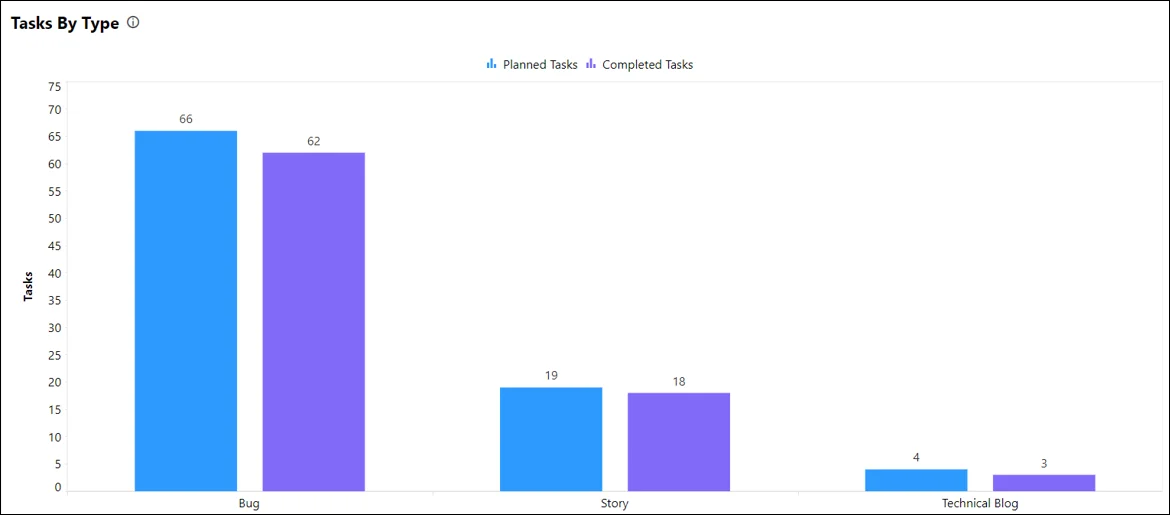
Agile: An agile team can easily track their tasks to ensure they run smoothly and according to the plan. This helps them monitor and remove any bottlenecks hindering the success of the task flow.
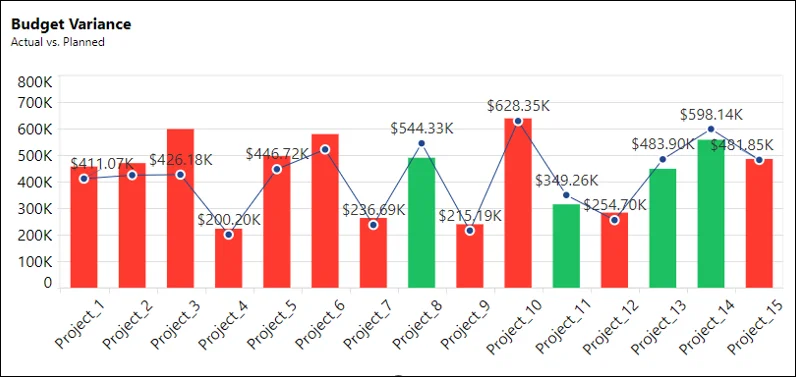
Construction: A construction manager can monitor the trends of the budget variance in their projects, letting them better plan budgeting and pricing for services in the future.
What is a metric?
A metric is a quantifiable measure or standard used to evaluate and track the performance of a specific process or activity. Metrics are typically numerical values or ratios used to assess the efficiency or effectiveness of a particular function within an organization. Metrics can be utilized to monitor progress toward achieving KPIs and can be either quantitative or qualitative in nature.
Benefits of tracking metrics
Tracking business metrics gives company leaders insight into the strengths and weaknesses of their departments and the outcomes of decisions they make.
Determine progress toward goals and objectives
Metrics are not always KPIs, but KPIs are always metrics. Tracking them keeps company leaders abreast of progress toward goals on any level they care to evaluate.
Improved data presentation
Presenting metrics in the form of visualizations, as is most common, enables stakeholders to understand data directly without technical support. The alternative is raw data in spreadsheets, from which conclusions are difficult to glean.
To identify areas for improvement and optimization

Metrics offer users quantifiable data to identify areas for improvement. For example, marketing teams can compare the results of different kinds of campaigns. They can identify which channels or strategies work best, and whether or not a new idea was successful, thus improving future campaigns.
Real-time use cases for tracking a metric
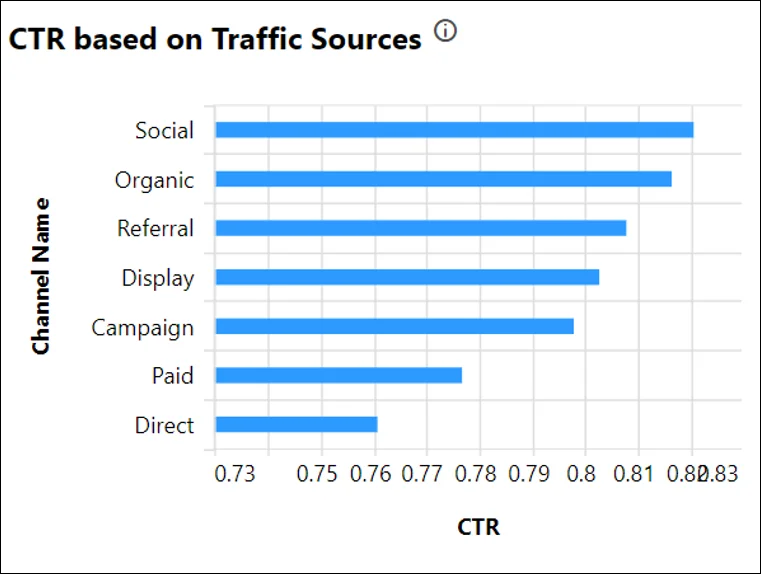
Website traffic: The website team can track click-through rates from different channels to help improve its website and engage its users.
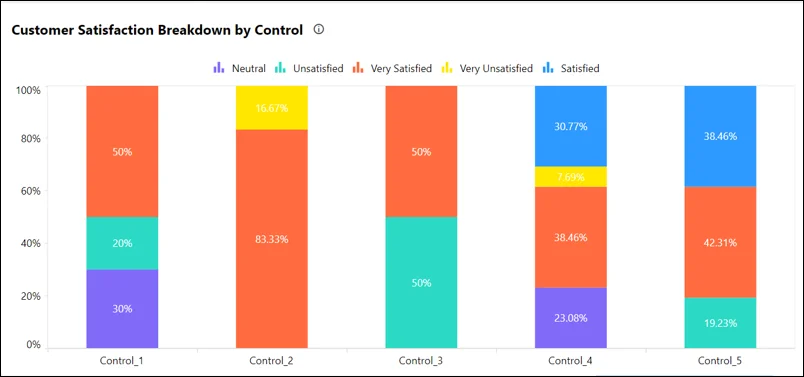
Customer satisfaction: The customer service team can track the customer satisfaction breakdown by product through feedback and see where they need to focus improvements to satisfy all their customers.
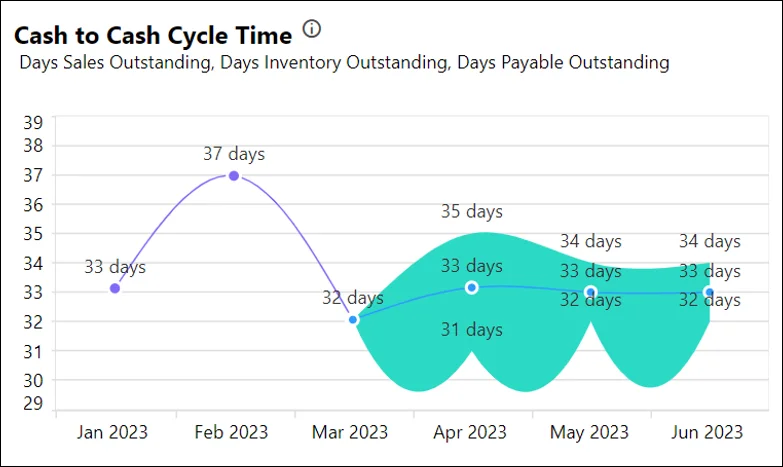
Supply chain management: Users can monitor their cash-to-cash cycle time to spot issues in their supply chain and payment schedules. Business leaders can change suppliers or adjust policies to free up more capital.
What is a measure?
A measure is a particular value or data point that is then used in the calculations for metrics. They are numbers like the number of sales, the number of new hires, etc. Combining and contextualizing this data gives you metrics and KPIs.
Importance of tracking measures
Measures are the core of your data collection. Tracking measures can give you simple information in its own right, particularly useful in real-time, and help you build your business intelligence system. Without measures, you have no metrics. What you do with them determines how useful your business intelligence will be.
Real-time use cases for tracking measures
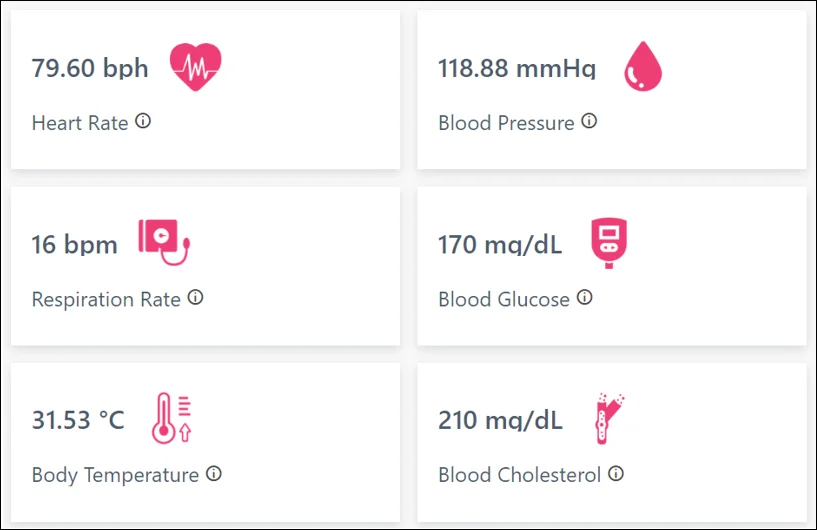
Healthcare: Real-time monitoring of a patient’s vital signs in the ICU or emergency room let healthcare workers quickly identify any changes in the patient’s condition and take appropriate actions.
Retail: Real-time inventory tracking can help retailers optimize their stock levels and avoid running out, improving customer satisfaction and reducing lost sales.

Energy: Real-time monitoring of energy usage measures lets plant workers know whether or not something is abnormal.

Differences among KPIs, metrics, and measures
KPIs, metrics, and measures are commonly used in the business world but the terms are often used interchangeably. However, there are distinct differences among them, which can be summarized in the following table.
| Parameter | KPIs | Metrics | Measures |
| Definition | Used to evaluate the success of an organization, team, or individual. | Used to track and assess the performance of a specific activity. | Used to quantify the performance of an activity. |
| Purpose | Shows the overall performance of an organization. | Aids evaluate & monitor the effectiveness and efficiency of activity. | Provide values.
|
| Focus | Strategic | Tactical | Operational |
| Usefulness | To identify trends over time and set goals. | To identify improvement areas of success in the process. | To identify issues and form metrics. |
| Frequency | Tracked on a regular basis – daily, weekly, and monthly. | Tracked on a regular basis – daily, weekly, and monthly. | Tracked at specific points in time. |
| Examples | Net promoter score (NPS), revenue, customer satisfaction index (CSI) | Average handling time, customer retention rate, call volume, conversion rate | Time to complete a task, sales figures, number of leads, number of complaints |
| Usage | To assess general organizational performance. | To monitor and improve specific business performance. | To track performance. |
With Bold BI®, you can create your own interactive dashboards to satisfy your specific business needs. Take a look at the various dashboard examples for Bold BI showcasing real-world KPIs and metrics based on industry, department, and data analytics. For example, the following screenshot shows you a healthcare dashboard visualizing metrics and KPIs useful to a healthcare facility.

To wrap it all up, the future of business intelligence is likely to be characterized by the use of real-time metrics and KPIs to track performance and help business leaders make data-driven decisions.
Get started with Bold BI by signing up for a free trial and create more interactive business intelligence dashboards. You can also contact us by submitting your questions through the Bold BI website or, if you already have an account, you can log in to submit your support question.





