

Revealing data insights of Black Friday Sales

Black Friday provides a win-win situation for customers and retailers. The sales volume constantly increases, with around a $4 billion increase per year for the past four years.
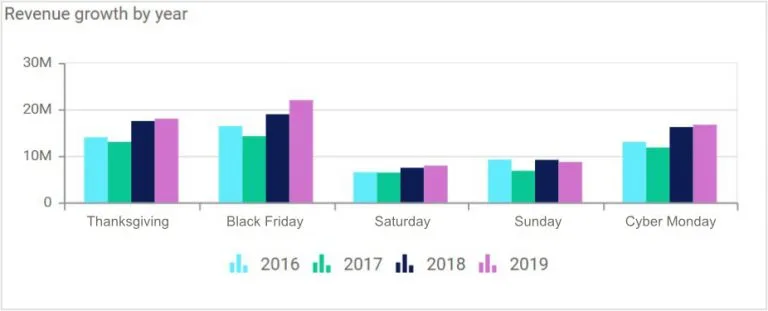
After such busy sales, companies, especially retail owners, will be eager to analyze the results of Black Friday and Cyber Monday sales, including the expense of them. In this blog, let’s look at the important metrics to be checked at this stage with sample data and address some business questions.
As you all know, the main mode of shopping is moving more online than brick and mortar stores. Customers like to shop comfortably, especially for electronic goods, which they are fine with waiting to have delivered to them.
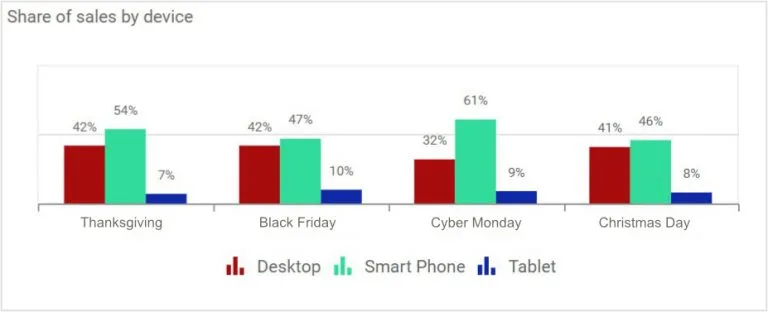
It’s not only retailers Black Friday is a golden source of revenue for. Online advertisements, too, rake in the clicks. Social media and search engines convey the best deals to consumers via ads.
Seasonal hiring
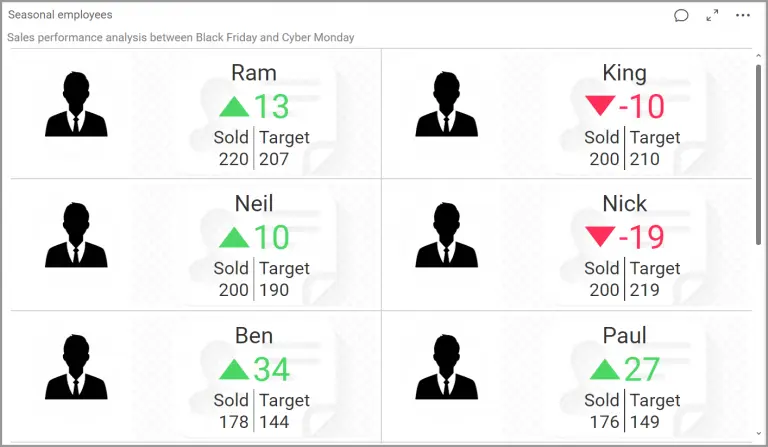
Brick and mortar stores will do a lot of seasonal hiring to handle traffic and sales. It is important to filter out how many employees achieved their sales target. Subsequently, this analysis helps the company or store owner decide the number of temporary employees to be hired for next year’s Black Friday.
Sales metrics
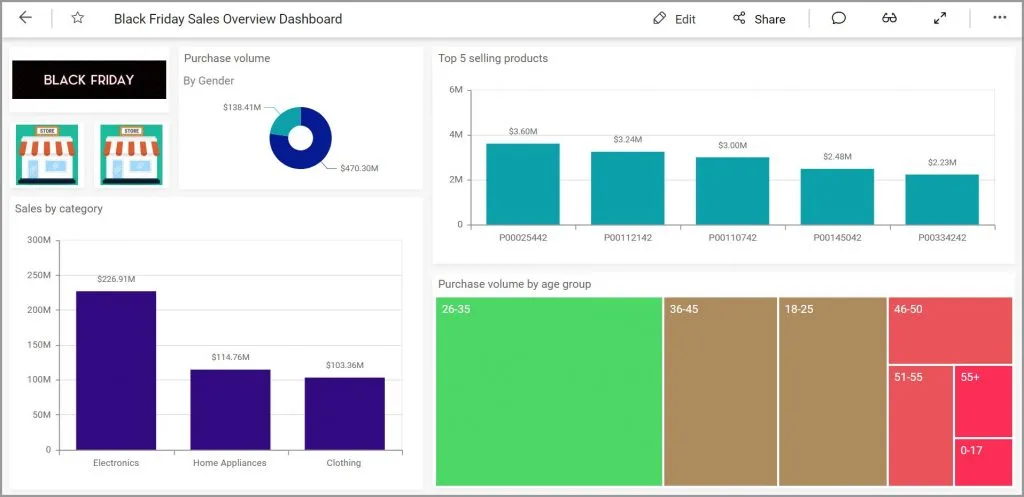
Finally, visualizing sales data in dashboards helps you get insights more easily than working out the data on your own. As you can see from the dashboard, you are able to glean insights like these:
- Top 5 products sold.
- Top 3 product categories with the highest sales volume.
- The purchase volume by gender lets you know the proportion difference between Male and Female.
- The purchase volume differences among age groups. You can see the age group 26-35 is the one who does most purchases.
If you liked this post, we recommend you to take a look at our solution dashboards for Predictive Analytics, Retail industry and more. If you have any questions on this blog, please feel free to post them in the following comment section. Get started with Bold BI® by signing up for a free trial and create more interactive business intelligence dashboards. You can also contact us by submitting your questions through the Bold BI website or, if you already have an account, you can log in to submit your support question.





