

Top 5 Dashboarding Tools to Explore for Snowflake in 2025

TL;DR: Looking to visualize Snowflake data in real-time? This blog reviews five Snowflake‑compatible dashboarding tools for 2025, focusing on performance, live connectivity, self‑service analytics, and embedded BI so teams can choose the right platform to turn Snowflake data into clarity.
Introduction
As cloud data platforms continue to evolve, Snowflake has become one of the most widely adopted cloud data warehouses, particularly for its scalable architecture and managed infrastructure. But to unlock the power of Snowflake, you need the right dashboarding tool that can connect to it, visualize your data, and provide refresh options that can be configured for near real-time updates. This blog explores 5 Snowflake-compatible dashboarding tools that stand out in 2025 for their performance, ease of use, and advanced features.
What are Snowflake-compatible dashboarding tools?
Snowflake-compatible dashboarding tools refer to business intelligence (BI) and data visualization platforms that connect to the Snowflake data cloud to create interactive dashboards and reports. These tools allow users to explore, analyze, and present data stored in Snowflake in a visual format.
Benefits of using dashboarding tools with Snowflake
The following are the key benefits of using Snowflake with dashboarding tools:
- Real-time analytics: Dashboards can access live data from Snowflake, enabling up-to-date insights and faster decision-making.
- High performance and scalability: Snowflake’s architecture separates compute and storage, allowing dashboards to handle large datasets and many users without slowing down.
- Seamless integration: Leading BI tools like Bold BI®, Tableau, and Power BI integrate with Snowflake, making it easy to build and share dashboards.
- Secure data sharing: Snowflake enables secure data sharing across teams or organizations without duplication, enhancing collaboration.
- Support for diverse data types: Dashboards can visualize structured and semi-structured data directly from Snowflake.
- Materialized views and query optimization: These Snowflake features reduce query times and resource usage, improving dashboard performance.
Key features to look for in a Snowflake-compatible dashboarding tool
When selecting a dashboarding tool to use with Snowflake, consider the following:
- Seamless integration with Snowflake: Your dashboarding tool should integrate with Snowflake through supported connectors or drivers for seamless data access and compatibility with its architecture.
- Real-time data access and live connectivity: The dashboarding tool should support live connections to Snowflake or scheduled refresh options for timely analytics, enabling you to view current data based on your refresh and caching settings.
- Advanced data visualization capabilities: The ability to create rich, interactive dashboards with customizable charts, filters, drill down, and responsive layouts enhances usability and storytelling across teams.
- Embedded analytics and customization: The BI platform should support embedded analytics with options for custom branding, API access, and white-labeling to integrate dashboards into internal portals or customer-facing applications.
- Scalability with Snowflake’s architecture: The tool must provide robust security and governance with role-based access, row-level security, and controls that can support your organization’s compliance requirements, which should be evaluated case by case.
- Robust data governance and security: The tool must provide robust security and governance with role-based access, row-level security, and compliance with legal standards relevant to your industry and the countries you operate in.
- Intuitive user experience and self-service BI: The dashboarding platform should provide an intuitive interface with drag-and-drop functionality and self-service BI features, enabling nontechnical users to explore data without relying on IT for many common use cases.
- Real-time data alerts: Get notified instantly when critical metrics or thresholds are reached, enabling timely decisions without manual monitoring.
- Collaboration and sharing features: The dashboarding platform should enable collaboration through features like dashboard sharing, commenting, version control, and integration with tools like Slack or Teams for efficient workflows.
- Cost-effectiveness and licensing flexibility: The dashboarding platform should offer transparent, flexible pricing models, whether it’s a subscription, usage-based, or enterprise licensing. There should be a clear ROI and minimal hidden costs.
Top 5 Snowflake-compatible dashboarding tools
1. Bold BI
Bold BI® is the enterprise AI and embedded analytics solution created by Syncfusion. It allows you to embed powerful analytics and business intelligence dashboards directly in your apps and bring your data into it to uncover actionable insights. It supports over 140 data sources, including Snowflake, allowing users to visualize their data no matter where it is stored. With 35+ customizable widgets, Bold BI empowers users to create stunning dashboards anytime, anywhere.
Key features
- Real-time data connectivity: Bold BI supports live connections to Snowflake, allowing dashboards to query data in real time, depending on connection mode, caching, and refresh settings.
- Customizable widgets and layouts: With Bold BI, you can design Snowflake dashboards with a drag-and-drop interface and a wide selection of widgets, including charts, gauges, and maps, with no-code dashboard authoring for many common use cases.
- Embedded analytics: Embed dashboards powered by Snowflake data directly into your web or mobile applications, keeping insights accessible within the tools your users already use.
- AI-driven analytics: Bold BI includes an AI Copilot, generative narratives, and prompt-to-dashboard features that allow users to explore Snowflake data using natural language, accelerating analysis and decision-making.
- Interactive dashboards and data visualizations: Transform complex Snowflake datasets into clear visuals. Features like filters, drill down, and parameters enable dynamic exploration and deeper insights.
- Self-service analytics: Empower users to create and customize dashboards independently using Bold BI’s intuitive designer. Minimize IT dependency while enabling fast, informed decisions based on Snowflake data.
- Collaboration: Teams can collaborate on dashboards built with Snowflake data by sharing, commenting, and co-analyzing in real time.
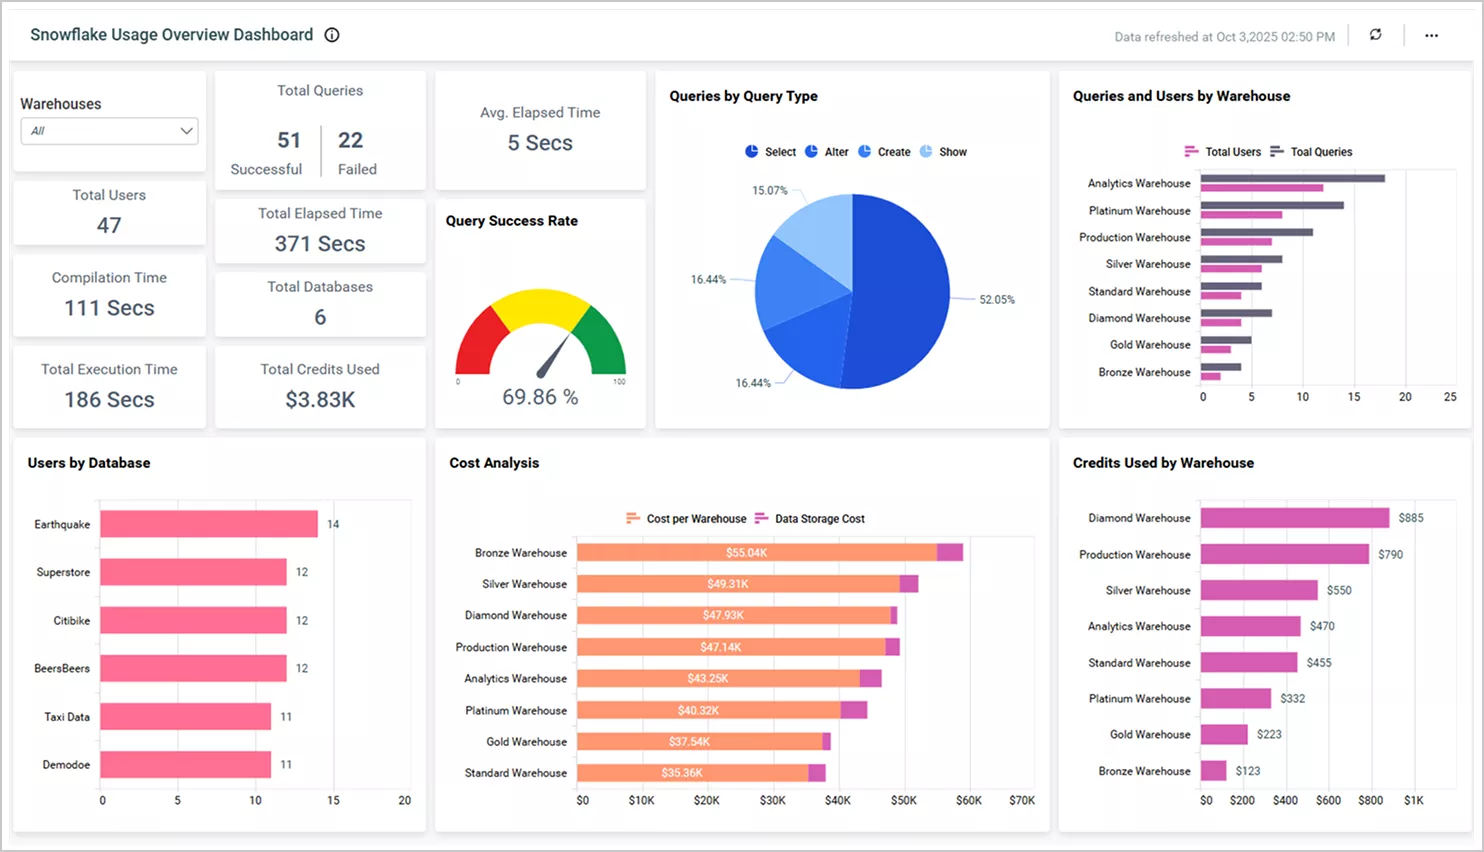
Snowflake dashboard example in Bold BI
This Bold BI Snowflake dashboard example showcases how data from a Snowflake data warehouse can be visualized to monitor and optimize system performance. It includes metrics such as queries by query type, query success rate, queries and users by warehouse, users by database, credits used by warehouse, and cost analysis, helping teams identify inefficiencies and manage resources effectively. With interactive charts and usage breakdowns by database and user, this dashboard enables data-driven decisions for Snowflake operations.
2. Power BI
Power BI is Microsoft’s business intelligence and data visualization platform designed to help organizations turn raw data into actionable insights. It integrates with Snowflake, allowing users to securely connect to their Snowflake data warehouse, build dashboards, and share metrics across teams and platforms.
Key features
- Collaboration and sharing: Power BI enables secure sharing of dashboards built with Snowflake data across platforms like Microsoft Teams, SharePoint, and email.
- Data integration: Power BI offers connectors to connect to Snowflake, allowing you to pull Snowflake data into your reports and dashboards based on your selected connection and refresh options.
- AI-powered analytics: Power BI’s Copilot uses natural language processing to help users explore Snowflake datasets, generate insights, and create visualizations.
- User-friendly design tools: Build interactive dashboards using Power BI’s drag-and-drop interface. Visualize Snowflake data with charts, maps, slicers, and filters.
3. Tableau
Tableau is a BI and data visualization platform designed to help users transform raw data into dashboards. It integrates with Snowflake, allowing users to connect securely to their Snowflake data warehouse and visualize its data using live connections or extracts, depending on configuration.
Key features
- Drag-and-drop interface: Tableau enables users to create dashboards from Snowflake data using a visual, code-free interface.
- Data integration: Tableau connects to your Snowflake data warehouse, allowing you to securely access and visualize Snowflake data.
- Enterprise-grade security and governance: Tableau supports secure access to Snowflake data through robust standard compliance, role-based permissions, and identity management integration.
- AI assistant: Its AI-powered assistant helps users explore their Snowflake datasets by suggesting insights and visualizations.
4. Looker
Looker is a business intelligence and data analytics platform that enables organizations to analyze and visualize data in real time. It lets teams make data-driven decisions by connecting to a wide range of data sources, including Snowflake, and delivering customizable dashboards and embedded analytics.
Key features
- Customizable visualizations: Looker allows users to build dashboards and visualizations using its modeling layer and web-based interface, enabling governed analytics built on top of Snowflake data.
- Direct Snowflake connectivity: Looker connects to your Snowflake data warehouse via supported connectivity options, enabling analysis across multiple cloud platforms and applications.
- Collaboration and sharing: Users can share dashboards built with Snowflake data in real time or on a scheduled basis, or embed them into websites, intranets, and business apps.
- Flexible embedding: Looker provides APIs and SDKs for embedding dashboards and analytics built using Snowflake data directly into applications.
5. Qlik
Qlik is a self-service BI and analytics platform that lets users visualize and analyze data to make data-driven decisions. Known for its associative data engine and in-memory processing, Qlik provides connectivity options for Snowflake through native connectors and cloud integrations.
Key features
- AI-powered analytics: Qlik leverages natural language queries, predictive analytics, and generative AI to help users explore Snowflake data.
- Data integration: Qlik offers connectors to connect to Snowflake based on your selected connection method and settings.
- Interactive dashboards: Through Qlik Sense, users can interact with dashboards powered by Snowflake data using dynamic filters, drill downs, and responsive designs.
2025 has brought numerous innovations and integrations to cloud data warehouses and their compatible analytics platforms. Choosing the best dashboarding tool for Snowflake can make a significant difference in how teams analyze data.
Why choose Bold BI as your Snowflake-compatible dashboarding tool?
Snowflake-compatible dashboarding tools visualize your data in such a way that turns complexity into clarity.
If your data resides in Snowflake, Bold BI® can help you turn it into insights with real-time visualization, embedding, and AI-powered analytics, with no-code dashboard building for many common use cases and low-code options for embedding and advanced customization. Bold BI makes it easy to create interactive dashboards, share insights across teams, and embed analytics directly into your applications, all while maintaining secure connectivity to your Snowflake data warehouse.
Ready to explore Bold BI for your Snowflake dashboards? Start your free trial today or request a personalized 30-minute demo with our support team for a walkthrough of our product.





