


-
Boost Oil and Gas Production Using Embedded Analytics
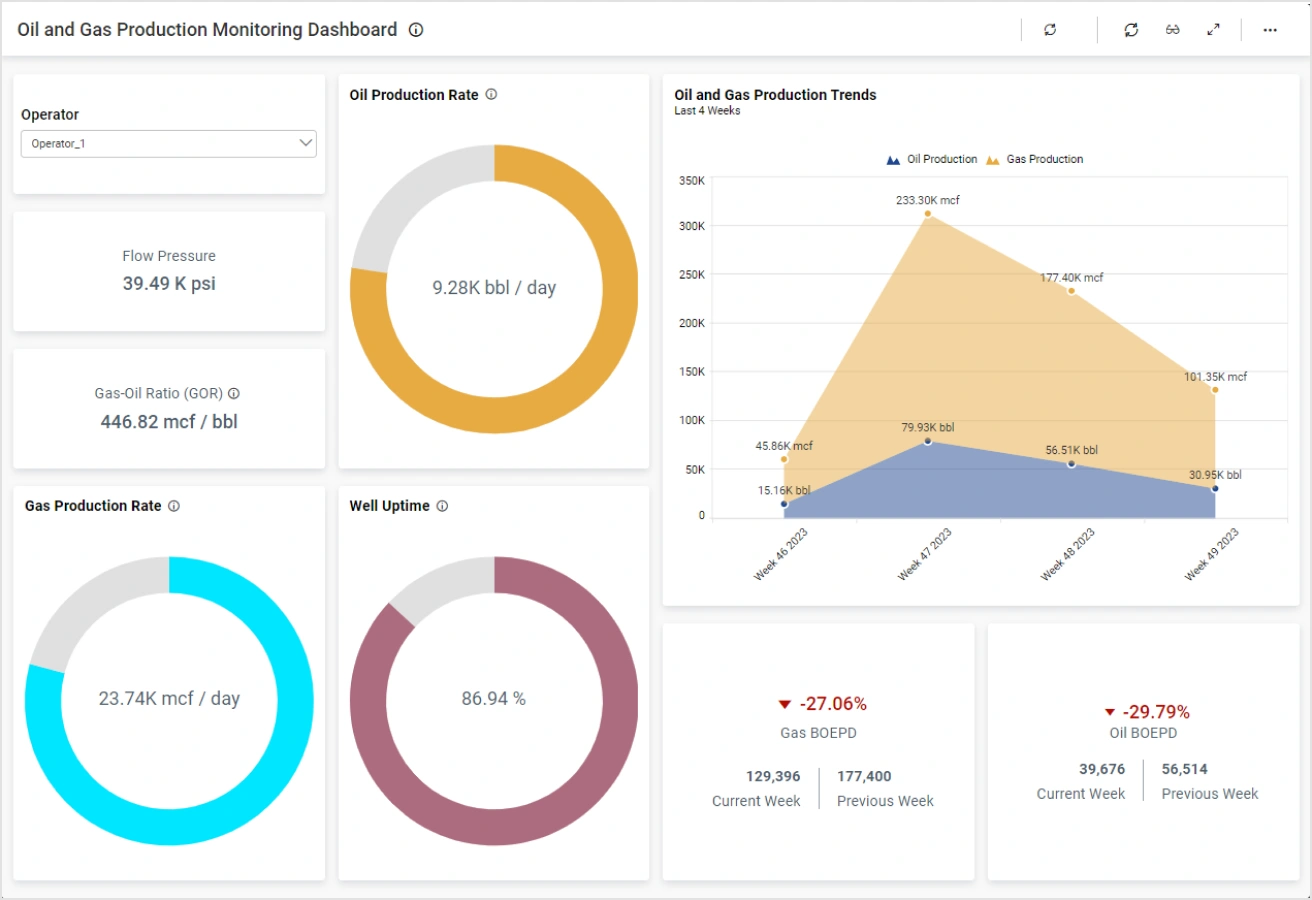
 This blog shows how Bold BI® uses embedded analytics dashboards to monitor oil and gas production metrics and improve operational decision-making.
-
Manage the Oil and Gas Industry Effectively with Embedded BI
This blog explains how Bold BI® helps oil and gas companies create dashboards to monitor key operational and financial metrics—such as production, revenue, and efficiency—enabling better performance tracking and decision-making.
-
Benefits of Embedded Analytics for the Oil and Gas Industry
This blog explains how embedded analytics with Bold BI® helps oil and gas companies gain real-time insights into production, equipment performance, and operational trends through dashboards, improving decision-making and efficiency.
