
Monitor & Increase Website Traffic Using Embedded Analytics


Introduction
People access websites to acquire knowledge. Today, online businesses dominate globally by providing extensive data access quickly. This has increased the work of marketing departments, as leaders can now easily determine what makes visitors sign up for a product or frequently visit their site.
By embedding a Google Analytics website traffic dashboard in your business website, you will be able to analyze website traffic performance using Google Analytics data, allowing you to gain insight into your visitors’ interactions with your products. This helps you easily know the effects of your customers’ behavior on your company, and it allows you to make better decisions that will reduce negative impacts and increase profit in the long run.
In this blog post, I am going to give you an overview of how Bold BI® helps marketing managers track website traffic data, see all the information they need, and make decisions based on analytics. I’ll cover the following topics:
- What is embedded analytics?
- Benefits of embedding a website traffic analysis dashboard
- Bold BI’s website traffic analysis dashboard example
- How to embed analytics tools into a marketing domain apps
What is embedded analytics?
Embedded analytics is the integration of analytical solutions and data visualization capabilities into a software application’s user interface to improve data comprehension and usability. Bold BI helps you easily embed an analytics solution into your everyday work applications using a JavaScript SDK and a server application. It enables non-technical marketers to monitor data sets with attractive dashboards and glean all the valuable insights they need to improve organizational and workforce outcomes in marketing as well as attract many visitors to their websites.
Benefits of embedding a website traffic analysis dashboard
Online businesses prefer web traffic for data analysis to measure its effectiveness, making it attractive to a large audience. This gives information for each person who accesses the site, enabling the company to easily identify the sessions taken, percentage of purchases, bounce rates, and more.
The following explains how embedded analytics has influenced online business:
- Improving audience engagement
- Providing better ways of acquiring users
- Realizing top-performing referrals
- Optimizing website ranking
Improving audience engagement

Embedded analytics helps leaders monitor average session duration and bounce rate metrics to know how long their users stay on their websites and why some leave after viewing only one of the pages on a site or without visiting other pages. With this information, website managers can dig deep into the content they provide in different sites to determine whether it is well explained. They can also determine whether links could open to other pages in the same site easily. This enables them to gain insight that will help them provide more interesting content that matches their users’ intent and thus increases engagement with their websites.
Providing better ways of acquiring users

Embedded analytics has provided marketing leaders with new ways of retaining their customers and attracting new visitors to their websites, which has generated an increasing number of users for their sites. It has made it much more possible for analysts to use the minimum time possible while tracking potential customers and the products they signed up for. By monitoring metrics such as users, new users, and channel-wise users, marketers get information about the channels through which many visitors are acquired. They can also see which products have a high number of new users signing up on the same day.
With this knowledge, leaders can easily identify new sources from which their daily analysis will be done and reduce the time they spend looking for profitable users and the products they need. They can also identify high-selling products in the industry and channels they should use for acquiring customers. This allows them to put more effort into providing quality products to users based on their demands, even offering training courses to new users on products to guide them on how to use those products before making purchases.
Realizing top-performing referrals

Embedded analytics helps in tracking top-performing referrals. With this insight, leaders can identify repeated users and visits for each site, or pages with high clicks to determine secrets in them. This helps in using new strategies for achieving high numbers of visitors from search engines. As a result, the website will look for different ways of increasing online visibility to gain a high traffic.
Optimizing website ranking

Embedded analytics allows you track and monitor country-wise session metrics to get information about different countries’ interactions on your websites. This helps you know countries that generate a high number of visitors and work with the result to boost the quality of the products that they sign up for. With this insight, a company can also rank its users based on their places of origin and know the country they need to invest highly in. Also, they can use the results from the analysis to find the resons behind a decrease in the rate of users from a certain country to know where the problem lies. This enables analysts to know whether the products they sell complement the country’s culture or not, or whether they are producing the right products and services customers from that country would sign up for. This allows them to make proper decisions that will enable them to retain users for their websites as they increase revenue.
Bold BI’s website traffic analysis dashboard example
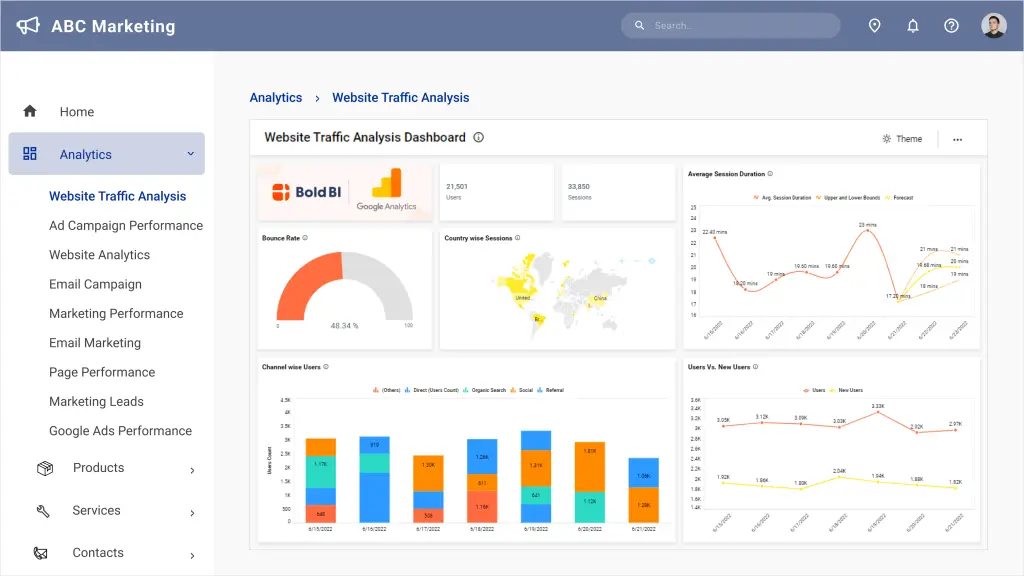
Embedding a website traffic analysis dashboard helps analyze website traffic using Google Analytics data, gaining insights over user visits, country-wise sessions, and the traffic over the previous week.
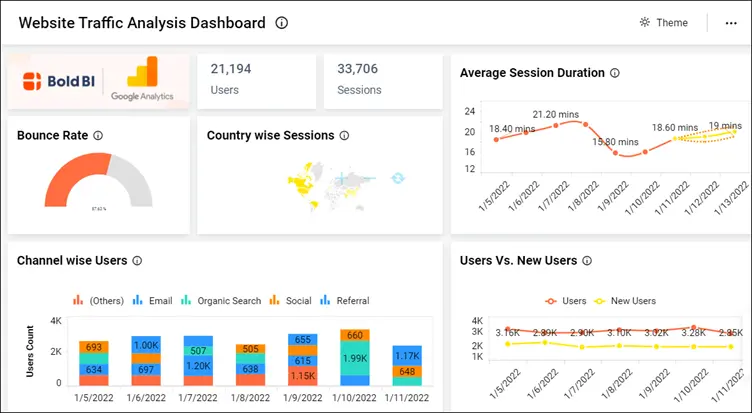
Key metrics and KPIs:
- Users
- Sessions
- Bounce rate
- Country-wise session
- Channel-wise users
- Average session duration
- Users vs new users
Users
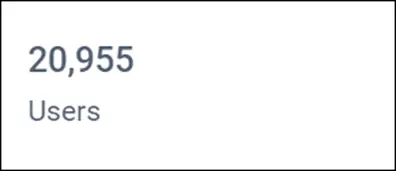
This card shows the number of people who use the website. It allows managers to monitor past and present numbers to compare periods in which there was a decrease and an increase in the number of users interacting with their website.
Sessions

This card shows the number of times customers interact with a site. With this metric, you can easily determine your potential customers based on their interactions with your sites, as you can easily identify new users and repeated visitors within a given period of time.
Bounce rates
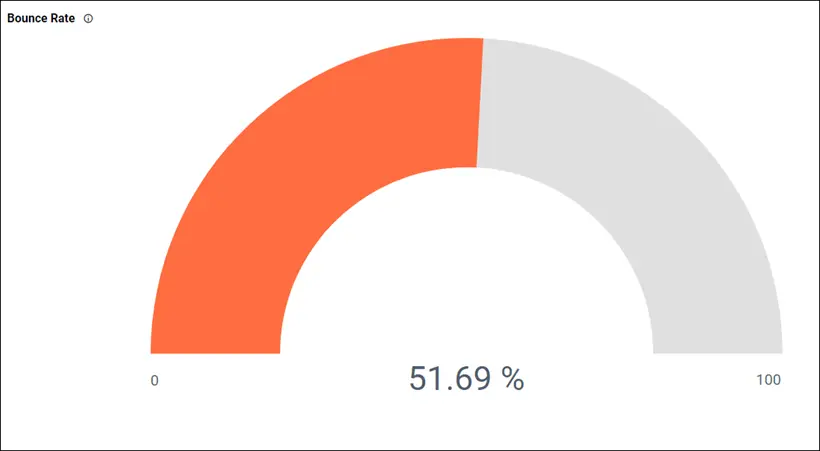
This radial gauge shows the behavior of users who visit the website or a page within the website. It helps you know the percentage of users who visit your department site and leave without viewing other pages on the same site. This allows you to look for the root of the matter, know whether your content was misleading, and make decisions that will help you reduce bounce rates in the future.
Country-wise sessions
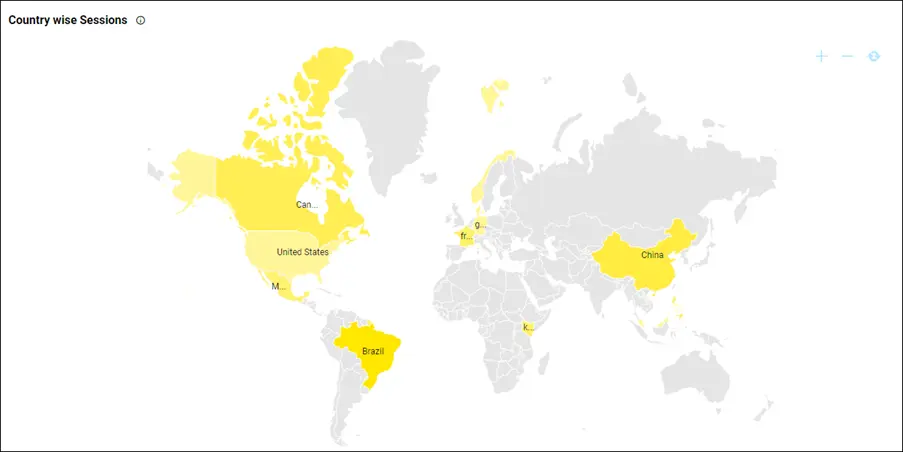
This choropleth map helps in tracking website sessions based on country of origin. This allows you to know countries that generated a high number of website sessions for your company and work with the result to boost the quality of the product that attracted them to your company.
Channel-wise users
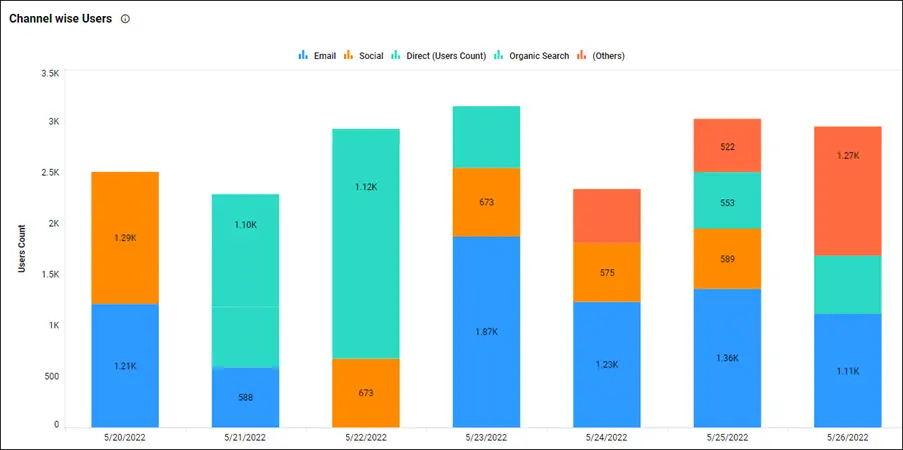
This stacked column chart showcases user count by the last seven days with channel sources such as email, social, direct, organic search, and others. This helps marketing leaders know which sources are gaining more users, which helps in making decisions to produce more content for that source.
Average session duration
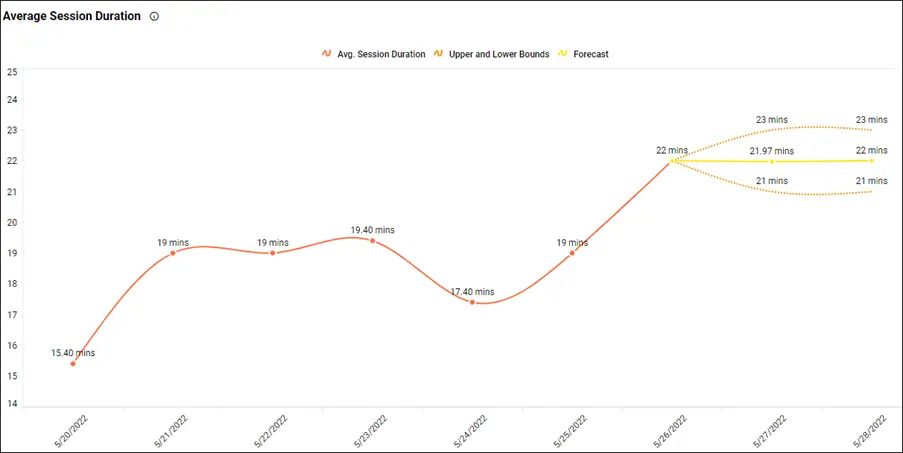
This spline chart measures how long visitors spend time on your entire website. It allows leaders to analyze the average session duration of a website for approximately one week to determine the days in which their visitors spent time on their sites. This helps them know sites with good information, making them worthy of ranking well, and forecasting their content.
Users vs new users
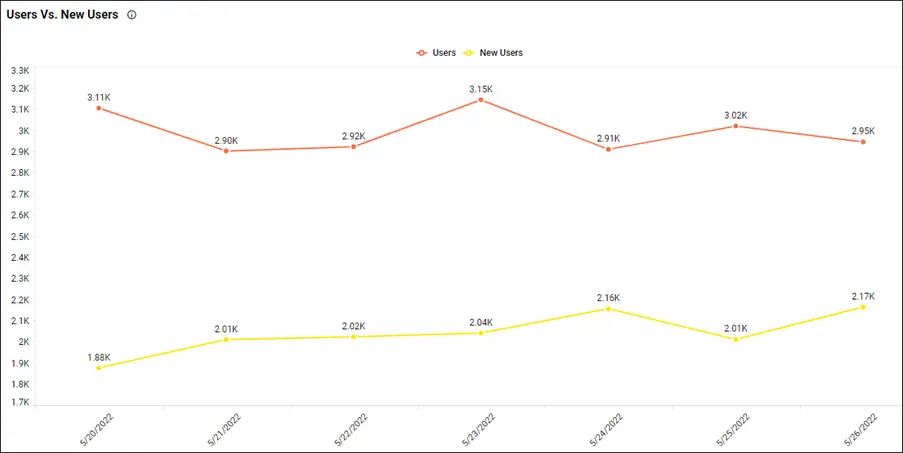
This line charts show the total number of previous users and new customers acquired during the reporting period. It helps you compare the rate of customer churn and the number of individuals who newly visited the site to identify what attracted those visitors to the site and what caused some customers to churn.
How to embed analytics tools into a marketing domain apps
Let’s see how analytics can be embedded into marketing web applications. Bold BI can embed your dashboards in more than 18 web platforms, including React with ASP.NET Core, React with Go, WinForms, Node.js, Vue with Go, and Vue with ASP.NET Core, and more. In this blog, I am going to provide a walkthrough specifically on embedding dashboards in ASP.NET MVC applications.
Suppose your marketing company has a website like the one shown in the following image.
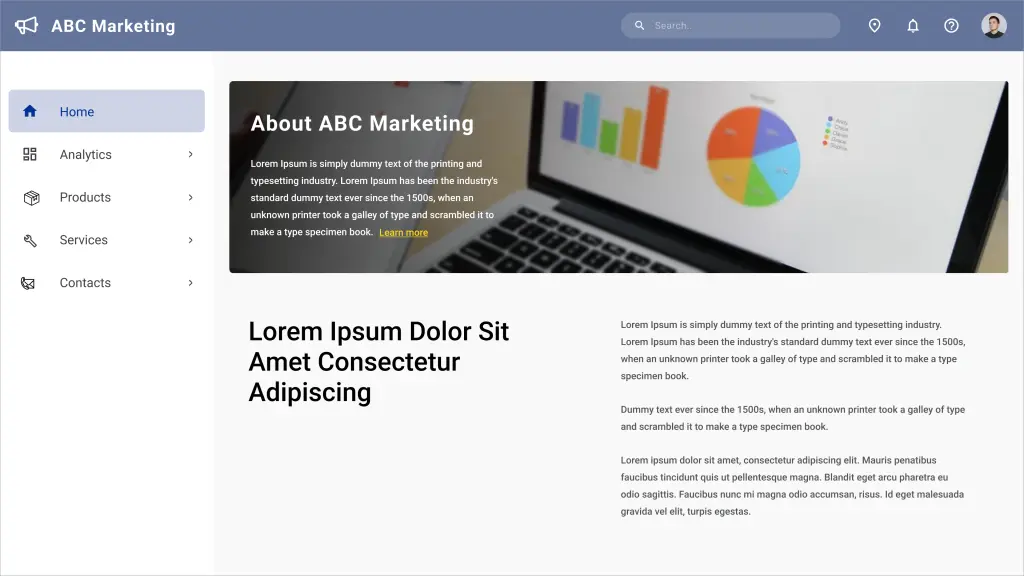
You can embed dashboards easily using Bold BI and avoid building an analytics or BI solution yourself. Follow these steps to embed your dashboard successfully.
Prerequisites
Download and install the Bold BI server on your local machine and create an enterprise-grade dashboard. You can find the installation and deployment instructions here.
Step 1: Creating an ASP.NET MVC application.
To successfully embed a dashboard in your application, first you need to create an ASP.NET MVC application. Open Microsoft Visual Studio and click New Project. Then choose ASP.NET MVC Web Application, enter the project name, and click OK.
Step 2: Configure embed properties.
After the ASP.NET MVC web application is created, you need to create a Model class called EmbedProperties under Models and provide the dashboard RootURL, SiteIdentifier, Environment, UserEmail, and EmbedSecret.
| Properties | Property Value Descriptions |
| RootUrl | Dashboard server BI URL. For example:https://localhost:58094/bi. |
| SiteIdentifier | For Bold BI Enterprise edition, it should be something like “site/site1”.For Bold BI Cloud edition, it should be an empty string. |
| Environment | Bold BI application environment.For Bold BI Cloud, you can use “cloud”.For Bold BI Enterprise, you should use “enterprise”. |
| UserEmail | Bold BI server will use an email to authorize the authorization server. |
Step 3: Generate an embed secret.
You have to set the EmbedSecret for authentication. You can get the embed secret from the Bold BI server. Then, navigate to the Settings icon in the left navigation bar and click the Embed tab. Click Enable embed authentication and then click the Generate Secret button to generate the embed secret. On clicking the button, a secret key will be generated, and you can paste it into the application. To learn how to do this in more detail, you can refer to this documentation link.
Note: Save the secret key, as it cannot be retrieved again. If you do not save it, you will have to generate a new one using the Reset Secret option.
Step 4: Create authorization server.
You need to implement an authorization server in the ASP.NET MVC application to be authenticated before embedding the dashboard from the Bold BI server. You can also configure the single sign-on (SSO)-based authorization server, which is an authentication endpoint that enables users to securely authenticate multiple applications using unique embed secrets. This prevents the need for the user to log into different applications separately.
Step 5: Create a Bold BI instance.
Finally, create a Bold BI instance to load the dashboard using a JavaScript file. Reference required script files and CSS files in the HTML pages.
Step 6: Run the application to embed the dashboard.
After successfully creating the ASP.NET MVC application, you need to run it. It will be launched successfully with the dashboard details. Finally, you can see that the dashboard created in the Bold BI server is embedded in your web application.
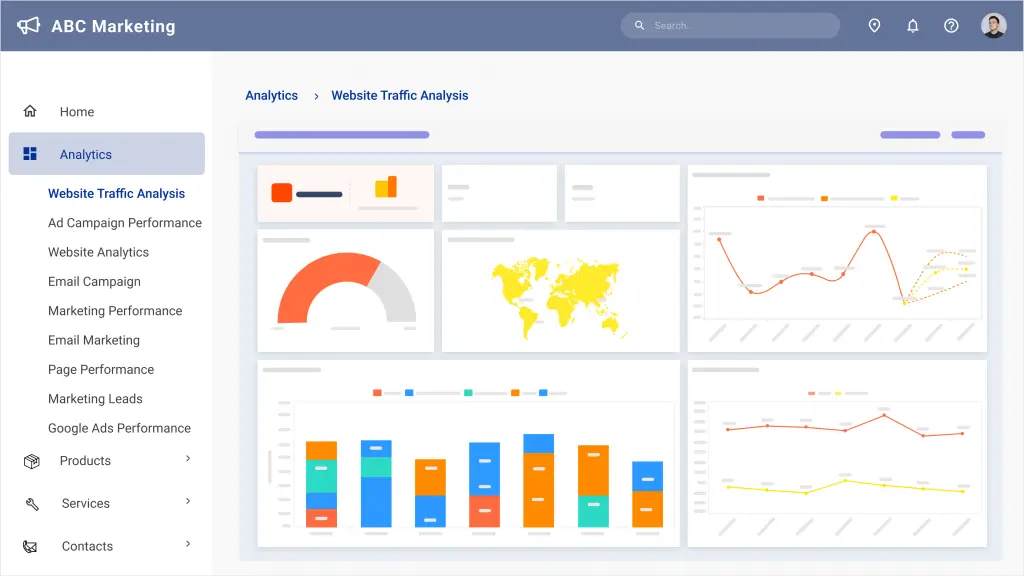
By following the previous steps, you can successfully embed your dashboards into your ASP.MVC application.
To learn more about embedding dashboards into your applications, please refer to this blog. You can also download the sample code mentioned in all these steps from our documentation.
Conclusion
Bold BI® helps you integrate dashboards in your applications written in ASP.NET Core, ASP.NET MVC, ASP.NET, and Ruby on Rails. It will save you time by preventing you from doing unnecessary work. Click this link to explore its features. To learn more about embedding dashboards into your application, refer to this blog and our help documentation.
Now that you have a better understanding of Bold BI and how it can help you be more successful in your online business, we hope you’ll create a dashboard the way you like with Bold BI’s 35+ widgets and 150+ data sources.
Get started with Bold BI by signing up for a free trial and create interactive business intelligence dashboards. You can contact the Bold BI team by submitting questions through Bold BI websites or log in to your Bold BI account.




