

Effectively Monitor Email Marketing Campaigns with Embedded Analytics

Introduction
Emailing is one of the key ways to reach not only one person, but multiple people globally at once. Business managers have grabbed this opportunity to reach their customers by updating them and marketing products and services through this channel. But managers face challenges managing emails and customers’ reactions to their services. Also, retention of unique viewers and longtime viewers is a challenge.
Using embedded analytics to track email campaign performance helps managers easily manage and reach multiple customers in time, allowing those managers to follow and respond wisely to feedback about services and products. It also provides a platform for many users on one server, simplifying the working relationship between users and timely notifications, responding to customers fast.
In this blog post, I am going to teach you, through the following sub-topics, why to apply embedded analytics to your daily business operations:
- What is embedded analytics?
- Benefits of embedded analytics in an email campaign performance dashboard
- Bold BI’s email campaign performance dashboard
- How to embed analytical tools into marketing domain apps
What is embedded analytics?
Embedded analytics is integrating analytical solutions and data visualization capabilities into a software application’s user interface to improve data comprehension and usability. Bold BI® helps you easily embed an analytics solution into your everyday work applications using a JavaScript SDK and server application. It also enables non-technical people to monitor data sets with attractive dashboards and glean all the insights they need to improve organizational and workforce outcomes.
Benefits of embedded analytics in an email campaign dashboard
Embedded analytics for email campaign performance gives you higher returns and expands your business into other industry sectors by controlling operations. This is achieved by tracking key metrics and KPIs in a dashboard. In this area, I am going to discuss some of the key benefits gained by using embedded analytics, including:
- Improved decision-making
- Building strong customer relationships
- Easily sharing timely campaigns
- Optimizing your budget
Improved decision-making

Embedded analytics in measuring email campaign performance gives a clear vision of your company’s progress. Tracking key metrics and KPIs—such as conversions, forwards, bounce rates, and spam complaints—in a dashboard helps team leads make the right decisions for challenges hindering the campaign. It also helps improve services by addressing customer complaints. Through these insights, team leads ensure the campaign is successful and productive by preventing email bouncing.
Building stronger customer relationships

Using embedded analytics to measure email campaign performance creates long-term customer relationships by tracking key metrics such as subscriber lifetime value, share rate, subscribers, subscriber acquisition cost, and more. Customer acceptance of products and services leads to a higher subscribing rate, resulting in more customers. This encourages your team to work efficiently by producing quality products to satisfy their customers. Furthermore, your company can easily communicate with customers and provide them with offers for services at a lower rate. With the sales teams working in place, customers rate their satisfaction highly, increasing clients.
Easily sharing timely campaigns

Embedded analytics for email campaign performance tracks key metrics and KPIs such as the number of emails successfully delivered, the number of emails opened, the click rate, and the open rate. Tracking these metrics helps teams efficiently attend to email in time by category.
The teams’ workflows are faster, timely, and sufficient to react to customer feedback and emails. This builds the mailing process of the company and keeps customers updated on the company’s changes, improvements, and new products. It also enhances customer monitoring and improves work based on customer feedback.
Optimizing your budget

Embedded analytics for email performance helps you track investment and revenue by campaign date, return on investment, growth rate, and more. By monitoring these metrics, managers have an overview of the money flow during a campaign, which helps them optimize their budget plan to effectively run the process for better returns per campaign. It also helps them have insight into the performance of the campaign by the profit growth rate and the target, leading to proper planning of the next budget with an allocation of funds to improve the campaign by increasing the investment.
Bold BI’s email campaign performance dashboard
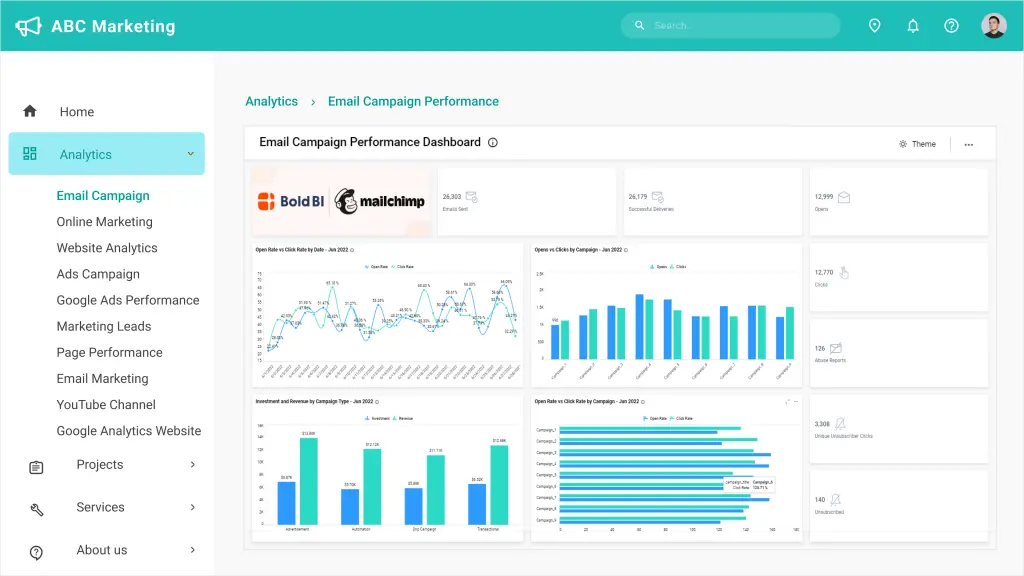
Embedding an email campaign performance dashboard gives you insight into email data, such as Mailchimp data, allowing you to quickly identify trends within your campaigns and explore how those trends have changed over time.
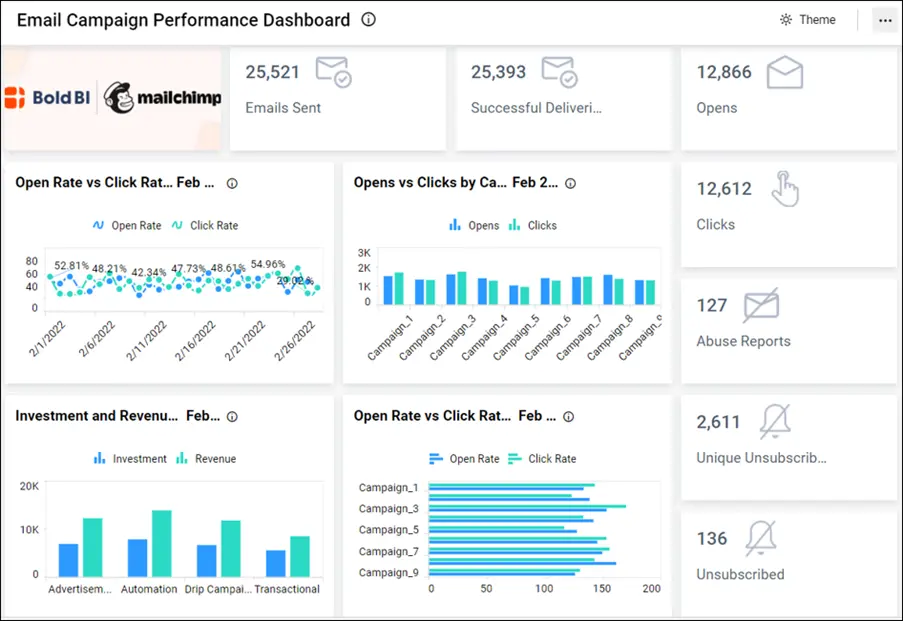
The following KPIs are visualized in the dashboard:
- Emails sent
- Successful deliveries
- Opens
- Clicks
- Abuse reports
- Unique unsubscribers
- Unsubscribed
- Open rate vs click rate by date
- Opens vs clicks by campaign
- Investment and revenue by campaign type
- Open rate vs click rate by campaign
Emails sent
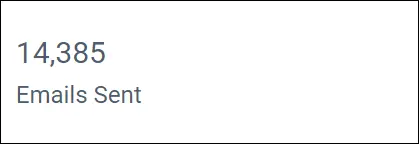
This card widget shows the number of emails sent for a selected month. It is emails shared through the campaign session.
Successful deliveries

This card widget shows the number of successful deliveries for a selected month. It is emails that the intended recipients have received.
Opens

This card widget shows the number of emails opened for a selected month.
Clicks

This card widget shows the number of clicks for a selected month. It is the number of viewers accessing the emails.
Abuse reports

This card widget shows the number of abuse reports for a selected month. It is negative feedback from recipients after receiving emails concerning services.
Unique unsubscribers
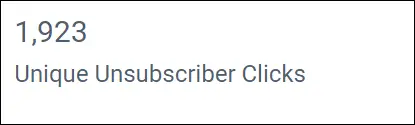
This card widget shows the number of unique unsubscriber clicks for a selected month. These are first-time recipients unsubscribing to the emails.
Unsubscribed

This card widget shows the number of page unsubscribes for a selected month. It represetns emails in which the recipient canceled a subscription after receiving them.
Open rate vs click rate by date
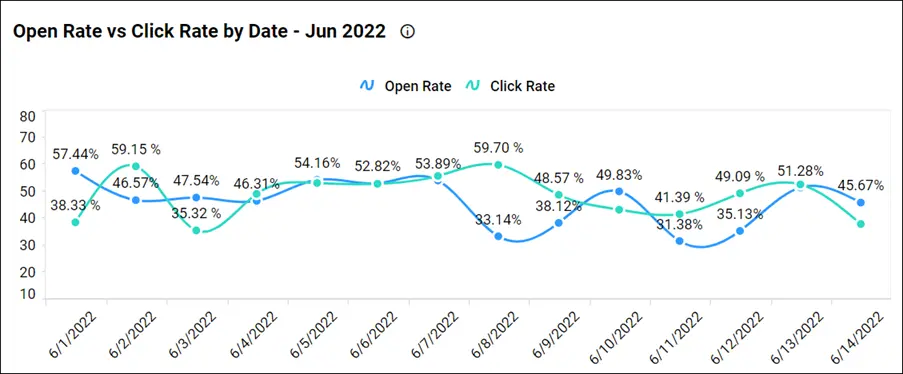
This spline chart tracks open and click rates for emails for a month. This helps the marketing manager see how the campaign pattern moves, letting the manager know how the company is developing in terms of services and products. Through this, the manager places effort into the struggling department to improve the stability of the campaign.
Opens vs clicks by campaign
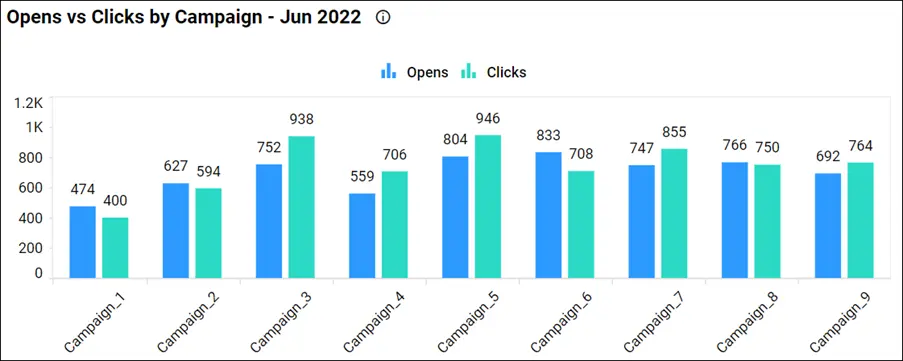
This column chart tracks the open count and the click count for email for a month. By knowing this, the campaign manager is able to strategize how best to approach a number of customers, hence the growth of the campaign graph.
Investment and revenue by campaign type
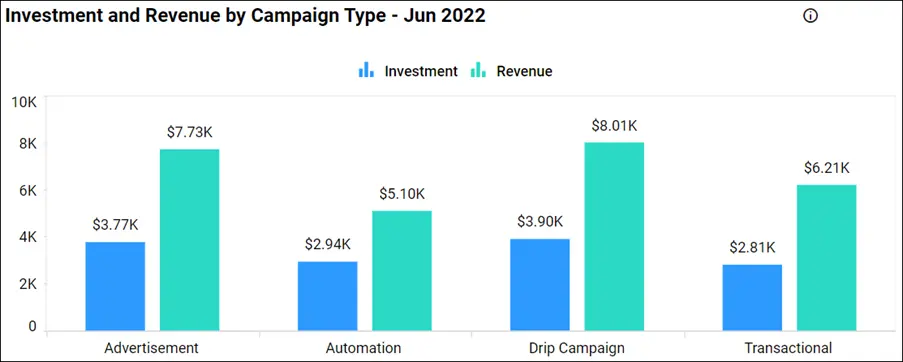
This column graph shows total investment and revenue by campaign type for the current month. This provides the campaign manager with insight into the revenue stats of the campaign, which helps budgeting on a monthly basis, enabling better decisions on how to improve the investment.
Open rate vs click rate by campaign
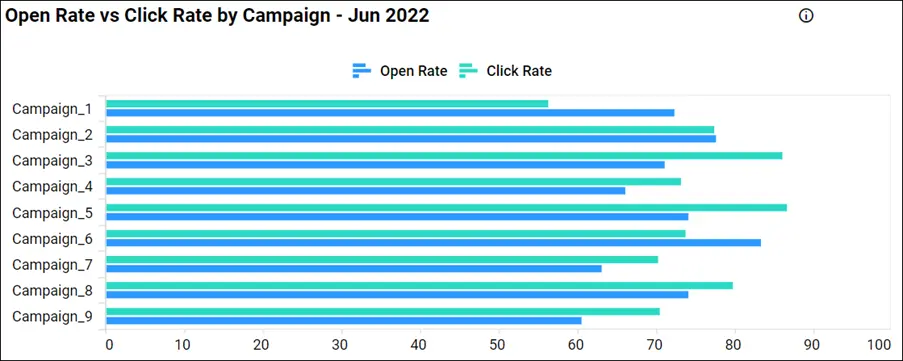
This bar graph shows open rates and clicks rates for emails for a month. This helps the marketing team check on their progress regarding campaigns to see where to improve and to ensure the rating increase.
To learn more about the metrics and KPIs used in this dashboard example, refer to the Email Campaign Performance demo.
How to embed analytical tools into marketing apps
Let’s see how analytics and dashboards can be embedded into a marketing ASP.NET MVC web application. Consider a scenario where your marketing department has a website like the one shown in the following image.
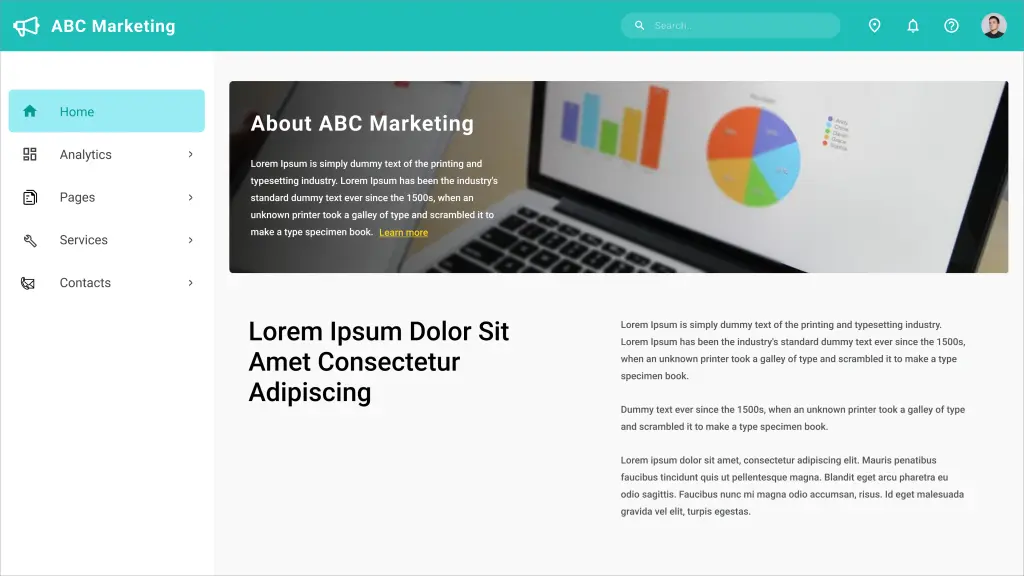
You can embed dashboards easily using Bold BI and avoid building an analytics or BI solution yourself. Follow these steps to embed your dashboard.
Prerequisites
Download and install the Bold BI server on your local machine and create an enterprise-grade dashboard. You can find the installation and deployment instructions here.
Step 1: Create an ASP.NET MVC application.
First, create an ASP.NET MVC application. Open Microsoft Visual Studio and click New Project. Then choose ASP.NET MVC Web Application, enter the project name, and click OK.
Step 2: Configure embed properties.
After the ASP.NET MVC web application is created, you need to create a model class called EmbedProperties under Models and provide the dashboard RootURL, SiteIdentifier, Environment, UserEmail, and EmbedSecret.
| Properties | Property Value Descriptions |
| RootUrl | Bold BI dashboard server URL. For example: https://localhost:5000/bi. |
| SiteIdentifier | For Bold BI, it should be something like “site/site1.”For the Bold BI Cloud Analytics Server, it should be an empty string. |
| Environment | Your Bold BI application environment. If using Bold BI Cloud Analytics Server, you should use “cloud.” If using Bold BI, you should use “enterprise.” |
| UserEmail | The Bold BI server will use an email address to authorize the authorization server. |
Step 3: Generate embed secret.
You have to set the embed secret for authentication, and you can get it from the Bold BI server. Click the Settings icon in the left navigation bar and then click the Embed tab. Click Enable embed authentication and then click the Generate Secret button. On clicking the button, a secret key will be generated. Copy the secret key and paste it into the application. To learn how to do this in more detail, you can refer to this documentation link.
Note: Save the secret key, as it cannot be retrieved again. If you do not save it, you will have to generate a new one using the Reset Secret option.
Step 4: Create an authorization server.
You need to implement an authorization server in the ASP.NET MVC application before embedding the dashboard from the Bold BI server. You can also configure the single sign-on (SSO)-based authorization server, which is an authentication endpoint that enables users to securely authenticate multiple applications using unique embed secrets. This prevents the need for the user to log in to different applications separately.
Step 5: Create a Bold BI instance.
Finally, create a Bold BI instance to load the dashboard using a JavaScript file. Reference the required script files and CSS files in the HTML pages.
Step 6: Run the application to embed the dashboard.
After creating the ASP.NET MVC application, you need to run it. It will be launched with the dashboard details. Finally, you can see the dashboard created in the Bold BI server is embedded in your web application.
To learn more about embedding dashboards into your ASP.NET MVC applications, refer to this blog. You can also download the sample code used in the previous steps from our documentation.
Conclusion
Bold BI® integrates dashboards into applications written in ASP.NET Core, ASP.NET MVC, Angular, ASP.NET, and Ruby on Rails. It will save time and prevent you from doing redundant work. Click this link to explore its features.
I hope now you have a better understanding of Bold BI and how it can help email campaigns be more successful. You can create a dashboard any way you like with Bold BI’s 35+ widgets and 150+ data sources.
Get started with Bold BI by signing up for a free 30-day trial and begin creating interactive business intelligence dashboards. You can contact us by submitting questions through the Bold BI website or, if you already have an account, you can log in to submit your support questions.





