webinar announcement icon

announcement icon Webinar - 9th Apr 2026, 10:00 AM ET

Webinar: Personalizing Dashboards with Role-Based Access and Row-Level Security

webinar banner line

10:00 AM ET

9th Apr, 2026

banner line />
         </div>
         
          <div class= Register Now

Release Announcement:

Bold BI v16.2.5 has arrived! Explore the latest features here.

3D Pie Chart

Real-Time 3D Pie Chart With Dashboard

Quickly show and understand data categories with our 3D Pie Chart, made to display parts and comparisons clearly, helping you make better choices based on your data.

Explore More SamplesExplore More

How should I proceed?

Download

Download the custom visual from this page.

Publish

Publish the custom visual to your Bold BI® site.

Configure

Add to your dashboard and configure your data.

Visualize

Run the dashboard and get actionable insights.

Use cases

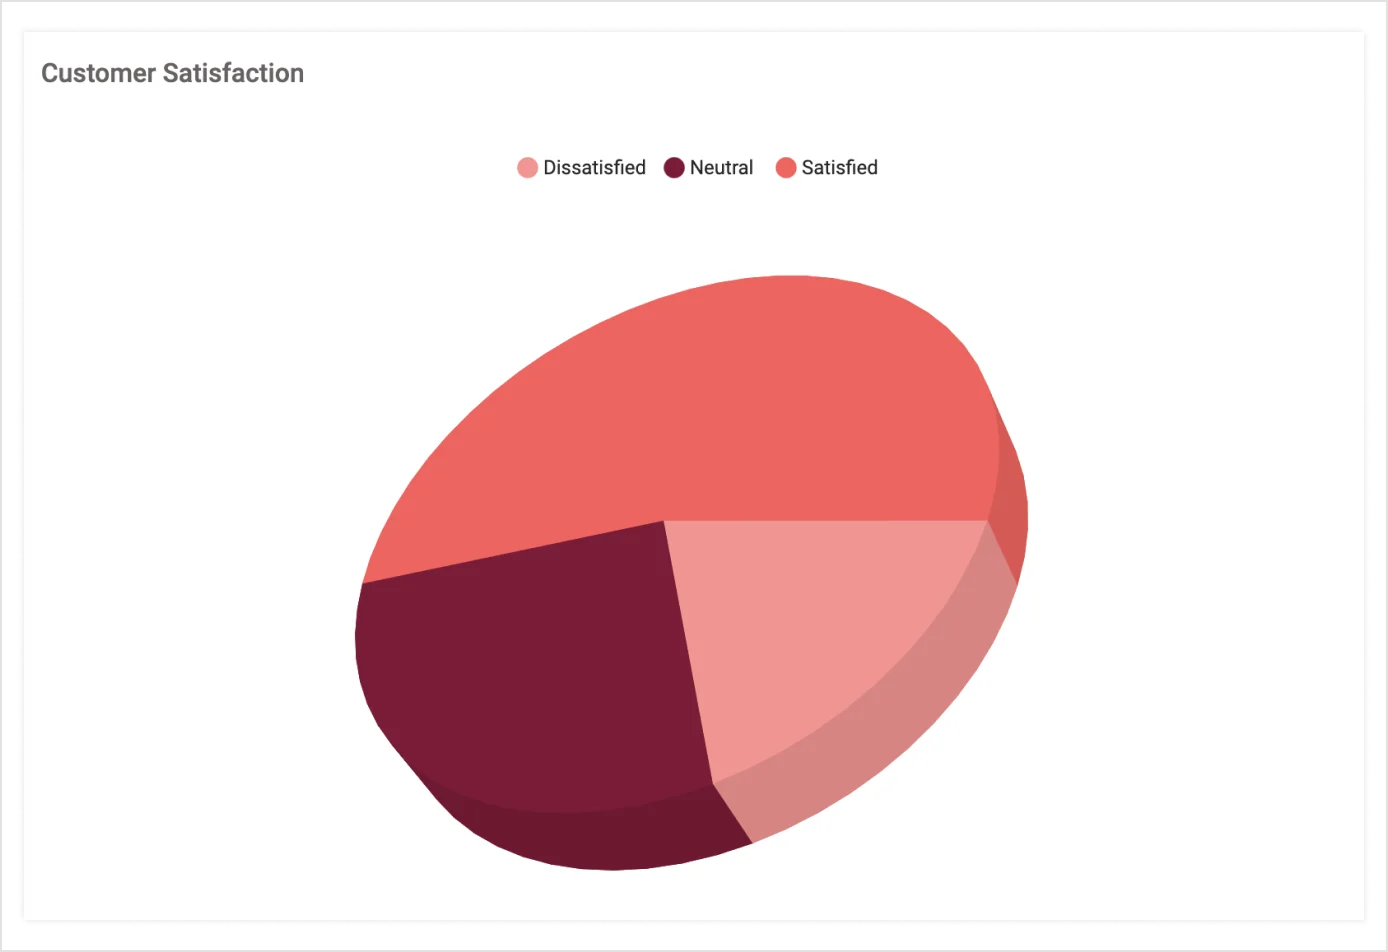
Visualizing Customer Satisfaction

Visualizing Customer Satisfaction

A 3D pie chart that tracks customer satisfaction by showing the percentage of customers who are satisfied, dissatisfied, or neutral regarding a support team's performance.
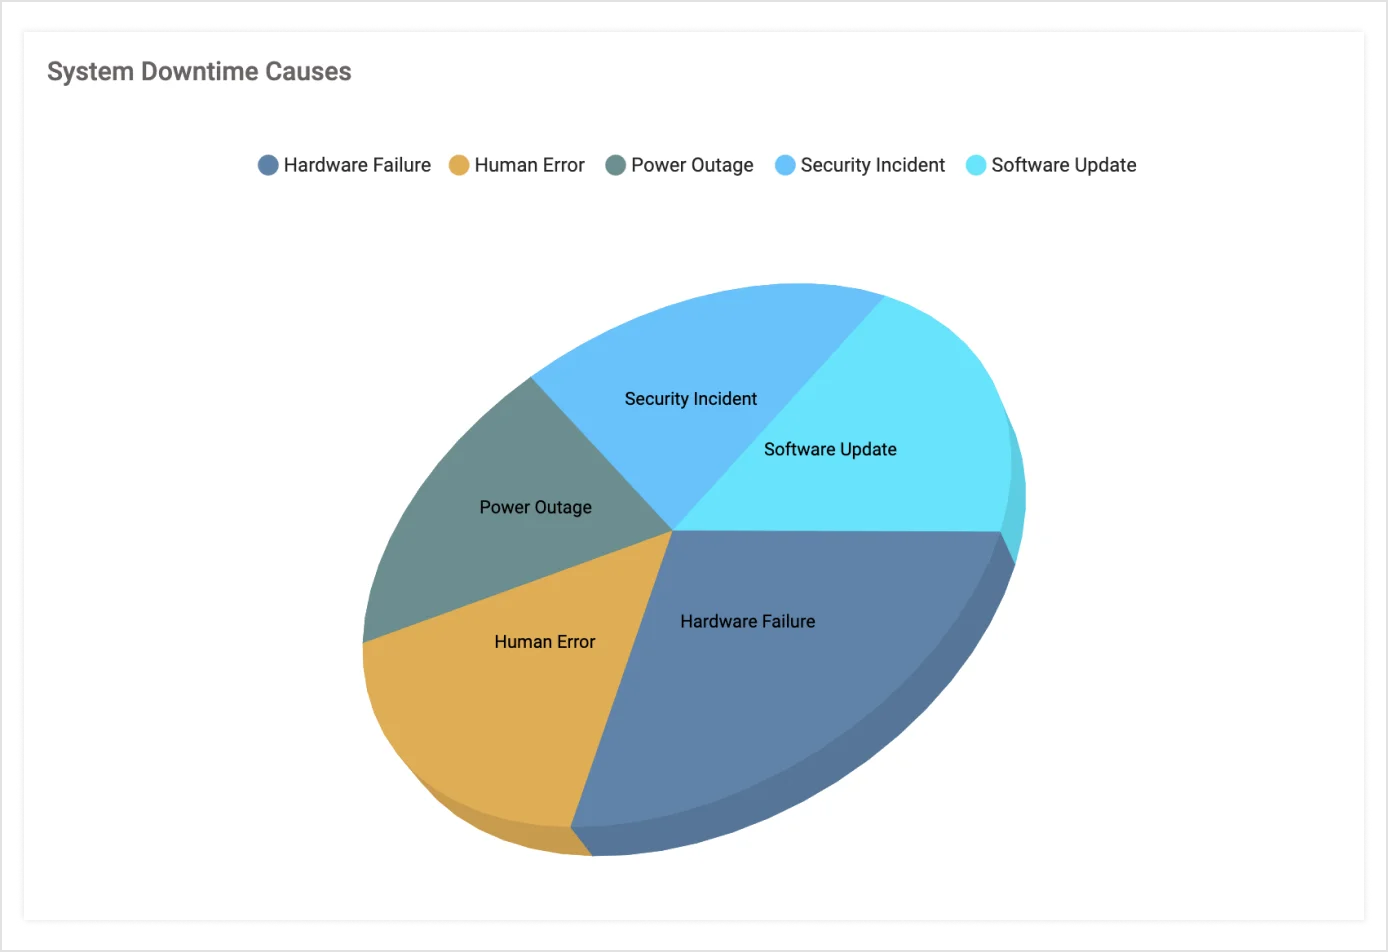
System Downtime Analysis

System Downtime Analysis

Represents the causes of system downtime in a 3D pie chart, breaking downtime into categories such as hardware failures, software issues, maintenance, and external factors.
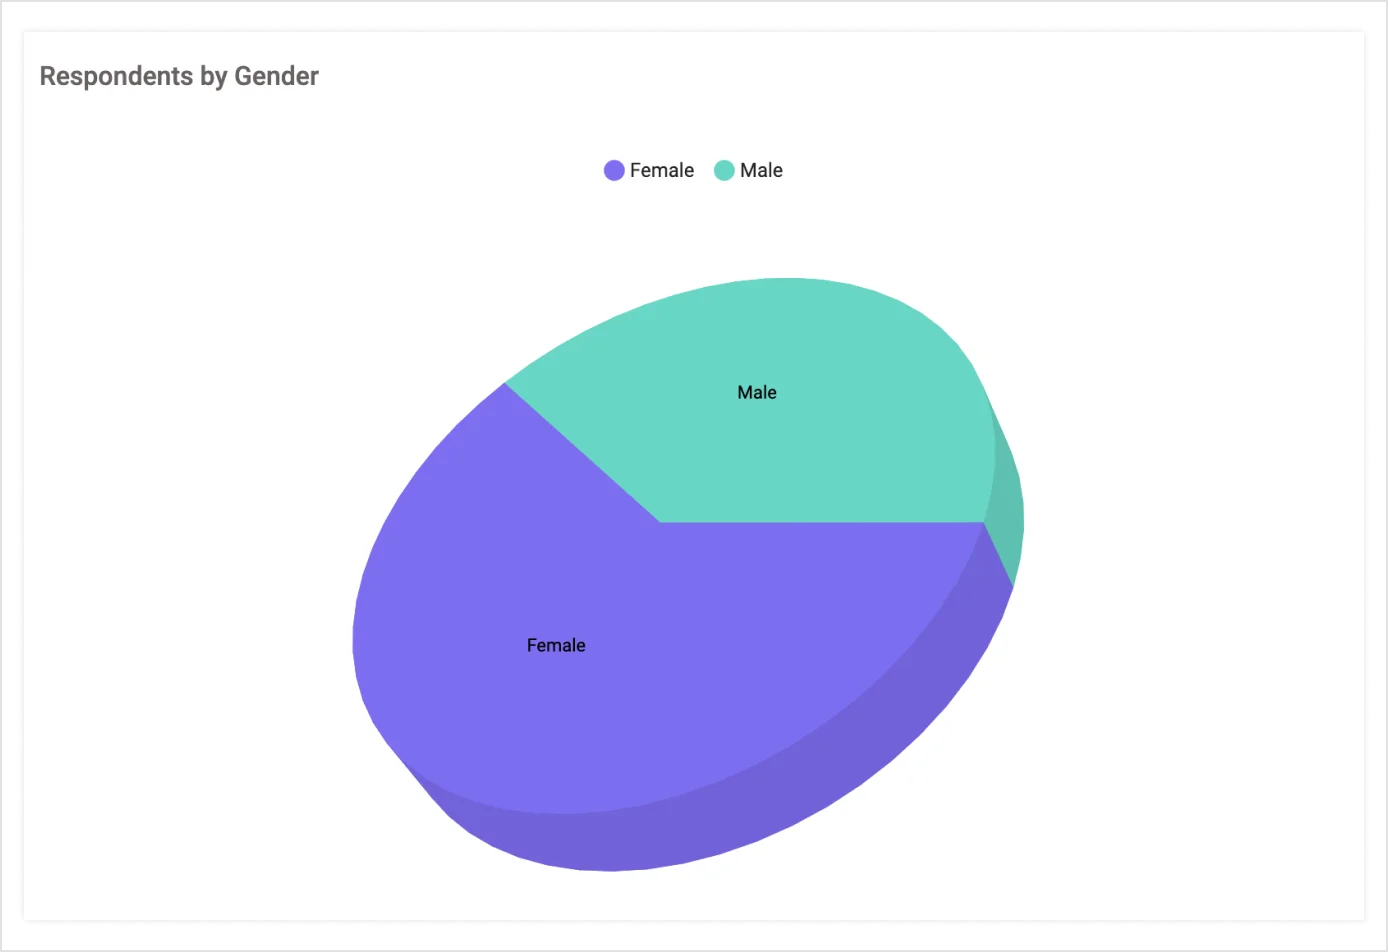
Demographic Insights

Demographic Insights

A 3D pie chart that analyzes survey responses by demographic, showing the percentage of respondents who fall into different categories of age, gender, and location.

Customizing the visuals

Fork the repo to enhance the custom visual on your own and use in your dashboard.

Customizing The Visuals

Want to integrate your custom visual with Bold BI?

Know how to create a custom visual with Bold BI® and integrate with your dashboard.