webinar announcement icon

announcement icon Webinar - 9th Apr 2026, 10:00 AM ET

Webinar: Personalizing Dashboards with Role-Based Access and Row-Level Security

webinar banner line

10:00 AM ET

9th Apr, 2026

banner line />
         </div>
         
          <div class= Register Now

Release Announcement:

Bold BI v16.2.5 has arrived! Explore the latest features here.

Tree View

Real-Time Tree View Chart With Dashboard

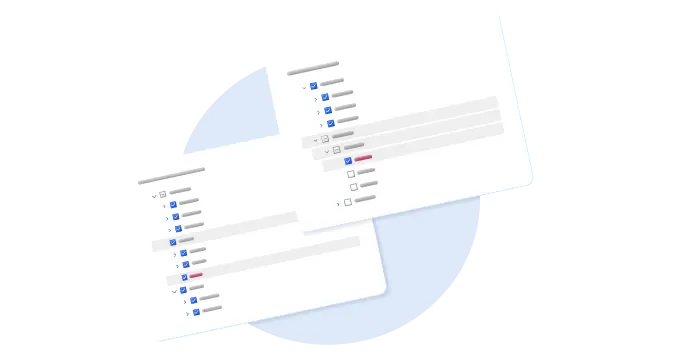
Organize and explore hierarchical data seamlessly with our Tree View, designed for intuitive navigation. Easily drill down into structured relationships to gain clarity and make informed decisions.

Explore More SamplesExplore More

How should I proceed?

Download

Download the custom visual from this page.

Publish

Publish the custom visual to your Bold BI® site.

Configure

Add to your dashboard and configure your data.

Visualize

Run the dashboard and get actionable insights.

Use cases

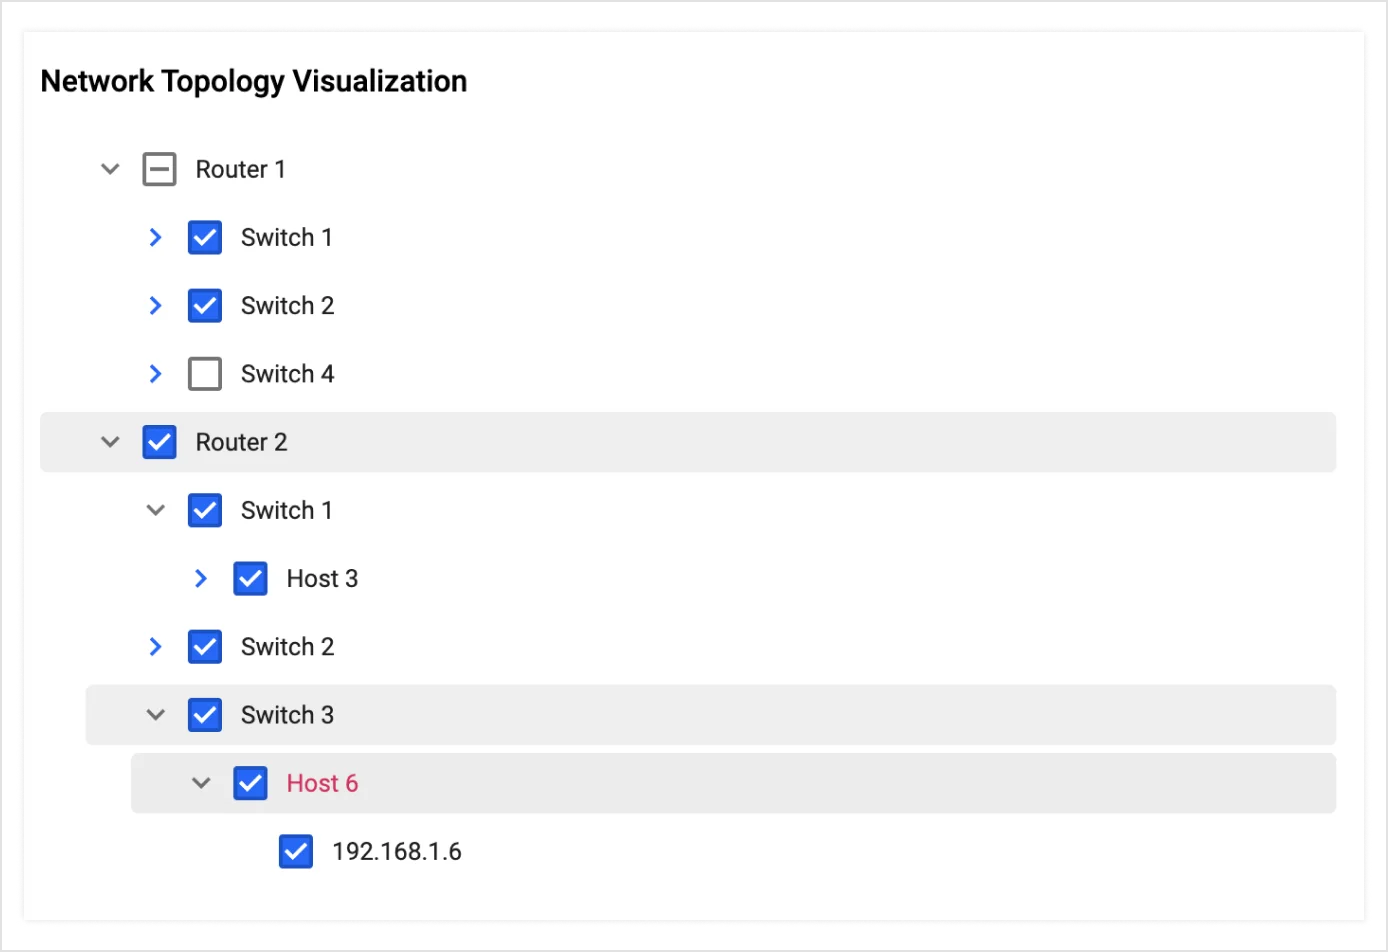
Network Topology Visualization

Network Topology Visualization

Visualize network topology like routers, switches, and serves using a tree-view chart. Configure, monitor, and troubleshoot network devices effectively.
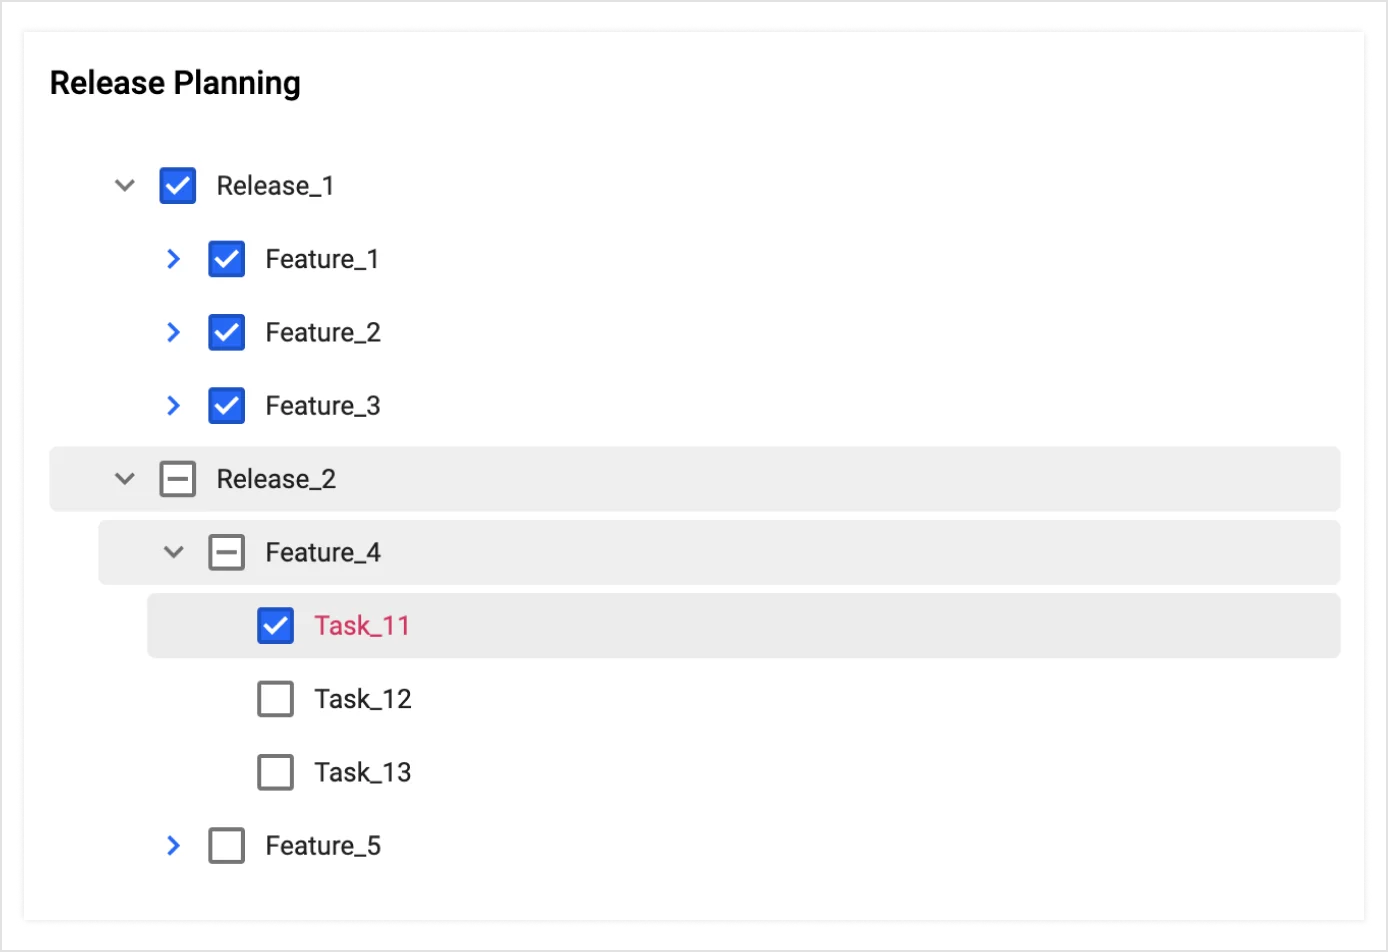
Release Planning

Release Planning

Leverage the tree-view chart to consolidate your release planning data and monitor your planned releases. Use it to visualize the hierarchical breakdown of releases, features, and tasks, ensuring a structured approach to seamless release execution.
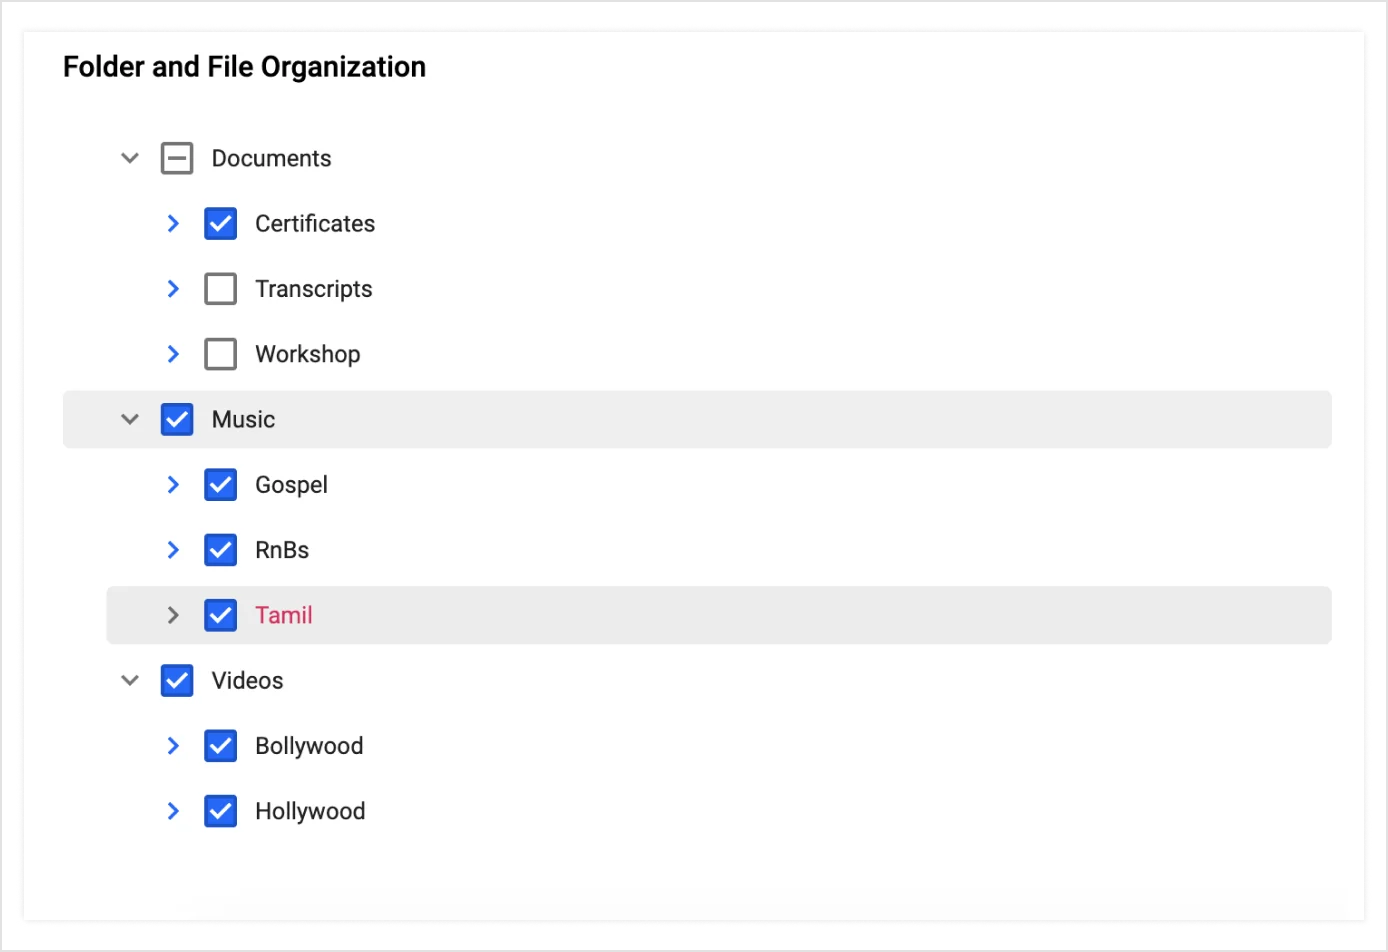
File and Folder Organization

File and Folder Organization

Integrate your document repository with a tree view chart to organize files and folders systematically. Visualize the structure of your documents, and categorize them into folders, subfolders, and files, ensuring effortless access and efficient document management.

Customizing the visuals

Fork the repo to enhance the custom visual on your own and use in your dashboard.

Customizing The Visuals

Want to integrate your custom visual with Bold BI?

Know how to create a custom visual with Bold BI® and integrate with your dashboard.